Review
The Performance of Deep Learning Algorithms on
Automatic Pulmonary Nodule Detection and
Classification Tested on Di
ff
erent Datasets That Are
Not Derived from LIDC-IDRI: A Systematic Review
Dana Li1,2,*, Bolette Mikela Vilmun1,2, Jonathan Frederik Carlsen1, Elisabeth Albrecht-Beste3, Carsten Ammitzbøl Lauridsen1,4, Michael Bachmann Nielsen1,2 and
Kristoffer Lindskov Hansen1,2
1 Department of Diagnostic Radiology, Copenhagen University Hospital, Rigshospitalet, 2100 Copenhagen,
Denmark; [email protected] (B.M.V.); [email protected] (J.F.C.); [email protected] (C.A.L.); [email protected] (M.B.N.);
[email protected] (K.L.H.)
2 Department of Clinical Medicine, University of Copenhagen, 2100 Copenhagen, Denmark
3 Department of Clinical Physiology, Nuclear Medicine and PET, Copenhagen University Hospital,
Rigshospitalet, 2100 Copenhagen, Denmark; [email protected]
4 Department of Technology, Faculty of Health and Technology, University College Copenhagen,
2200 Copenhagen, Denmark
* Correspondence: [email protected]
Received: 5 November 2019; Accepted: 28 November 2019; Published: 29 November 2019
Abstract: The aim of this study was to systematically review the performance of deep learning technology in detecting and classifying pulmonary nodules on computed tomography (CT) scans that were not from the Lung Image Database Consortium and Image Database Resource
Initiative (LIDC-IDRI) database. Furthermore, we explored the difference in performance when
the deep learning technology was applied to test datasets different from the training datasets.
Only peer-reviewed, original research articles utilizing deep learning technology were included in this study, and only results from testing on datasets other than the LIDC-IDRI were included. We searched a total of six databases: EMBASE, PubMed, Cochrane Library, the Institute of Electrical and Electronics Engineers, Inc. (IEEE), Scopus, and Web of Science. This resulted in 1782 studies after duplicates were removed, and a total of 26 studies were included in this systematic review. Three studies explored the performance of pulmonary nodule detection only, 16 studies explored the performance of pulmonary nodule classification only, and 7 studies had reports of both pulmonary
nodule detection and classification. Three different deep learning architectures were mentioned
amongst the included studies: convolutional neural network (CNN), massive training artificial neural network (MTANN), and deep stacked denoising autoencoder extreme learning machine (SDAE-ELM). The studies reached a classification accuracy between 68–99.6% and a detection accuracy between
80.6–94%. Performance of deep learning technology in studies using different test and training
datasets was comparable to studies using same type of test and training datasets. In conclusion, deep
learning was able to achieve high levels of accuracy, sensitivity, and/or specificity in detecting and/or
classifying nodules when applied to pulmonary CT scans not from the LIDC-IDRI database.
Keywords: deep learning; nodule detection; nodule classification; artificial intelligence
Diagnostics2019,9, 207 2 of 14
1. Introduction
Lung cancer is still the leading cause of cancer-related deaths in both the United States [1] and
Europe, where it accounts for 20.9% of all cancer-related deaths [2]. Because of this, efforts have been
made to reduce the incidence of lung cancer, primarily through the promotion of smoking cessation and lung cancer screening of high-risk individuals. Although much has been done with prevention,
there are still around 370,000 new cases of lung cancer each year [2]. It is therefore crucial to diagnose
lung cancer at an early stage to increase patients’ chance of survival.
Early efforts to detect lung cancer through imaging were widely investigated, and no significant
reduction in mortality by screening with traditional chest radiography was reported [3,4]. Since then,
computed tomography (CT) has emerged as an imaging method with superior sensitivity in detecting lung nodules, and screening with CT has been shown to be superior to traditional chest radiography
in reducing mortality from lung cancer [5]. When chest radiographs are replaced by CT scans for
pulmonary cancer assessment, there will inevitably be an increase in workload for the radiologists,
which results in missed cases and errors in diagnostics [6,7].
To aid radiologists in more accurate and time-efficient detection and diagnosis of pulmonary
nodules, several computer-aided diagnosis and detection schemes have been developed [8–10]; the
best known computer-aided diagnosis schemes to distinguish between benign and malignant nodules
are based on volume doubling time [11]. Recently, deep learning has emerged as a more intelligent
and accurate image classification technology [12] and has been adapted to classify medical images
including chest CTs [13,14]. To the best of our knowledge, deep learning technology has yet to be
successfully implemented in an everyday clinical workflow when diagnosing pulmonary nodules. A reason for this may be that deep learning algorithms need to be trained on data that are similar to
the final task data [15]. Most studies have trained and tested their algorithms on the large and publicly
available Lung Image Database Consortium and Image Database Resource Initiative (LIDC-IDRI)
dataset, which makes the studies homogenous [16]. Few studies have tested their algorithms on
datasets not from LIDC-IDRI, and only a subgroup of those have trained their algorithms on datasets
that were not obtained the same way as the final test data [17,18].
The study aim of this systematic review was to investigate how deep learning performs for
pulmonary nodule detection and/or classification of CT scans when the method is tested on datasets
that are not from LIDC-IDRI. Furthermore, the study aim was to investigate whether the performance
of deep learning is reduced when the algorithm is tested on a dataset that is different from the
training dataset.
2. Materials and Methods
Literature Search Strategy
The literature search was completed on 27 May 2019 from six databases: EMBASE, PubMed, Cochrane Library, the Institute of Electrical and Electronics Engineers, Inc. (IEEE), Scopus, and Web of Science. The search was restricted to peer-reviewed publications of original research written in the English language and published in the 10 years preceding the search completion date.
The following specific MESH terms in PubMed were used: “lung”, “respiratory system”, “classification”, “artificial intelligence”, “tomography, emission-computed”, “tomography”, “X-ray”,
and “tomography scanners, X-ray computed”.
The terms were then combined with following text words in the title and/or abstract: “lung”,
“detection” OR “classification” OR “diagnosis”) AND (artificial intelligence (EMTREE term) OR artificial neural network (EMTREE term) OR machine learning (EMTREE term) OR computer assisted diagnosis (EMTREE term) OR “neural network” OR “deep learning”) AND (lung (EMTREE term) OR “pulmonary”) AND (whole body CT (EMTREE term) OR computer assisted tomography (EMTREE
term) OR “CT” OR “computed tomography” OR “computer tomography”).
After removal of duplicates, all titles and abstracts retrieved from the searches were independently screened by two authors (DL and BMV). If the two authors could not reach an agreement on a study, a third author (JFC) assessed and resolved the disagreement. Data were extracted by DL and BMV via of pre-piloted forms. To describe the performance of the proposed deep learning algorithms on
detection and/or classification of pulmonary nodules, we used a combination of narrative synthesis
and compared measures of sensitivity, specificity, area under the curve (AUC), and accuracy if these were available. If information from a confusion matrix was available, sensitivity and specificity were independently calculated by DL and double-checked by BMV.
3. Study Inclusion Criteria
Peer-reviewed original research articles published after 2009 were reviewed for inclusion in this
systematic review. Studies that examined the use of machine learning in detection and/or classification
of pulmonary nodules were selected
1 If the technology was based on deep learning or had primary components of deep learning
algorithms used to either detect pulmonary nodules and/or classify these nodules into
different categories,
and
2 if the deep learning algorithm was tested on CT scans that were not part of or derived from the
LIDC-IDRI database, and
3 if any performance measures were reported, preferably in the form of, but not limited to sensitivity,
specificity, accuracy, and/or AUC.
If more than one algorithm based on the same type of deep learning architecture was tested in the same study, the best performing algorithm was chosen for the results. Datasets were defined as
different if the included CT images were obtained from different hospitals/locations/types of databases.
Diagnostics2019,9, 207 4 of 14
Diagnostics 2019, 9, x FOR PEER REVIEW 4 of 15
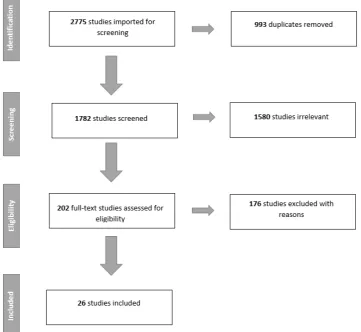
Figure 1. Preferred reporting items for systematic reviews and meta-analyses (PRISMA) flowchart of the literature search and study selection.
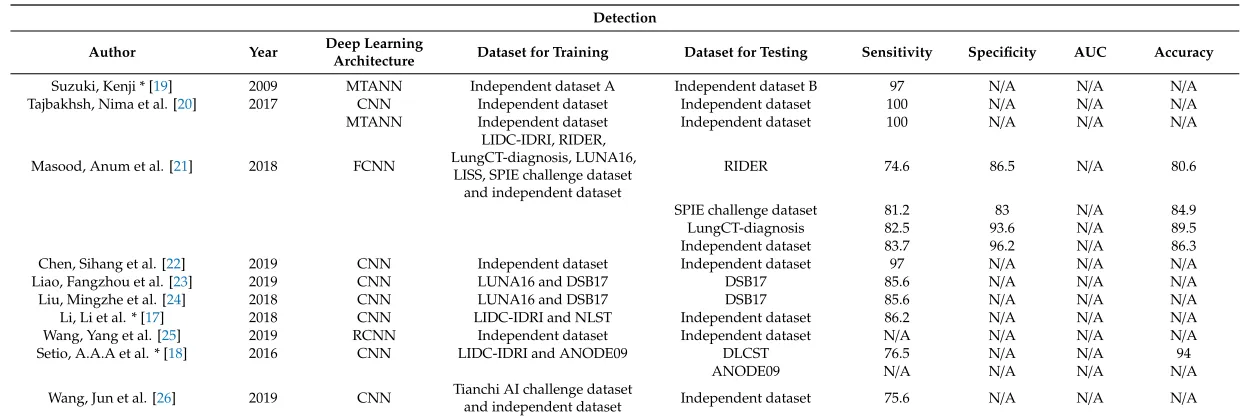
Table 1.Performance of the studies exploring detection of pulmonary nodules.
Detection Author Year Deep Learning
Architecture Dataset for Training Dataset for Testing Sensitivity Specificity AUC Accuracy
Suzuki, Kenji * [19] 2009 MTANN Independent dataset A Independent dataset B 97 N/A N/A N/A Tajbakhsh, Nima et al. [20] 2017 CNN Independent dataset Independent dataset 100 N/A N/A N/A
MTANN Independent dataset Independent dataset 100 N/A N/A N/A
Masood, Anum et al. [21] 2018 FCNN
LIDC-IDRI, RIDER, LungCT-diagnosis, LUNA16,
LISS, SPIE challenge dataset and independent dataset
RIDER 74.6 86.5 N/A 80.6
SPIE challenge dataset 81.2 83 N/A 84.9
LungCT-diagnosis 82.5 93.6 N/A 89.5
Independent dataset 83.7 96.2 N/A 86.3 Chen, Sihang et al. [22] 2019 CNN Independent dataset Independent dataset 97 N/A N/A N/A
Liao, Fangzhou et al. [23] 2019 CNN LUNA16 and DSB17 DSB17 85.6 N/A N/A N/A
Liu, Mingzhe et al. [24] 2018 CNN LUNA16 and DSB17 DSB17 85.6 N/A N/A N/A
Li, Li et al. * [17] 2018 CNN LIDC-IDRI and NLST Independent dataset 86.2 N/A N/A N/A Wang, Yang et al. [25] 2019 RCNN Independent dataset Independent dataset N/A N/A N/A N/A
Setio, A.A.A et al. * [18] 2016 CNN LIDC-IDRI and ANODE09 DLCST 76.5 N/A N/A 94
ANODE09 N/A N/A N/A N/A
Wang, Jun et al. [26] 2019 CNN Tianchi AI challenge dataset
and independent dataset Independent dataset 75.6 N/A N/A N/A
Diagnostics2019,9, 207 6 of 14
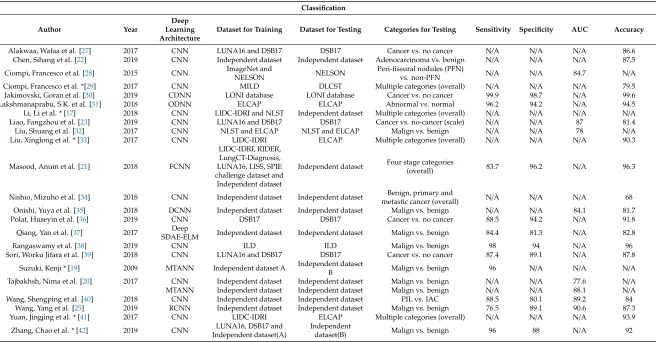
Table 2.Performance of studies exploring classification of pulmonary nodules.
Classification Author Year
Deep Learning Architecture
Dataset for Training Dataset for Testing Categories for Testing Sensitivity Specificity AUC Accuracy
Alakwaa, Wafaa et al. [27] 2017 CNN LUNA16 and DSB17 DSB17 Cancer vs. no cancer N/A N/A N/A 86.6 Chen, Sihang et al. [22] 2019 CNN Independent dataset Independent dataset Adenocarcinoma vs. benign N/A N/A N/A 87.5 Ciompi, Francesco et al. [28] 2015 CNN ImageNet andNELSON NELSON Peri-fissural nodules (PFN)vs. non-PFN N/A N/A 84.7 N/A Ciompi, Francesco et al. *[29] 2017 CNN MILD DLCST Multiple categories (overall) N/A N/A N/A 79.5 Jakimovski, Goran et al. [30] 2019 CDNN LONI database LONI database Cancer vs. no cancer 99.9 98.7 N/A 99.6 Lakshmanaprabu, S.K. et al. [31] 2018 ODNN ELCAP ELCAP Abnormal vs. normal 96.2 94.2 N/A 94.5 Li, Li et al. * [17] 2018 CNN LIDC-IDRI and NLST Independent dataset Multiple categories (overall) N/A N/A N/A N/A Liao, Fangzhou et al. [23] 2019 CNN LUNA16 and DSB17 DSB17 Cancer vs. no-cancer (scale) N/A N/A 87 81.4 Liu, Shuang et al. [32] 2017 CNN NLST and ELCAP NLST and ELCAP Malign vs. benign N/A N/A 78 N/A Liu, Xinglong et al. * [33] 2017 CNN LIDC-IDRI ELCAP Multiple categories (overall) N/A N/A N/A 90.3
Masood, Anum et al. [21] 2018 FCNN
LIDC-IDRI, RIDER, LungCT-Diagnosis, LUNA16, LISS, SPIE challenge dataset and Independent dataset
Independent dataset Four stage categories(overall) 83.7 96.2 N/A 96.3
Nishio, Mizuho et al. [34] 2018 CNN Independent dataset Independent dataset metastic cancer (overall)Benign, primary and N/A N/A N/A 68 Onishi, Yuya et al. [35] 2018 DCNN Independent dataset Independent dataset Malign vs. benign N/A N/A 84.1 81.7
Polat, Huseyin et al. [36] 2019 CNN DSB17 DSB17 Cancer vs. no cancer 88.5 94.2 N/A 91.8
Qiang, Yan et al. [37] 2017 Deep
SDAE-ELM Independent dataset Independent dataset Malign vs. benign 84.4 81.3 N/A 82.8
Rangaswamy et al. [38] 2019 CNN ILD ILD Malign vs. benign 98 94 N/A 96
Sori, Worku Jifara et al. [39] 2018 CNN LUNA16 and DSB17 DSB17 Cancer vs. no cancer 87.4 89.1 N/A 87.8 Suzuki, Kenji * [19] 2009 MTANN Independent dataset A Independent dataset
B Malign vs. benign 96 N/A N/A N/A
Tajbakhsh, Nima et al. [20] 2017 CNN Independent dataset Independent dataset Malign vs. benign N/A N/A 77.6 N/A MTANN Independent dataset Independent dataset Malign vs. benign N/A N/A 88.1 N/A Wang, Shengping et al. [40] 2018 CNN Independent dataset Independent dataset PIL vs. IAC 88.5 80.1 89.2 84
Wang, Yang et al. [25] 2019 RCNN Independent dataset Independent dataset Malign vs. benign 76.5 89.1 90.6 87.3 Yuan, Jingjing et al. * [41] 2017 CNN LIDC-IDRI ELCAP Multiple categories (overall) N/A N/A N/A 93.9 Zhang, Chao et al. * [42] 2019 CNN Independent dataset(A)LUNA16, DSB17 and Independentdataset(B) Malign vs. benign 96 88 N/A 92
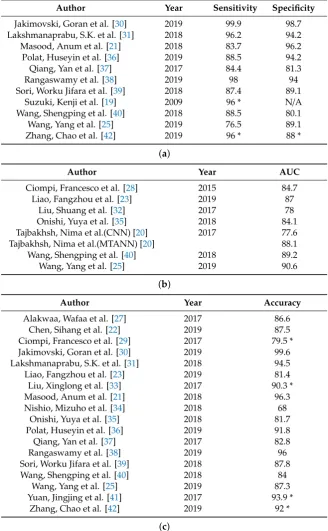
Table 3. Studies that provided classification performance results in (a) sensitivity and specificity, (b) AUC, and (c) accuracy.
Author Year Sensitivity Specificity
Jakimovski, Goran et al. [30] 2019 99.9 98.7 Lakshmanaprabu, S.K. et al. [31] 2018 96.2 94.2 Masood, Anum et al. [21] 2018 83.7 96.2 Polat, Huseyin et al. [36] 2019 88.5 94.2 Qiang, Yan et al. [37] 2017 84.4 81.3
Rangaswamy et al. [38] 2019 98 94
Sori, Worku Jifara et al. [39] 2018 87.4 89.1 Suzuki, Kenji et al. [19] 2009 96 * N/A Wang, Shengping et al. [40] 2018 88.5 80.1 Wang, Yang et al. [25] 2019 76.5 89.1 Zhang, Chao et al. [42] 2019 96 * 88 *
(a)
Author Year AUC
Ciompi, Francesco et al. [28] 2015 84.7 Liao, Fangzhou et al. [23] 2019 87
Liu, Shuang et al. [32] 2017 78
Onishi, Yuya et al. [35] 2018 84.1 Tajbakhsh, Nima et al.(CNN) [20] 2017 77.6 Tajbakhsh, Nima et al.(MTANN) [20] 88.1 Wang, Shengping et al. [40] 2018 89.2 Wang, Yang et al. [25] 2019 90.6
(b)
Author Year Accuracy
Alakwaa, Wafaa et al. [27] 2017 86.6 Chen, Sihang et al. [22] 2019 87.5 Ciompi, Francesco et al. [29] 2017 79.5 * Jakimovski, Goran et al. [30] 2019 99.6 Lakshmanaprabu, S.K. et al. [31] 2018 94.5 Liao, Fangzhou et al. [23] 2019 81.4 Liu, Xinglong et al. [33] 2017 90.3 * Masood, Anum et al. [21] 2018 96.3 Nishio, Mizuho et al. [34] 2018 68
Onishi, Yuya et al. [35] 2018 81.7 Polat, Huseyin et al. [36] 2019 91.8 Qiang, Yan et al. [37] 2017 82.8
Rangaswamy et al. [38] 2019 96
Sori, Worku Jifara et al. [39] 2018 87.8 Wang, Shengping et al. [40] 2018 84
Wang, Yang et al. [25] 2019 87.3 Yuan, Jingjing et al. [41] 2017 93.9 *
Zhang, Chao et al. [42] 2019 92 *
(c)
Results marked with * are from studies where test dataset was different from training dataset.
4. Literature Search Results
A total of 26 studies were included in this review. Due to the heterogeneity of the results from
the different studies, it was not possible to perform a meta-analysis. Figure1summarizes the study
selection as a PRISMA flowchart. Ten studies investigated the use of deep learning for nodule detection
Diagnostics2019,9, 207 8 of 14
(Table2). Seven studies reported results on both detection and classification performance. Table3
shows the performance of the different algorithms for nodule classification when arranged after specific
types of performance measurements.
Three different deep learning algorithms were mentioned in the studies: convolutional neural
network (CNN), massive training artificial neural network (MTANN), and deep supervised denoising autoencoder architecture based on extreme learning machine (SDAE-ELM). CNN and MTANN are both end-to-end machine-learning algorithms, meaning that inputs are complete pixelated images and are processed without known components of specific feature detection and trained using backpropagation. MTANN outputs an image with the likelihood of it being a certain class, while CNN usually outputs
results in class categories instead of images [43]. The advantage of MTANN is fewer training cases
compared to CNN without compromising classification performance [20]. SDAE-ELM is a feature
vector deep learning algorithm combined with ELM, which is a feed-forward neural network [37]. The
advantages of stacked autoencoders include fewer training cases compared to, for example, CNN, since stacked autoencoders are able to generate new images from the image characteristic feature
vectors [44].
5. Detection Only (3 Studies)
Setio et al. [18] and Liu et al. [24] both proposed CNN-based algorithms for pulmonary nodule
detection. Setio et al. [18] tested their CNN-based program (ConvNets) on cases from the Danish Lung
Cancer Screening Trial (DLCST), while Liu et al. [24] tested their algorithm on the Kaggle Data Science
Bowl 2017 (DSB17) [45]. A third study by Wang et al. [26] tested their faster region-CNN (RCNN)
based program on cases from an independent database and achieved 75.6% sensitivity on nodule
detection. All studies reached a sensitivity between 75.6–85.6%. Only Setio et al. [18] published an
accuracy rate, which was 94% (Table1).
Setio et al. [18] trained and tested their algorithm on different types of datasets and achieved a
sensitivity of 76.5%, while Liu et al. [24] and Wang et al. [26] both tested and trained their algorithm on
the same type of dataset and achieved a sensitivity of 75.6% and 85.6%, respectively (Tables1and3).
6. Classification Only (16 Studies)
For studies that only reported results on classification performance, five studies [34,35,37,40,42]
tested on local, independently obtained datasets. All studies provided reports of accuracy, which
ranged between 68–92%. Four of these studies [34,35,40,42] had deep learning architectures based on
CNN, while only Qiang et al. [37] used SDAE-ELM. For Nishio et al. [34], sensitivity and specificity
were calculated from values given in a confusion matrix for benign, primary cancer, and metastatic
cancer as 50.1% and 84.4%, 77.6% and 77.4%, and 74% and 88.2%, respectively. Onishi et al. [35] had an
overall classification accuracy of 81.7%. The rest of the studies [37,40,42] categorized their nodules into
malign or benign types and reached a sensitivity between 84.4–96% (Table2).
Four studies [31–33,41] tested their CNN-based algorithm on the Early Lung Cancer Action
Program (ELCAP) public lung database [46]. Besides Liu et al. [32], who did not provide reports
on accuracy, the other studies [31,33,41] reached classification accuracies between 90.3–94.5%.
Both Liu et al. [33] and Yuan et al. [41] classified nodules into multiple categories and calculated the
proportion of a specific nodule type, e.g., the proportion of classified well-circumscribed nodules actually
well circumscribed, which was 95.0% for Liu et al. and 96.1% for Yuan et al. Lakshmanaprabu et al. [31]
tested whether different CT images were categorized correctly as to whether an image was normal or
contained malign or benign nodules; results are displayed in Table2.
Three studies [27,36,39] reported classification results tested on the DSB17 dataset [45]. They
were all CNN-based algorithms testing whether a patient had cancer or no cancer without testing the individual nodule. They reached accuracy levels between 86.6–91.8%. Other studies that reported results on classification only tested on a variety of dataset types. All had algorithms based on CNN
Cancer Screening Trial (Dutch acronym; NELSON [47] and, in a later study [29], they tested for solid (recall; 82.2%), non-solid (recall; 87.4%), part-solid (recall; 64.9%), calcified (recall; 82.8%), peri-fissural (recall; 60.4%), and spiculated nodules (recall; 64.3%) on patients from the DLCST.
Jakimovski and Davcev [30] used an algorithm that was both trained and tested on the Image
and Data Archive of the University of South Carolina and Laboratory of Neuro Imaging (LONI
database) [48] and achieved an accuracy of 99.6%, a sensitivity of 99.9%, and specificity of 98.6% for
their best-performing algorithm. The algorithm from Jakimovski et al. [30] outputted a single decimal
value between 0.0 and 1.0, where 0.0 was not cancer and 1.0 was cancer. They converted the value to a percentage and set a minimal threshold value at 73% before the image was categorized as cancer. The output was matched to the original database results classified by medical personnel as cancerous
or not based on lung tissue biopsy [48]. Rangaswamy et al. [38] trained and tested three different
classifiers on the publicly available database of interstitial lung disease (ILD) [49] and categorized
the CT images into whether or not they contained malign or benign nodules. They found that CNN achieved the best classification result compared to the other classifiers used and achieved an accuracy
of 96% (Table2).
For the above-mentioned studies, which only investigated classification performance, four
studies [29,33,41,42] trained and tested on different types of datasets and achieved accuracies between
79.5–93.6%. The rest of the studies [27,28,30–32,34–40] trained and tested on the same types of datasets
and achieved accuracies between 68–99.6% (Tables2and3).
7. Both Detection and Classification (7 Studies)
Five studies [17,19,20,22,25] had results on both classification and detection and tested on local,
independently obtained datasets. While all the studies tested a CNN architecture, Tajbakhsh and
Suzuki [20] tested both CNN- and MTANN-based algorithms. Three of the studies [17,19,22] measured
detection performance using sensitivity and they reached levels between 86.2–97% (Table1). Tajbakhsh
and Suzuki [20] collected information of false positives when 100% sensitivity was achieved with
MTANN and CNN, which resulted in 2.7 and 22.7 false positives per patient, respectively. Detection
performance was measured by Wang et al. [25] using the kappa consistency coefficient and reached 0.94
when compared to human experts. On classification, four of the above-mentioned studies [19,20,22,25]
tested on dichotomous categories. Two of the studies [20,25] reported AUC values of 77.6% and 90.6%.
Chen et al. [22] achieved an overall classification accuracy of 87.5% when classifying adenocarcinomas
and benign nodules, and Suzuki [19] achieved 96% sensitivity when classifying malign nodules
(Table2). Li et al. [17] tested the performance of characterizing nodules into three pulmonary nodule
categories: solid (sensitivity: 90.3%; specificity: 100%), part-solid (sensitivity: 55.5%; specificity: 93%), and ground glass types (sensitivity: 100%; specificity: 96.1%).
The rest of the studies [21,23] tested on different types of datasets. Liao et al. [23] tested on data
from DSB17 [45], while Masood et al. [21] tested on four different types of datasets for pulmonary
nodule detection and on independently obtained data for classification performance. On detection,
they reached a sensitivity of 85.6% and 74.6% (Table1). Liao et al. [23] classified data into dichotomous
categories, while Masood et al. [21] classified pulmonary nodules into four nodule stages. They reached
classification accuracies of 81.4% and 96.3%, respectively (Table2).
On detection, two studies [17,19] tested and trained on different types of datasets and achieved
sensitivities of 86.2% and 97.0%, while the studies that trained and tested on the same types of
dataset [20–23,25] had sensitivities between 74.6–97% (Table1). On classification, the two studies [17,19]
that trained and tested on different types of dataset achieved sensitivities of 96% and 100%, and the
studies that trained and tested on the same types of dataset [20–23,25] achieved sensitivities between
Diagnostics2019,9, 207 10 of 14
8. Discussion
We found a total of 26 studies that tested deep learning algorithms on datasets that were not
from the LIDC-IDRI database. Of these studies, 27% (n=7) tested their algorithms on datasets that
were different from training datasets. We found that for testing diagnostic accuracy of pulmonary
nodules on CT scans, CNN was the preferred deep learning architecture, followed by MTANN and deep SDAE-ELM.
Several other studies have trained and tested deep learning algorithms on the large, publicly
accessible LIDC-IDRI database [16] and, recently, a systematic review was published overviewing the
different studies that have tested on this database [50]. However, to review deep learning performance
it is also necessary to review studies that did not use the LIDC-IDRI, as CT scans may vary from region to region. Hence, in this paper, only studies not using the LIDC-IDRI were included.
Algorithms with CNN architecture reached accuracies between 68–99.6% (Table2) on classification
and 80.6–94% (Table1) on detection. Compared to a previous study using CNN-based algorithms
on CT scans from the LIDC-IDRI [50], there was no observed difference in classification accuracy.
Sensitivity and specificity for classification found in this review were between 76.5–99.9% and 80.1–98.7%
(Table2), respectively, which are also comparable to results of the CNN-based algorithms tested on
the LIDC-IDRI [50]. Only Li et al. [17], who trained their algorithm on the LIDC-IDRI but tested on
an independent dataset, had a noticeably low sensitivity result when classifying part-solid nodules (55.5%), and their algorithm was generally outperformed by double reading by radiologists on all categories (solid, part-solid, and ground glass).
MTANN reached a sensitivity of 97–100% on nodule detection (Table1) and an AUC of 77.6–88.1%
on classification (Table2). This was generally higher than the sensitivity results reached by CNN
for detection (74.6–97%) and classification AUC (78–90.6%). Some studies explored the difference in
detection and classification performance between MTANN and CNN, and generally found MTANN to
perform better than CNN [20,51]. One study [52] found that MTANN required much fewer training
data compared to CNN, which could lead to a faster implementation of deep learning technology in a clinical setting, since fewer resources have to be allocated for training. Further investigations of MTANN as a pulmonary nodule diagnosis system are required, since CNN is still the most frequently
used deep learning architecture for pulmonary nodule diagnosis [50].
We only found one study [37] that used an architecture other than MTANN or CNN. Qiang et al. [37]
proposed a lung nodule classification system based on deep SDAE-ELM. The results were comparable to results obtained by CNN- and MTANN-based algorithms. To the best of our knowledge, no other study has yet investigated the deep SDAE-ELM architecture for pulmonary nodule diagnostics in CT images.
The two main issues with deep learning in imaging diagnostics are small training datasets and overfitting. To prevent the algorithm from overfitting, e.g., diagnosing background noise to be something of importance, more training data are required, which can be cumbersome in a clinical
setting [53]. Studies have therefore examined transferability in deep learning, and some studies suggest
that test data should be similar to training data for improved recognition results [15].
In our study, no tendency of reduced performance was observed for the algorithms trained and
tested on different datasets compared to the algorithms tested and trained on the same type of dataset.
When classification performance was measured using sensitivity (Table3a), studies that used same
type of dataset for test and training ranged between 76.5–99.9%, while the two studies [19,42] that
tested and trained on different types of datasets had a sensitivity of 96%. We found no studies that
trained and tested on different types of datasets measuring performance in AUC (Table3b). Accuracy
results for studies that tested and trained on same type of dataset were between 68–96.3%, while
accuracy results from studies that tested and trained on different types of datasets were between
79.5–93.9% (Table3c). All studies reported sensitivity of detection. Sensitivity ranged from 74.697% for
studies tested and trained on same type of dataset, and from 76.6–97% for studies tested and trained
suggests that comparable results can be reached despite datasets being of different patient composition and scan parameters, as long as they are similar in the underlying category and source type, e.g.,
lung nodule detection and CT [54]. Because of this tendency, studies have had success with training
their algorithms through pre-training [55], transfer learning [56], and/or fine-tuning [57] to bypass the
problem of a small training dataset, in addition to developing variations of algorithms that are based on other deep learning technologies besides the popular CNN, e.g., MTANN and deep SDAE-ELM.
The heterogeneity of the included studies was a limitation of this review, since this prevented us from performing a meta-analysis to statistically compare the performance of deep learning algorithms.
Thus, our study could not conclude whether there was a statistically significant difference in the
performance of detection and/or classification by deep learning when trained and tested on the same or
on different types of datasets. There may also be a risk of publication bias in these types of studies, since
it may not seem relevant for the authors to submit research for publication with low or negative results of their algorithm. However, our study strengths include many studies from a variety of literature search engines and a systematic literature search ensuring that no relevant studies were missed.
Several large companies have invested in researching deep learning in general image recognition
of day-to-day objects [58,59] and, recently, some vendors have moved towards automatic recognition
in clinical radiology [60]. With the increasing popularity of artificial intelligence emerging in healthcare
and the increasing workload for radiologists, it would be wise to implement deep learning in clinical practice, but, to the best of our knowledge, there has not been any consistent, standardized incorporation of deep learning into the workflow of clinical radiology for pulmonary nodules. The next step should be to move forward with research on the clinical applications and use of deep learning in medical imaging and day-to-day workflow.
9. Conclusions
Studies on deep learning found high levels of accuracy, sensitivity, and/or specificity in detecting
and/or classifying pulmonary nodules on CT scans that were not from the LIDC-IDRI database.
A tendency of comparable performance levels was observed regardless of whether the deep learning
algorithms were trained and tested on the same type of dataset or on different types of dataset. To aid
radiologists in their diagnostic work, artificial intelligence will become a valuable tool in the future,
providing more accurate and time-efficient detection and diagnosis of pulmonary nodules; however,
more studies and development are warranted.
Author Contributions:Conceptualization, D.L., C.A.L., J.F.C., M.B.N. and K.L.H.; Methodology, D.L., B.M.V., J.F.C., E.A.-B., M.B.N. and K.L.H.; Investigation, D.L., B.M.V., J.F.C. and K.L.H.; Data acquisition, D.L.; Writing—Original Draft Preparation, D.L.; Writing—Review & Editing, D.L., B.M.V., J.F.C., E.A.-B., C.A.L., M.B.N. and K.L.H.; Supervision, J.F.C., M.B.N. and K.L.H.; Project Administration, D.L.; Funding Acquisition, M.B.N.
Conflicts of Interest:The authors declare no conflict of interest.
References
1. Siegel, R.L.; Miller, K.D.; Jemal, A. Cancer statistics, 2019. CA Cancer J. Clin. 2019,69, 7–34. [CrossRef] [PubMed]
2. Data Explorer ECIS. Available online:https://ecis.jrc.ec.europa.eu/explorer.php?$0-0$1-AE28E$2-All$4-1, 2$3-All$6-0,14$5-2008,2008$7-8$CEstByCancer$X0_8-3$CEstRelativeCanc$X1_8-3$X1_9-AE28(accessed on 5 August 2008).
3. Fontana, R.S. The Mayo Lung Project: A perspective.Cancer2000,89, 2352–2355. [CrossRef]
4. Oken, M.M.; Hocking, W.G.; Kvale, P.A.; Andriole, G.L.; Buys, S.S.; Church, T.R.; Crawford, E.D.; Fouad, M.N.; Isaacs, C.; Reding, D.J.; et al. Screening by chest radiograph and lung cancer mortality: The Prostate, Lung, Colorectal, and Ovarian (PLCO) randomized trial.JAMA2011,306, 1865–1873. [CrossRef]
Diagnostics2019,9, 207 12 of 14
6. Krupinski, E.A.; Berbaum, K.S.; Caldwell, R.T.; Schartz, K.M.; Madsen, M.T.; Kramer, D.J. Do Long Radiology Workdays Impact Nodule Detection in Dynamic CT Interpretation? J. Am. Coll. Radiol. 2012,9, 191–198. [CrossRef]
7. Sokolovskaya, E.; Shinde, T.; Ruchman, R.B.; Kwak, A.J.; Lu, S.; Shariff, Y.K.; Wiggins, E.F.; Talangbayan, L. The Effect of Faster Reporting Speed for Imaging Studies on the Number of Misses and Interpretation Errors: A Pilot Study.J. Am. Coll. Radiol.2015,12, 683–688. [CrossRef]
8. Ozekes, S.; Osman, O. Computerized lung nodule detection using 3D feature extraction and learning based algorithms.J. Med. Syst.2010,34, 185–194. [CrossRef]
9. Armato, S.G., 3rd; Li, F.; Giger, M.L.; MacMahon, H.; Sone, S.; Doi, K. Lung cancer: Performance of automated lung nodule detection applied to cancers missed in a CT screening program.Radiology2002,225, 685–692. [CrossRef]
10. Huang, P.; Park, S.; Yan, R.; Lee, J.; Chu, L.C.; Lin, C.T.; Hussien, A.; Rathmell, J.; Thomas, B.; Chen, C.; et al. Added Value of Computer-aided CT Image Features for Early Lung Cancer Diagnosis with Small Pulmonary Nodules: A Matched Case-Control Study.Radiology2018,286, 286–295. [CrossRef]
11. Revel, M.P.; Merlin, A.; Peyrard, S.; Triki, R.; Couchon, S.; Chatellier, G.; Frija, G. Software volumetric evaluation of doubling times for differentiating benign versus malignant pulmonary nodules.AJR Am. J. Roentgenol.2006,187, 135–142. [CrossRef]
12. Krizhevsky, A.; Sutskever, I.; Hinton, G.E. ImageNet Classification with Deep Convolutional Neural Networks. In Proceedings of the Neural Information Processing Systems 25 (NIPS), Lake Tahoe, CA, USA, 3–6 December 2012.
13. Chen, G.-L.; Zhang, J.-J.; Zhuo, D.-Y.; Pan, Y.-N.; Pang, C.-Y. Identification of pulmonary nodules via CT images with hierarchical fully convolutional networks. Med Biol. Eng. Comput. 2019,57, 1567–1580. [CrossRef] [PubMed]
14. Sava¸s, S.; Topalo ˘glu, N.; Kazcı, Ö.; Ko¸sar, P.N. Classification of Carotid Artery Intima Media Thickness Ultrasound Images with Deep Learning.J. Med. Syst.2019,43, 273. [CrossRef] [PubMed]
15. Azizpour, H.; Razavian, A.S.; Sullivan, J.; Maki, A.; Carlsson, S.From Generic to Specific Deep Representations for Visual Recognition, 2014. [CrossRef]
16. Armato, S.G.; McLennan, G.; Bidaut, L.; McNitt-Gray, M.F.; Meyer, C.R.; Reeves, A.P.; Zhao, B.; Aberle, D.R.; Henschke, C.I.; Hoffman, E.A.; et al. The Lung Image Database Consortium (LIDC) and Image Database Resource Initiative (IDRI): A completed reference database of lung nodules on CT scans.Med. Phys.2011,38, 915–931. [CrossRef] [PubMed]
17. Li, L.; Liu, Z.; Huang, H.; Lin, M.; Luo, D.-H. Evaluating the performance of a deep learning-based computer-aided diagnosis (DL-CAD) system for detecting and characterizing lung nodules: Comparison with the performance of double reading by radiologists. Thorac. Cancer2019,10, 183–192. [CrossRef] [PubMed]
18. Setio, A.A.A.; Ciompi, F.; Litjens, G.; Gerke, P.; Jacobs, C.; Van Riel, S.J.; Wille, M.M.W.; Naqibullah, M.; Sanchez, C.I.; Van Ginneken, B. Pulmonary Nodule Detection in CT Images: False Positive Reduction Using Multi-View Convolutional Networks.IEEE Trans. Med Imaging2016,35, 1160–1169. [CrossRef] [PubMed] 19. Suzuki, K. A supervised ‘lesion-enhancement’ filter by use of a massive-training artificial neural network
(MTANN) in computer-aided diagnosis (CAD).Phys. Med. Biol.2009,54. [CrossRef]
20. Tajbakhsh, N.; Suzuki, K. Comparing two classes of end-to-end machine-learning models in lung nodule detection and classification: MTANNs vs. CNNs.Pattern Recognit.2017,63, 476–486. [CrossRef]
21. Masood, A.; Sheng, B.; Li, P.; Hou, X.-H.; Wei, X.-E.; Qin, J.; Feng, D.-G. Computer-Assisted Decision Support System in Pulmonary Cancer detection and stage classification on CT images.J. Biomed. Inform.2018,79, 117–128. [CrossRef]
22. Chen, S.-H.; Guo, J.-X.; Wang, C.-D.; Xu, X.-X.; Yi, Z.; Li, W.-M. DeepLNAnno: A Web-Based Lung Nodules Annotating System for CT Images.J. Med. Syst.2019,43. [CrossRef]
23. Liao, F.-Z.; Liang, M.; Li, Z.; Hu, X.-L.; Song, S. Evaluate the Malignancy of Pulmonary Nodules Using the 3-D Deep Leaky Noisy-or Network.IEEE Trans. Neural Netw. Learn. Syst.2019,30, 3484–3494. [CrossRef] 24. Liu, M.-Z.; Jiang, X.; Liu, Y.-H.; Zhao, F.-X.; Zhou, H.-L. A semi-supervised convolutional transfer neural
25. Wang, Y.; Yan, F.-R.; Lu, X.-F.; Zheng, G.-M.; Zhang, X.; Wang, C.; Zhou, K.-F.; Zhang, Y.-W.; Li, H.; Zhao, Q.; et al. IILS: Intelligent imaging layout system for automatic imaging report standardization and intra-interdisciplinary clinical workflow optimization.EBioMedicine2019,44, 162–181. [CrossRef] [PubMed] 26. Wang, J.; Wang, J.-W.; Wen, Y.-F.; Lu, H.-B.; Niu, T.-Y.; Pan, J.-F.; Qian, D.-H. Pulmonary Nodule Detection in Volumetric Chest CT Scans Using CNNs-Based Nodule-Size-Adaptive Detection and Classification. IEEE Access2019,7, 46033–46044. [CrossRef]
27. Alakwaa, W.; Nassef, M.; Badr, A. Lung Cancer Detection and Classification with 3D Convolutional Neural Network (3D-CNN).Int. J. Adv. Comput. Sci. Appl.2017,8. [CrossRef]
28. Ciompi, F.; de Hoop, B.; van Riel, S.J.; Chung, K.; Scholten, E.T.; Oudkerk, M.; de Jong, P.A.; Prokop, M.; van Ginneken, B. Automatic classification of pulmonary peri-fissural nodules in computed tomography using an ensemble of 2D views and a convolutional neural network out-of-the-box. Med. Image Anal. 2015,26, 195–202. [CrossRef] [PubMed]
29. Ciompi, F.; Chung, K.; Van Riel, S.J.; Setio, A.A.A.; Gerke, P.K.; Jacobs, C.; Th Scholten, E.; Schaefer-Prokop, C.; Wille, M.M.W.; Marchianò, A.; et al. Towards automatic pulmonary nodule management in lung cancer screening with deep learning.Sci. Rep.2017,7. [CrossRef]
30. Jakimovski, G.; Davcev, D. Using Double Convolution Neural Network for Lung Cancer Stage Detection. Appl. Sci.2019,9, 427. [CrossRef]
31. Lakshmanaprabu, S.K.; Mohanty, S.N.; Shankar, K.; Arunkumar, N.; Ramirez, G. Optimal deep learning model for classification of lung cancer on CT images. Future Gener. Comput. Syst. 2019, 92, 374–382. [CrossRef]
32. Liu, S.; Xie, Y.-T.; Jirapatnakul, A.; Reeves, A.P. Pulmonary nodule classification in lung cancer screening with three-dimensional convolutional neural networks.J. Med. Imaging2017,4, 1. [CrossRef]
33. Liu, X.-L.; Hou, F.; Qin, H.; Hao, A. Multi-view multi-scale CNNs for lung nodule type classification from CT images.Pattern Recognit.2018,77, 262–275. [CrossRef]
34. Nishio, M.; Sugiyama, O.; Yakami, M.; Ueno, S.; Kubo, T.; Kuroda, T.; Togashi, K. Computer-aided diagnosis of lung nodule classification between benign nodule, primary lung cancer, and metastatic lung cancer at different image size using deep convolutional neural network with transfer learning.PLoS ONE2018,13, e0200721. [CrossRef] [PubMed]
35. Onishi, Y.; Teramoto, A.; Tsujimoto, M.; Tsukamoto, T.; Saito, K.; Toyama, H.; Imaizumi, K.; Fujita, H. Automated Pulmonary Nodule Classification in Computed Tomography Images Using a Deep Convolutional Neural Network Trained by Generative Adversarial Networks. BioMed Res. Int. 2019,2019. [CrossRef] [PubMed]
36. Polat, H.; Mehr, H.D. Classification of pulmonary CT images by using hybrid 3D-deep convolutional neural network architecture.Appl. Sci. (Switz.)2019,9. [CrossRef]
37. Qiang, Y.; Ge, L.; Zhao, X.; Zhang, X.-L.; Tang, X.-X. Pulmonary nodule diagnosis using dual-modal supervised autoencoder based on extreme learning machine.Expert Syst.2017,34, e12224. [CrossRef] 38. Rangaswamy, C.; Raju, G.T.; Seshikala, G. SVM, RBFNN and CNN classifiers for detection and classification
of lung cancer from CT scans image.J. Int. Pharm. Res.2019,46, 230–236.
39. Sori, W.J.; Feng, J.; Liu, S. Multi-path convolutional neural network for lung cancer detection.Multidimens. Syst. Signal Process.2018, 30. [CrossRef]
40. Wang, S.; Wang, R.; Zhang, S.; Li, R.; Fu, Y.; Sun, X.; Li, Y.; Sun, X.; Jiang, X.; Guo, X.; et al. 3D convolutional neural network for differentiating pre-invasive lesions from invasive adenocarcinomas appearing as ground-glass nodules with diameters≤3 cm using HRCT.Quant. Imaging Med. Surg. 2018,8, 491–499. [CrossRef]
41. Yuan, J.-J.; Liu, X.-L.; Hou, F.; Qin, H.; Hao, A. Hybrid-feature-guided lung nodule type classification on CT images.Comput. Graph. (Pergamon)2018,70, 288–299. [CrossRef]
42. Zhang, C.; Sun, X.; Dang, K.; Li, K.; Guo, X.-W.; Chang, J.; Yu, Z.-Q.; Huang, F.-Y.; Wu, Y.-S.; Liang, Z.; et al. Toward an Expert Level of Lung Cancer Detection and Classification Using a Deep Convolutional Neural Network.Oncologist2019,24. [CrossRef]
43. Suzuki, K. Overview of deep learning in medical imaging.Radiol. Phys. Technol.2017,10, 257–273. [CrossRef] 44. Liu, G.-F.; Bao, H.-Q.; Han, B.-K. A Stacked Autoencoder-Based Deep Neural Network for Achieving Gearbox
Diagnostics2019,9, 207 14 of 14
45. Kaggle Data Science Bowl 2017. Available online:https://www.kaggle.com/c/data-science-bowl-2017/data (accessed on 15 November 2019).
46. ELCAP Public Lung Image Database. Available online:http://www.via.cornell.edu/databases/lungdb.html (accessed on 28 October 2019).
47. Ru Zhao, Y.; Xie, X.; de Koning, H.J.; Mali, W.P.; Vliegenthart, R.; Oudkerk, M. NELSON lung cancer screening study.Cancer Imaging2011,11, S79–S84. [CrossRef] [PubMed]
48. The Image and Data Archive of the University of South Carolina and Laboratory of Neuro Imaging. Available online:https://ida.loni.usc.edu/login.jsp(accessed on 28 October 2019).
49. Multimedia database of Interstitial Lung Diseases. Available online: http://medgift.hevs.ch/wordpress/ databases/ild-database/(accessed on 15 November 2017).
50. Pehrson, L.M.; Nielsen, M.B.; Ammitzbol Lauridsen, C. Automatic Pulmonary Nodule Detection Applying Deep Learning or Machine Learning Algorithms to the LIDC-IDRI Database: A Systematic Review.Diagnostics (Basel)2019,9. [CrossRef] [PubMed]
51. Tajbakhsh, N.; Suzuki, K. A Comparative Study of Modern Machine Learning Approaches for Focal Lesion Detection and Classification in Medical Images: BoVW, CNN and MTANN. InArtificial Intelligence in Decision Support Systems for Diagnosis in Medical Imaging; Springer: Cham, Switzerland, 2018; pp. 31–58. [CrossRef] 52. Suzuki, K.; Armato, S.G.; Li, F.; Sone, S.; Doi, K. Massive training artificial neural network (MTANN) for
reduction of false positives in computerized detection of lung nodules in low-dose computed tomography. Med. Phys.2003,30, 1602–1617. [CrossRef] [PubMed]
53. Cho, J.; Lee, K.; Shin, E.; Choy, G.; Do, S. How much data is needed to train a medical image deep learning system to achieve necessary high accuracy?arXiv2015, arXiv:1511.06348.
54. Yosinski, J.; Clune, J.; Bengio, Y.; Lipson, H. How transferable are features in deep neural networks? In Proceedings of the Neural Information Processing Systems 27 (NIPS 2014), Montreal, QC, Canada, 8–11 December 2014.
55. Schlegl, T.; Ofner, J.; Langs, G.Unsupervised Pre-training Across Image Domains Improves Lung Tissue Classification; Springer: Cham, Switzerland, 2014; pp. 82–93. [CrossRef]
56. Oquab, M.; Bottou, L.; Laptev, I.; Sivic, J. Learning and Transferring Mid-Level Image Representations using Convolutional Neural Networks. In Proceedings of the IEEE Conference on Computer Vision and Pattern Recognition (CVPR), Columbus, OH, USA, 24–27 June 2014.
57. Tajbakhsh, N.; Shin, J.Y.; Gurudu, S.R.; Hurst, R.T.; Kendall, C.B.; Gotway, M.B.; Liang, J. Convolutional Neural Networks for Medical Image Analysis: Full Training or Fine Tuning?IEEE Trans. Med. Imaging2016, 35, 1299–1312. [CrossRef]
58. Szegedy, C.; Liu, W.; Jia, Y.; Sermanet, P.; Reed, S.; Anguelov, D.; Erhan, D.; Vanhoucke, V.; Rabinovich, A. Going Deeper with Convolutions. In Proceedings of the IEEE Conference on Computer Vision and Pattern Recognition, Boston, MA, USA, 7–12 June 2015.
59. Taigman, Y.; Marc, M.Y.; Ranzato, A.; Wolf, L. DeepFace: Closing the Gap to Human-Level Performance in Face Verification. In Proceedings of the IEEE Conference on Computer Vision and Pattern Recognition (CVPR), Columbus, OH, USA, 24–27 June 2014.
60. Nuance+NVIDIA Advance AI for Radiology Nuance. Available online:https://www.nuance.com/about-us/ newsroom/press-releases/nuance-nvidia-advance-ai-radiology.html(accessed on 15 November 2019).