https://doi.org/10.5194/tc-13-3367-2019
© Author(s) 2019. This work is distributed under the Creative Commons Attribution 4.0 License.
Optimization of over-summer snow storage at midlatitudes
and low elevation
Hannah S. Weiss1, Paul R. Bierman1,2, Yves Dubief3, and Scott D. Hamshaw4
1Rubenstein School of Environment and Natural Resources, University of Vermont, Burlington, VT 05405, USA 2Geology Department, University of Vermont, Burlington, VT 05405, USA
3Department of Mechanical Engineering, University of Vermont, Burlington, VT 05405, USA
4Department of Civil & Environmental Engineering, University of Vermont, Burlington, VT 05405, USA Correspondence:Hannah S. Weiss ([email protected])
Received: 15 March 2019 – Discussion started: 11 April 2019
Revised: 17 October 2019 – Accepted: 29 October 2019 – Published: 17 December 2019
Abstract.Climate change, including warmer winter temper-atures, a shortened snowfall season, and more rain-on-snow events, threatens nordic skiing as a sport. In response, over-summer snow storage, attempted primarily using woodchips as a cover material, has been successfully employed as a climate change adaptation strategy by high-elevation and/or high-latitude ski centers in Europe and Canada. Such stor-age has never been attempted at a site that is both low eleva-tion and midlatitude, and few studies have quantified storage losses repeatedly through the summer. Such data, along with tests of different cover strategies, are prerequisites to opti-mizing snow storage strategies. Here, we assess the rate at which the volume of two woodchip-covered snow piles (each ∼200 m3), emplaced during spring 2018 in Craftsbury, Ver-mont (45◦N and 360 m a.s.l.), changed. We used these data to develop an optimized snow storage strategy. In 2019, we tested that strategy on a much larger, 9300 m3pile. In 2018, we continually logged air-to-snow temperature gradients un-der different cover layers including rigid foam, open-cell foam, and woodchips both with and without an underlying insulating blanket and an overlying reflective cover. We also measured ground temperatures to a meter depth adjacent to the snow piles and used a snow tube to measure snow den-sity. During both years, we monitored volume change over the melt season using terrestrial laser scanning every 10– 14 d from spring to fall. In 2018, snow volume loss ranged from 0.29 to 2.81 m3d−1, with the highest rates in midsum-mer and lowest rates in the fall; mean rates of volumetric change were 1.24 and 1.50 m3d−1, 0.55 % to 0.72 % of ini-tial pile volume per day. Snow density did increase over time,
but most volume loss was the result of melting. Wet wood-chips underlain by an insulating blanket and covered with a reflective sheet were the most effective cover combination for minimizing melt, likely because the aluminized surface reflected incoming short-wave radiation while the wet wood-chips provided significant thermal mass, allowing much of the energy absorbed during the day to be lost by long-wave emission at night. The importance of the pile surface-area-to-volume ratio is demonstrated by 4-fold lower rates of volu-metric change for the 9300 m3pile emplaced in 2019; it lost <0.16 % of its initial volume per day between April and Oc-tober, retaining∼60 % of the initial snow volume over sum-mer. Together, these data demonstrate the feasibility of over-summer snow storage at midlatitudes and low elevations and suggest efficient cover strategies.
1 Introduction
and McBoyle, 2007; Pickering and Buckley, 2010; Steiger et al., 2017). Over the past several decades, ski centers have improved snowmaking strategies and facility operations both to maintain financial stability and to decrease their output of greenhouse gases (Koenig and Abegg, 1997; Moen and Fred-man, 2007; Tervo, 2008; Kaján and Saarinen, 2013). Recent research focuses on analyzing and optimizing stages in the snow production cycle to assist industry efforts (Hanzer et al., 2014; Spandre et al., 2016; Grünewald and Wolfsperger, 2019).
Many sites organizing major winter sports events, such as cross-country or alpine world cup races, have adopted over-summer snow storage in response to the unpredictability of snowmaking weather conditions. In areas of high humidity and warm average fall temperatures, summer snow storage is more reliable than expecting weather conditions to be suffi-ciently cold and dry for making snow at the start of the winter ski season. For example, the 2014 Olympic Games at Sochi relied on 750 000 m3of stored snow (Pestereva, 2014).
Over-summer storage of snow and ice is not a new idea; for example, ice houses stored large blocks of lake ice be-neath sawdust over the summer (Nagnengast, 1999; Rees, 2013). Today, the ski industry uses stored snow to support the early winter ski season. Modern over-summer snow storage (sometimes referred to as “snow farming”) begins with the creation of snow piles during winter months. Piles are cov-ered (often with sawdust or woodchips and sometimes geo-textiles) before the snow is stored over the summer (Skogs-berg and Lund(Skogs-berg, 2005). In the fall, the pile is uncovered and snow spread onto trails. Nordic ski centers require less snow-covered area to open than downhill ski centers, and so snow storage on the scale of thousands of cubic meters is practical and cost-effective, allowing the center to open on time instead of losing business, which occurs if centers are unable to make snow and thus must open later. Snow storage has been employed predominately at high-elevation and/or high-latitude ski centers (Fig. 1), many of which benefit from cool, dry summers that minimize energy transfer to the snow, increase evaporative cooling, and thus slow snowmelt.
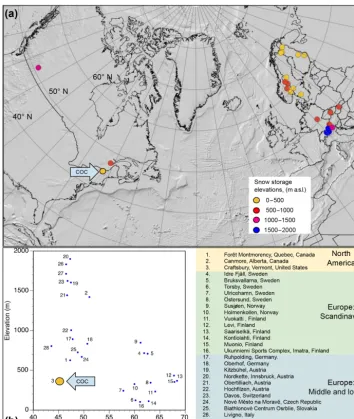
Here, we examine the feasibility of snow storage in the northern United States at a midlatitude, low-elevation (45◦N and 360 m a.s.l.) site with a humid, temperate climate, in-cluding warm summer temperatures and high relative hu-midity which limits evaporative cooling (Fig. 1). Out of the 28 known snow storage locations, our study location has the highest average June–July–August temperature (24◦C) and highest solar-radiation levels (Worldclim – Global Climate Data, http://worldclim.org/version2, last access: 14 Septem-ber 2019). In this paper, we report data on the rate of volu-metric change of snow stored over the summer and consider those data in the context of both ground temperature and me-teorological data that together help define the energy flux, which is responsible for melt into and out of the snow piles. The goals of this research are to (1) determine the rate of vol-umetric change of small experimental snow piles, (2) suggest
an optimized snow storage strategy based on those data, and (3) test the optimized strategy on a larger snow pile sufficient for ski area opening. Our data fill a research gap in measure-ments of volumetric change during snow storage and provide a novel case study for snow storage at low-elevation and mid-latitude sites.
2 Background
Although the physics of snowmelt has been considered ex-tensively (Dunne and Leopold, 1978; Horne and Kavaas, 1997; Jin et al., 1999), there has been limited application of physical and energy transfer knowledge to the prob-lem of over-summer snow storage (Grünewald et al., 2018). Snowmelt occurs when the snowpack absorbs enough energy to raise snow temperature to the melting point (0◦C) and then
absorbs additional energy to enable the phase change from solid to liquid water (0.334 MJ kg−1). The snowpack gains energy from incoming short- and long-wave radiation, sensi-ble and latent heat transfer from condensation of atmospheric water vapor and cooling and refreezing of rainwater, conduc-tion from the underlying ground, and advective heat transfer from wind (Dunne and Leopold, 1978). Loss of energy from the snowpack occurs through convective and conductive heat transfer to the air, evaporative cooling, and long-wave emis-sion to the atmosphere.
Both regional and local climatic factors influence the en-ergy balance of snow. Short-wave radiational gain is related to latitude (highest near the Equator and least near the poles), elevation, time of year (greatest in summer and least in win-ter), snow pile surface albedo, slope and aspect, and cloud and tree canopy cover. Long-wave radiation balance depends on atmospheric emissivity, cloudiness, vegetation cover, and temperature of the snow pile surface. Rain falling on the snowpack transfers heat. Conductive heat transfer from the ground depends on soil thermal conductivity and tempera-ture (Kane et al., 2000; Abu-Hamdeh, 2003). Snowmelt typ-ically varies on a diurnal cycle, with melt increasing after sunrise, peaking in the afternoon, and decreasing after sunset (Granger and Male, 1978). Once surface melt occurs, wa-ter either refreezes if it percolates into a sub-freezing snow-pack, flows through an isothermal (0◦C) snowpack and then infiltrates into the ground below, or flows along the ground surface below the pile, depending on the soil infiltration rate (Schneebeli, 1995; Ashcraft and Long, 2005).
vol-Figure 1.Locations of known over-summer snow storage sites (both currently active and inactive).(a)Conical projection shows known locations of over-summer snow storage at nordic ski centers. The Craftsbury Outdoor Center is highlighted with a blue arrow, which is labeled COC. The relative elevations of ski centers are displayed as a color gradient, marked in the legend.(b)Scatterplot of same locations as shown in(a). The Craftsbury Outdoor Center (no. 3) is large yellow dot (COC). It has the lowest combination of elevation and latitude of any snow storage yet attempted.
umes of the two piles. These snow piles retained 74 % and 63 % of their volume over the summer. Using a physically based model, Grünewald et al. (2018) suggested that the most effective cover, in relation to work and cost, was a 40 cm thick layer of mixed wet sawdust and woodchips, which reduced energy input into the pile by a factor of 12 (1504 MJ m−2without woodchips as opposed to 128 MJ m−2 with woodchips). Deeper cover layers can save more snow, but costs are higher. During the day, solar radiation caused evaporation from surface woodchips while capillary flow continually supplied moisture from the melting snow to the surface. The wet woodchips and sawdust also provided
ther-mal mass, slowing the transfer of energy from the surface to the snow beneath.
were a more effective cover than bark. They measured snow volumes three times over the summer and found that higher relative humidity increased the melt rate. They also investi-gated the geometry of snow piles and determined that shap-ing piles, in a way that maximized the ratio of volume to sur-face area, minimized melt loss; however, steeper snow pile sides caused sliding and failure of cover materials (Lintzén and Knutsson, 2018).
Data related to snow storage for the purpose of summer cooling to improve energy efficiency and comfort supple-ments those gathered from ski centers. In central Sweden, the Sundsvall Hospital conserves snow over the summer for air conditioning with a 140 m×60 m storage area (holding 60 000 m3 snow) underlain by watertight asphalt (Nordell and Skogsberg, 2000). After covering with 20 cm of wood-chips, the majority of natural snowmelt resulted from heat transfer from air (83 %), while heat transfer from groundwa-ter drove 13 % of melt and heat from rain accounted for 4 % of melt. Similar work was done by Kumar et al. (2016) and Morofsky (1982) in Canada and by Hamada et al. (2010) in Japan.
3 Methods and setting 3.1 Study location
We conducted our experiment at the Craftsbury Outdoor Center (COC), a sustainability-focused, full-year recreation venue located in northeastern Vermont at 360 m a.s.l. (Fig. 1), an area with warm, humid summers and cold, dry winters. The COC maintains 105 km of groomed nordic ski trails and hosts national and international races several times each win-ter. Average maximum monthly air temperature at St. Johns-bury, Vermont (closest National Oceanic and Atmospheric Administration – NOAA – station to the COC about 30 km southeast; at 215 m a.s.l.), between 1895 and 2018 ranges between 3.6◦C (January) and 29◦C (July), mean tempera-ture ranges from −8.3◦C (January) to 20.7◦C (July), and minimum air temperature ranges between−34◦C (Decem-ber) and 15◦C (July, Climate Summary for Saint Johnsbury, VT, https://www.fairbanksmuseum.org/eye-on-the-sky/ summaries-for-st-js-climate/normals-and-extremes,
last access: 6 February 2019). Soils in the area are very rocky, silty loam, sandy loam, and loam de-veloped on glacial till (Web Soil Survey, https: //websoilsurvey.nrcs.usda.gov/app/WebSoilSurvey.aspx, last access: 20 October 2018). Average summer precip-itation is ∼300 mm (NOAA, 2019). The most common land-cover types are forest and woodlands (USGS, https: //mrdata.usgs.gov/geology/state/fips-unit.php?code=f50019, last access: 15 October 2018).
3.2 Initial snow pile experiments
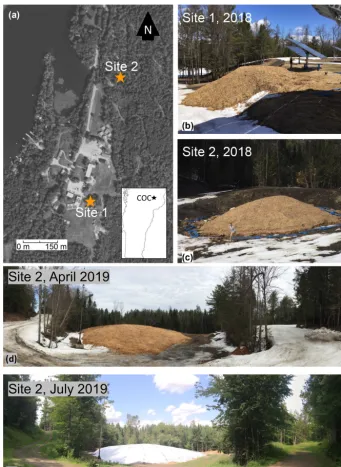
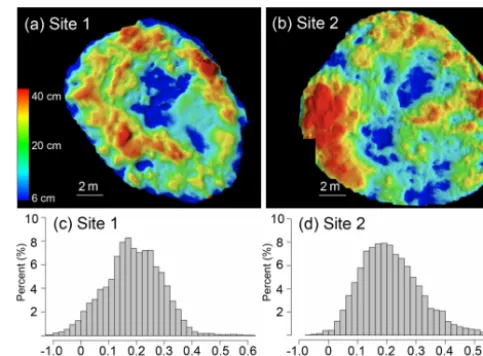
On 30 March 2018, two snow piles were emplaced at the COC using PistenBully snow groomers at two separate sites (Fig. 2). Site 1 is adjacent to the COC’s main campus build-ings in direct sunlight, with minimal wind protection. Site 2 is 1 km north of Site 1, within a cleared depression in the forest which also in direct sunlight but more protected from wind than Site 1. At the time of emplacement, the snow was transformed and had a density of>500 kg m−3(see Sect. 3.5 for snow density measurement methods). At Site 1, 225 m3 of machine-made snow was banked against a north-facing slope. At Site 2, 210 m3of natural snow was shaped into a symmetrical, rounded pile. The two piles were draped with thin sheets of clear plastic. The plastic sheets, about 0.15 mm thick, were impermeable and emplaced to prevent woodchips from mixing with the snow. The piles were then covered with an irregular layer of woodchips averaging 20±10 cm (1 SD) on 21 April 2018; chip thickness ranged from a minimum of 6 cm to a maximum of 40 cm (Fig. 3). In early July, about 50 m3of snow were removed from the pile at Site 1 by COC personnel, the plastic was removed, and the remaining snow was covered again with woodchips and left for continued monitoring.
3.3 Weather stations
Weather stations adjacent to each pile and 3–4 m above the ground surface (Davis Vantage Pro2) collected air temperature, humidity, precipitation, solar-radiation, wind speed and direction, and barometric-pressure data. The weather stations record data at 15 min intervals and trans-fer them to the Web, where they are publicly acces-sible (https://wunderground.com/personal-weather-station/ dashboard?ID=KVTCRAFT2#history, last access: 23 Octo-ber 2019). Local soil temperature was measured with temper-ature sensors installed at four depths within the soil (5, 20, 50, and 100 or 105 cm below the surface) adjacent to each snow pile. Two HOBO Onset data loggers recorded temper-atures at four depths at 20 min intervals between June 2017 and October 2018.
3.4 Terrestrial-laser-scanning field methods and processing
topog-Figure 2.Snow storage at Craftsbury Outdoor Center.(a)Aerial view of the Craftsbury Outdoor Center (COC) in Vermont, from http: //maps.vcgi.vermont.gov (8 February 2019). Both study site locations shown by number.(b) Site 1 (225 m3), covered in woodchips on 21 April 2018, with trees and solar panels for scale.(c)Site 2 (209 m3) when installed. Site 1 received 24 m3of woodchips, and Site 2 received 42 m3of woodchips. Person for scale.(d)Site 2 in April 2019; 9300 m3of snow, eventually covered with 650 m3of woodchips.
(e)Site 2 in July 2019, the snow pile overlain by a reflective geofabric. Trees for scale.
raphy. Tie-point locations were determined and fixed rela-tive to the scanner GPS position during the initial scan. Each survey consisted of three or four scans per site (depending on available vantage points), which were combined in the RiSCAN Pro software version 2.6.2 (RIEGL Laser Measure-ment Systems GmbH: RiScan Pro, 2011). Scan registration was done in RiSCAN using a combination of tie-point reg-istration (finding corresponding points) and the multi-station
To calculate snow pile volumes and volumetric change over time (between scans), point clouds of each pile were processed into DSMs. Processing the workflow involved cropping the point cloud to the area of interest in RiSCAN Pro and exporting cropped point clouds into LAS format, projected into Vermont State Plane NAD83 coordinates. Point clouds were converted to a 10 cm resolution DSM using the min-Z filter and QT Modeler software (version 8.0.7.2) and adaptive triangulation to fill in small data gaps. Volume calculations and differences in volume between se-quential surveys were calculated in QT Modeler using these DSMs.
3.5 Density
Snow density was measured using a Rickly Federal Snow Sampling Tube. The snow tube was weighed, pushed into the snow, removed, and weighed again. The weight of the tube was subtracted from the combined weight of the snow and tube, and density was calculated by dividing the mass of snow by its volume (length of snow within the tube mul-tiplied by the area of the opening; ∼13 cm2). Density was collected three times (in March, May, and July) at the top surface of pile 1 during 2018. In 2019, density was collected once at the top of the pile in February.
3.6 Cover experiments
Cover experiments were performed at both sites in June and July 2018. At Site 1, two 5 cm thick, impermeable, rigid foam boards (R=3.9 per 2.5 cm; value expressing resistance to conductive heat flow) were stacked and compared to a 20 cm, uniform, porous layer of woodchips both with and without a reflective cover (aluminized space blanket). At Site 2, we covered snow with a double-layered, 2.5 cm thick insulating concrete curing blanket (R=3.3 per 2.5 cm) and overlaid the blanket with either open-cell, permeable foam (R=3.5 per 2.5 cm) or a uniform, porous layer of woodchips (20 cm thickness), both with a reflective cover. For both foam exper-iments, woodchips and plastic sheeting were removed from the test area. For woodchip experiments, plastic sheeting was removed from the test area. Individual cover experiments were conducted in areas of 1 m2 each, with thermosensors placed in the center of each quadrat at varying depths be-tween layers (Table 2; Fig. 4).
3.7 Power spectral density function
We computed the power spectral density (PSD) function to determine relative effectiveness of the different covers. The temperature signal is first decomposed in a series of waves of well-defined frequencies:
T (t )= 1 N
XN−1
k=0 ˆ
Tkexp(i2π fkt ) , (1)
Figure 3.Woodchip thickness distribution maps of pile 1(a)and pile 2(b), with red indicating areas of high thickness and blue indi-cating areas of low thickness. Panel(c)represents the chip thickness histogram for pile 1, and(d)is chip thickness histogram for pile 2. Negative thickness values likely represent snow settling between bare-snow survey and survey after woodchip emplacement.
where Tkˆ is the Fourier mode at frequency fk=k/21T, 1/1T is the sampling frequency of temperature acquisition, and N is the number of samples in the time series. The Fourier mode contains both amplitude and phase information for each wave. The PSD is the power of the signal,
PSD(T )=1t N
XN−1
k=0 ˆ Tk
2
, (2)
which is the sum of the contributions of each wave to the power (or variance) of the signal. Typically plotted on a log– log plot, the norm of the Fourier modes as a function of fre-quencies is a powerful tool for detecting dominant frequen-cies (Welch, 1967). In the summer, the dominant oscillation in temperature is diurnal; thus, using PSD, we can judge the effectiveness of cover materials by their ability to damp the diurnal temperature signal and relevant harmonics. We com-puted the PSD for all temperature records in selected cover experiments (Fig. 4b, e, f).
3.8 Validating cover method, summer 2019
fur-Table 1.Weather parameters measured between June 2017 and October 2018 at the Craftsbury Outdoor Center, Craftsbury, VT.
Air temperature Relative humidity Precipitation Solar radiation (◦C) (%) (mm d−1) (W m−2)
Minimum −28 14 0 0
Maximum 33 93 22 1144
Mean 9 79 0.1 109
Standard deviation 12 15 0.4 205
Table 2.Properties of the 2018 covering experiments.
Plot reference Site Snow-interface Middle layer Top layer Fig. 4 number∗ layer
(a) 1 None 20 cm layer of woodchips None
(b) 1 None 20 cm layer of woodchips Reflective covering (c) 1 None Two stacked rigid foam boards None
(d) 1 None Two stacked rigid foam boards Reflective covering (e) 2 Concrete curing blanket 20 cm layer of woodchips Reflective covering (f) 2 Concrete curing blanket 20 cm layer of open-cell foam Reflective covering
∗The experiment at Site 1 occurred in June 2018, while the experiment at Site 2 occurred in July 2018.
ther compacted with PistenBully groomers and excavators; at that time, TLS showed that the pile had a volume of about 9300 m3 without woodchips. During the next 6 weeks, the snow pile was allowed to compact and grow denser. In late April, most of the pile was covered in woodchips. By the end of May, additional woodchips were obtained and snow pile covering was completed (total woodchip volume∼650 m3). Using the exposed surface area of the pile without wood-chips (2300 m2) and the volume of woodchips, we calculate that the average woodchip thickness was 28 cm. By the end of June, the snow pile was covered in a white, 75 % reflec-tive, breathable Beltech 2911 geofabric, secured by ropes and rocks to prevent wind disruption. Between March and Octo-ber, the pile was repeatedly scanned using TLS; data were processed using methods described in Sect. 3.4.
4 Results
4.1 Meteorological data and ground temperature data Climate at the COC is strongly seasonal – such seasonality is clear in the meteorological data collected between June 2017 and October 2018 (Fig. 5). Between June 2017 and October 2018, air temperature varied between −28.2 and 33◦C
(mean annual temperature of 9◦C). Precipitation fell at a maximum rate of 22 mm d−1 (mean of 0.01 mm d−1), and relative humidity ranged between 14 % and 93 % (mean of 79±15 %). Solar radiation had a 24 h average of 109 W m−2 and maximum of 1144 W m−2(Table 1). Air temperature and solar radiation followed similar trends over the 16 months, decreasing during winter months and increasing during
summer months. Precipitation did not follow any significant pattern, and relative humidity remained high (NOAA clas-sifies above 65 % as high, and relative humidity remained above this level for the summer), varying more during sum-mer than winter months. Average sumsum-mer temperature in 2018 (June, July, and August 2018; 22.4◦C) was ranked by
NOAA as “Much above the average of 20.7◦C”; in 2019,
av-erage summer temperature ranked “above avav-erage” (21◦C). Both years had near-average precipitation (National Oceanic and Atmospheric Administration Forecast Office, Burling-ton VT, 2018; Craftsbury Outdoor Center KVTCRAFT2, https://www.wunderground.com/personal-weather-station/ dashboard?ID=KVTCRAFT2#history, last access: 12 December 2018).
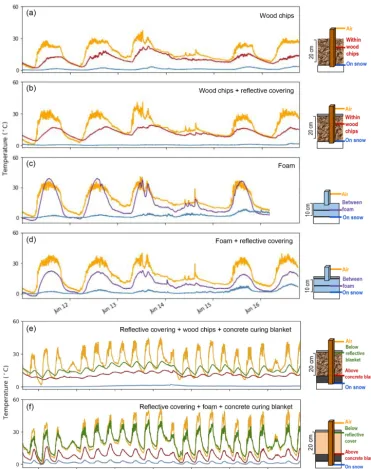
Figure 4.Cover experiments and resulting temperature records.(a)Site 1 – woodchips.(b)Site 1 – woodchips overlain by reflective cover.
(c)Site 1 – foam.(d)Site 1 – foam overlain by reflective cover.(e)Site 2 – woodchips underlain by concrete curing blanket and overlain by reflective cover.(f)Site 2 – open-cell foam underlain by concrete curing blanket and overlain by reflective cover.
but are missing from Site 2 between 12 December 2017 and 21 April 2018.
4.2 Snow volume and density
Snow in both 2018 piles lasted until mid-September; how-ever, snow volume decreased consistently throughout the summer (Figs. 6 and 7). Comparing the laser-scan survey completed just after woodchip emplacement with the ini-tial bare snow survey showed that the layer of chips ranged
Figure 5.Meteorological conditions and soil temperature between 11 June 2017 and 16 October 2018. Weather conditions were collected by a Davis weather station at the Craftsbury Outdoor Center near Site 2.(a)Air temperature (grey), collected at 30 min intervals plotted with ground temperatures. Ground temperatures were collected at 20 min intervals adjacent to Site 1 by four HOBO Onset data loggers at depths below the ground surface of 5 cm (blue), 10 cm (orange), 50 cm (green), and 105 cm (red). Ground temperature record ends on 2 September 2018.(b)Relative humidity (%).(c)Precipitation (mm d−1).(d)Solar radiation (W m−2).
changes in snow crystal morphology over the summer (in-creased rounding), increasing size (up to 5 mm by July), wet-ness (higher liquid water content), and clarity (from white to clear by summer’s end). Continued volume loss over the summer was predominately the result of melt. Average rates of volume change for both piles were relatively similar (1.24 and 1.50 m3d−1), representing 0.55 % to 0.72 % of initial pile volume per day. Maximum loss rates, recorded in July, reached 1.98 and 2.81 m3d−1 (Fig. 7.) As summer shifted
into fall, the loss rate decreased (Fig. 7). Minimum rates of change for both piles occurred in September and were 0.29 and 0.88 m3d−1.
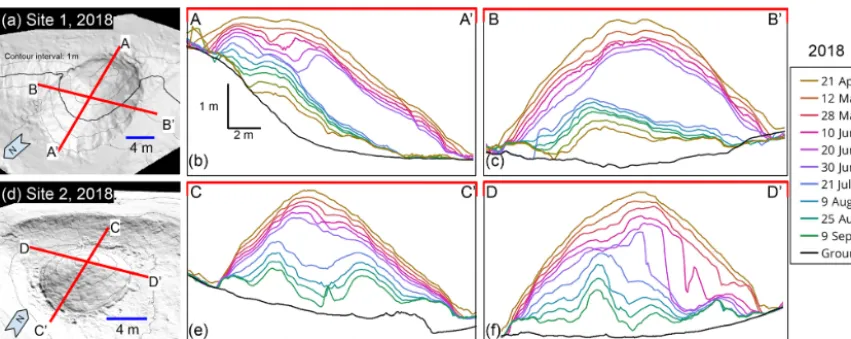
Figure 6.Snow pile topographic change over time in 2018.(a)Oblique view of digital surface model (1 m contours) of 2018 snow pile at Site 1 with cross sectionsA–A0andB–B0(21 April 2018).(b)Profiles for each terrestrial-laser-scan survey (21 April to 9 September 2018;
n=13) along sectionA–A0. (c)Profiles for each survey along sectionB–B0. On 3 July 2018, 50 m3 of snow was removed from the pile at Site 1.(d)Oblique view of digital surface model (1 m contours) of 2018 snow pile at Site 2 with cross sectionsC–C0andD–D0
(21 April 2018).(e)Profiles for each terrestrial-laser-scan survey (21 April to 9 September 2018;n=12) along sectionC–C0.(f)Profiles for each survey along sectionD–D0. Each scan represented by a line in panels(b),(c),(e), and(f)as indicated in key.
formation of crevices. We did not observe meltwater around either of the piles, suggesting that melt occurred at a rate which allowed for infiltration into the rocky sandy loam soil below. The woodchips deeper in the cover remained cold and wet throughout the summer, while the woodchips on the sur-face were consistently dry in the absence of rainfall. 4.3 Cover experiments
Thermal buffering is a function of air temperature, long-wave emissions, and turbulent fluxes. We chose temperature at the snow–cover interface to indicate cover efficiency be-cause all experiments were subjected to similar external con-ditions and because we have continuous data series of tem-perature in, above, and below the cover during each of the experiments. Two experiments preformed on 1 m2 plots on each snow pile revealed that different combinations of cover materials resulted in a variety of cover efficiencies (Fig. 4). Each experiment lasted between about 1 and 3 weeks and took place in June and July, respectively. We assessed cover efficiency by determining which material combination main-tained the lowest and steadiest temperature at the snow–cover interface and which most effectively damped the diurnal tem-perature signal (detected using PSD analysis). On the rigid foam, open-celled foam, and woodchip plots, the highest temperature was measured in the air above the surface (max of 51◦C; Fig. 4f). During the first experiment, air tempera-tures above the reflective blanket were higher than above the non-reflective surface. When all plots were covered with a re-flective blanket, all air temperatures above the pile were sim-ilar; however, temperatures at lower depths, and under differ-ent cover materials (woodchips and open-cell foam), varied significantly. The lowest and most stable temperatures at the
snow–cover interface resulted when the stored snow was cov-ered directly with an insulating concrete curing blanket, then with 20 cm of wet woodchips, and finally with a reflective sheet.
4.4 Power spectral density
PSD analysis provides insight into the dynamics of heat transfer in the snow piles. Figure 8 shows the log–log plot of temperature power spectral densities for three different cover experiments. It is important to realize that (i) each line represents the PSD at specific distance from the snow surface, (ii) that the integral under each line is equal to the standard deviation of the signal, or the energy of the signal fluctuations, and (iii) that the horizontal axis is frequency, thereby breaking down the total energy of the temperature signals into the individual contributions of each frequency involved in the PSD. Furthermore, the frequency is normal-ized by the frequency of 1 d or diurnal frequencyfdiurnal= 1/ (24×3600). Consequently, the horizontal coordinates 1, 2, and 4 are the diurnal (1 per 24 h), half-diurnal (1 per 12 h), and quarter-diurnal (1 per 6 h) frequencies, with 2 and 4 be-ing harmonics of the diurnal frequency. These frequencies are highlighted by the peaks in the PSD of temperature out-side of the pile (the airT sensor at 46 cm). The PSD values at these frequencies are much higher than the values at sur-rounding frequencies, indicating that their contribution to the total energy of the signal, and therefore to the dynamics of heat transfer, is significant.
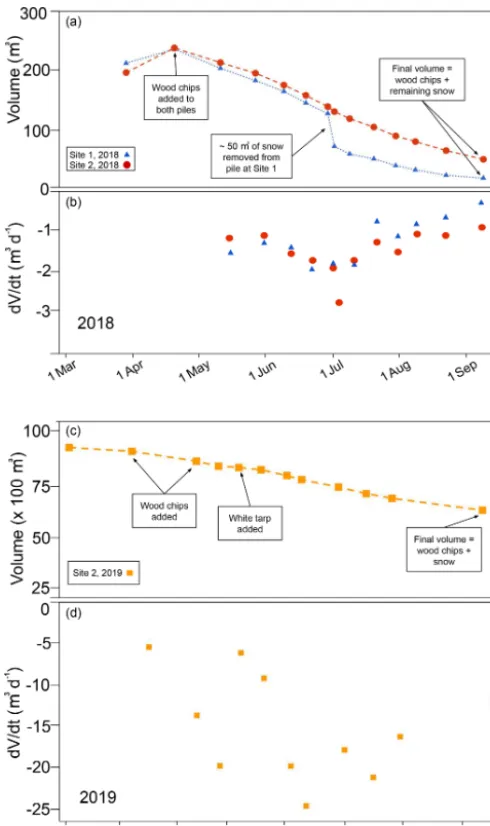
trans-Figure 7.Volume change over time for snow piles at sites 1 and 2 measured by terrestrial laser scanning.(a)Volume of snow piles from placement in March 2018 until September 2018. Addition of woodchips in April and removal of snow in July at pile 1 shown by black arrows. Volumes are total, including woodchips.(b)Change in volume per unit time between surveys. The rate of volume loss increases midsummer for both piles. Site 1 received about 24 m3 of woodchips, while Site 2 received about 42 m3of woodchips – this difference is due to pile geometry and the resulting difference in surface area. Site 1 snow was banked against the side of a hill, while the Site 2 pile was a hemisphere in the middle of an open de-pression.(c)Volumes of snow pile (2019) beginning in March and ending in October. Addition of woodchips throughout May and ad-dition of white tarp are indicated by black arrows. Volumes include woodchip volume.(d)Change in volume per unit time between sur-veys.
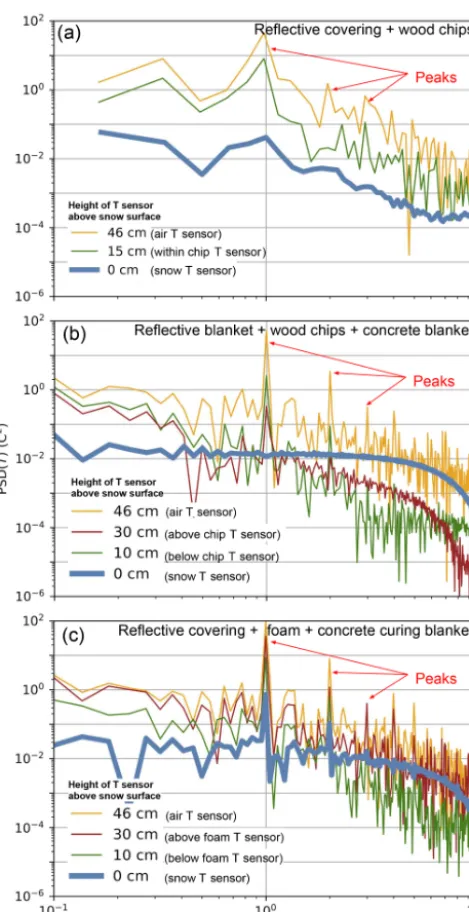
fer. In the foam cover experiment (Fig. 8c), the diurnal fre-quency and its harmonics are detectable in all layers; how-ever, the three-layer system (insulating blanket, wet wood-chips, and reflective cover; Fig. 8b) fully damps all oscilla-tions, as shown by the flatness of the PSD below the cover (0 cm; snowT sensor; thick blue line). In the absence of an insulating blanket, the two-material cover system (reflective cover and woodchips) is slightly less efficient at damping the diurnal oscillation (Fig. 8a). In the case of foam, the dynam-ics of heat transfer at the surface, or cyclic events that drive fluctuations of temperature, are directly and efficiently trans-mitted to the snow surface. Such a response can be modeled as quasi-steady heat transfer conduction, which is not sur-prising for an inorganic dry material.
Woodchips profoundly affect the dynamics of heat trans-fer, and in the most dramatic case (Fig. 8b), the snow sur-face temperature appears to be insensitive to the diurnal and harmonic frequencies of atmospheric temperature. This in-dicates that the system can no longer be modeled under quasi-steady-state conduction but requires at least the time-and depth-dependent heat transfer equations with a damp-ing mechanism. The dampdamp-ing might be storage and release of heat through convection and/or the phase change of wa-ter from liquid to vapor and back within the woodchip layer. Overall, relative cover material effectiveness can be ranked in Fig. 8 as most efficient (Fig. 8b), efficient (Fig. 8a), and least efficient (Fig. 8c).
4.5 Summer 2019
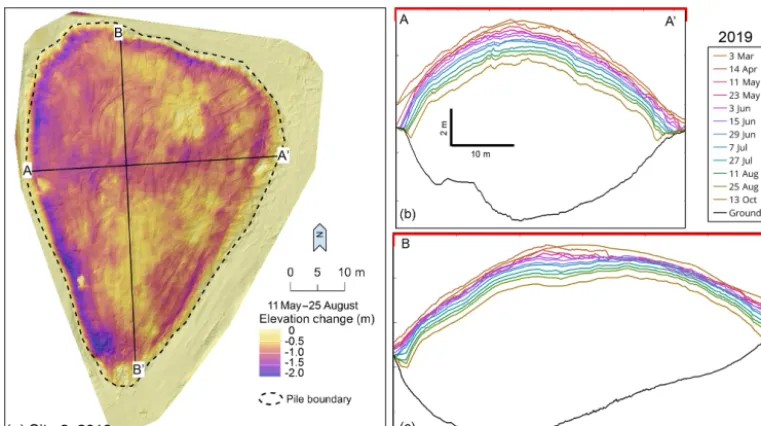
The 9300 m3snow pile emplaced in 2019 lost volume at an average rate of 15 m3d−1 (min of 5 m3d−1 in early April and max of 25 m3d−1in early July). Between the initial TLS survey in March and the last survey in October, the pile lost 3700 m3of snow, a 40 % volume loss (not including wood-chips). The average percentage loss per day was 0.16 % of the initial volume. In comparison to the 2018 snow piles, the pile lost volume more uniformly; no crevices formed and no slumping occurred (Fig. 9), although the surface did become rougher by October, and we noted more surface lowering near dark-colored rocks and logs emplaced to hold down the white, reflective covering. Volume loss between 11 May and 25 August (the most intensive melt season) was similar in all four quadrants of the pile, each of which experienced an av-erage of 0.9 m lowering. More lowering occurred on the pile boundaries, specifically along the western margin, as shown clearly by the blue and purple colors in Fig. 9a.
5 Discussion
Figure 8.Power spectral density of temperature records from three different cover experiments (Fig. 4b, e, and f). PSD normalizes fre-quency to 24 h=100and displays the magnitude of each tempera-ture oscillation frequency for each sensor per experiment (depth in centimeters measured above sensor at the snow – 0 cm).(a) Experi-ment with woodchips and reflective cover (Fig. 4b).(b)Experiment with a concrete curing blanket, woodchips, and a reflective cover (Fig. 4e). (c)Experiment with concrete curing blanket, open-cell foam, and a reflective cover (Fig. 4f). The lack of detectable signal (flat blue line) at snow level (0 cm) in(b)demonstrates that three-layer configuration with woodchips best damps the diurnal temper-ature signal. Colors correspond to colors from Fig. 4.
data, and (3) test this optimized snow storage strategy at scale.
5.1 Experimental snow pile melt rate
The survival of small (200 m3) snow piles through the warmer-than-average summer of 2018 and the results of both repeated TLS surveys and continuous in situ thermal data collected during a variety of different snow cover experi-ments suggest ways of optimizing over-summer snow stor-age at low elevations and midlatitudes. The 2018 snow piles experienced nonuniform cover and nonideal geometry and developed crevices that exposed snow to direct sunlight, all of which increased the rate of snowmelt and thus volume loss. Field observations and TLS surveys demonstrated that the thickness of woodchips covering the snow was not uni-form and became less uniuni-form over time as melt changed the pile shape (Fig. 3). Woodchip depth changed over the sum-mer as crevices, which grew over time, exposed bare snow to direct sunlight, which led to rapid and nonuniform pile melt-ing (Fig. 6). Crevices formed along boundaries of the large plastic sheets, which were emplaced to prevent woodchips from mixing with the snow. Openings in the woodchip cover also resulted from snow slumping within the pile – both piles had steep sides, and the DSMs revealed snow moving downs-lope (Fig. 6). Lintzén and Knutsson (2018) reference similar snow pile and cover failure due to steep pile-side geometry.
Snow pile size impacts the rate of volumetric change sig-nificantly. The two test piles were small, only a few per-cent of the volume of snow typically stored over summer by Nordic ski areas. For example, in Davos, Switzerland, and Martell, Italy, test piles were about 6000 and 6300 m3 (Grünewald et al., 2018). The Nordkette nordic ski operation in Innsbruck, Austria, stores∼13 000 m3of snow, and Öster-sund, Sweden, stores 20 000 to 50 000 m3piles. Small piles have a larger surface-area-to-volume ratio (SA/ V), which allows more effective heat transfer through radiation, con-duction, and latent heat transfer. A simple comparison of two hemispheres, one containing 200 m3of snow and the other containing 9000 m3of snow, indicates that SA/ V changes from 0.66 to 0.23 between the smaller and larger pile. As larger piles have a SA/ V ratio that is 3 times lower in com-parison to smaller piles, there is comparatively less snow near the surface thermal boundary, which decreases heat transfer per unit snow volume and thus the melt rate as a percentage of pile volume.
5.2 Optimal approach for over-summer snow
preservation at midlatitude and low-elevation sites
Figure 9.Volume change of 2019 snow pile.(a)Spatial variability of elevation change 2019 snow pile between 11 May and 25 August 2019. Cross sectionsA–A0andB–B0are marked in black.(b)Profile for each terrestrial-laser-scan survey (3 March to 13 October 2019;n=12).
(c)Profile for each terrestrial-laser-scan survey (2 March to 13 October 2019;n=12). Each scan represented by a colored line in panels(b)
and(c).
Our results are encouraging given the relative warmth of the 2018 summer season, the simple and spatially inconsistent nature of our cover material (20±10 cm of woodchips), and the small size of the test piles (∼200 m3). Previous snow storage studies found success with woody covers as well but in different geographic settings. Grünewald et al. (2018) suggested that a 40 cm layer of sawdust sufficiently opti-mized snow retention in Davos, Switzerland, and Martell, Italy. Skogsberg and Nordell (2001) reported that woodchips reduced snowmelt by 20 %–30 % at the Sundsvall Hospi-tal in Sweden. Lintzén and Knutsson (2018) built snowmelt models and ran field tests in northern Scandinavia, revealing that thick layers of woody materials successfully minimized snowmelt. In practice, financial constraints often control the choice of cover strategies. For example, the thicker the layer of woodchips, the better protected the pile will be and the less over-summer melt will occur. However, using more chips in-creases cost (Grünewald et al., 2018).
The experimental data (Fig. 4) show that the magnitude of daily temperature oscillations at the snow surface below the covering (blue line in all panels) is highly dependent upon the cover strategy. For example, in Fig. 4c, the temperature within the rigid foam board increases above air temperature (purple line increasing above the yellow line). Due to the rigidity of the foam boards and the nonuniform melting of the pile, the foam shifted and exposed snow to direct solar radiation, allowing warm air to move between the snow and the foam. Such failure of the cover system allowed tempera-tures at the snow interface to rise significantly above 0◦C. The three-layer cover (insulating blanket, wet woodchips,
and reflective cover) minimizes heat transfer into the stored snow, as evidenced by the lack of diurnal temperature oscil-lations at the snow surface during this and only this experi-ment (Fig. 4e). The comparison between foam and saturated woodchips PSDs (Fig. 8) shows the dramatic effect on the heat transfer from the atmosphere to the snow caused by the high heat capacity and thus thermal inertia of wet woodchips. The damping of diurnal temperature peaks by the three-layer cover system suggests that it will be the most effective for preserving snow over the summer.
cover material in damping daily temperature fluctuations at the snow surface.
5.3 Summer 2019, testing the optimized snow storage strategy at scale
Field data, TLS, and thermal observations from the 2018 ex-periments allowed for a full-scale test of our optimized snow storage strategy in 2019. Optimization began by further ex-cavating the storage area so that the resulting pile would sit within a pit and have gently sloping sides to reduce the chance of mass movements and crevassing on the pile mar-gins. Snowmaking was tuned so that the density of the snow emplaced was already high; this minimized settling after cov-ering. The snow was then compacted by repeated passes of large excavators and PistenBully groomers. Letting the snow settle and transform before covering also reduced the chance of mass movements which, in 2018, compromised pile and cover integrity. Results from the 2018 cover material ex-periments (most effective was a reflective cover, woodchips, and a concrete curing blanket) informed the 2019 covering method (Fig. 8). Rather than use metallized cover material, which was expensive, fragile, and impermeable, we used a high-albedo (0.75), white, permeable geofabric that allowed rain to infiltrate, thus mitigating regulatory concerns related to a large impermeable area. Concrete curing blankets were not used in 2019 due to cost and logistical complications of emplacement.
The 2019 pile, using an optimized strategy, confirmed the viability of snow storage at the COC. The most rapid vol-ume losses in 2019 were in the midsummer; while they were higher in absolute terms than those in 2018 because the pile was 45 times larger, they were more than 3 times lower in percentage terms. Most melt was focused along the western boundary, perhaps because the snow here was thin or not as thickly covered by woodchips or because western sun ex-posure occurs late in the day when the air temperatures are warmer; there is likely less net radiative cooling along the western side of the pile, as there is a steep, forested slope im-mediately adjacent to the snow storage area. Compared with the average percentage loss per day of the 2018 piles (0.64 % per day), the 2019 snow pile average percentage loss per day was 0.16 %. We suspect that the difference in volume loss re-flects primarily the surface-area-to-volume ratio of the 2019 snow pile, which is about 3 times less than the small piles tested in 2018. A 3-fold change in the SA/ V ratio compared with a 4-fold reduction in the percentage volumetric change rate suggests the impact of an improved cover strategy. The complete covering of the 2019 pile with a reflective geofabric likely slowed melt by rejecting short-wave radiation as well as protecting the snow even if the woodchips shifted. TLS imagery from 2019 demonstrates that gentle side slopes of the pile prevented any large mass movements of snow, indi-cating that pile shape and snow pre-consolidation are impor-tant (Fig. 9).
TLS data show that from April until mid-October, about 60 % by volume of the snow initially placed in the April 2019 pile remained. Considering the snow density data gathered from the 2018 piles, which increased from 500 to 700 kg m−3 over the summer, some of this volume loss could be ac-counted for by compaction rather than melting. This sugges-tion is supported by the lack of surface water draining from the 2019 pile, which is underlain by relatively impermeable rock and clay-rich glacial till. With fall temperatures and the sun angle dropping, incident solar radiation as well as con-vective and conductive heat transfer are diminished greatly from midsummer values. This means that the COC will have >5000 m3of snow to spread in November for early-season skiing. Covering 5 m wide trails 50 cm deep will allow at least 2 km of skiing at opening and will provide a base so that any natural snow that does fall will be retained.
6 Conclusions
Data presented here show that snow storage at midlatitudes and low elevations is a practical climate change adaptation that can extend the nordic ski season and the sport’s viabil-ity as the climate continues to warm. Using 14 terrestrial-laser-scan surveys between March and September 2018, we determined rates of volumetric change of two 200 m3snow piles covered in woodchips. Average volume loss rates were 1.24 and 1.50 m3d−1, with the highest rates of volumetric change in July and the lowest rates of volumetric change in September. A three-layer cover approach was most effective: a concrete curing blanket, a 20 cm layer of woodchips, and a reflective covering. This cover approach reduces solar gain and buffers the effect of>30◦C summer daytime
Data availability. Data are available at https://doi.org/10.1594/PANGAEA.899744 (Weiss and Bier-man, 2018).
Author contributions. PB and YD co-conceptualized the experi-ment. HW and YD curated the data. HW, YD, and SH conducted the TLS and PSD analysis. HW and PB acquired funding, developed the methodology (assisted by SH), conducted the investigation, and validated data. HW, PB, and YD prepared data visualizations. HW and PB wrote the original paper draft. All authors contributed to the review and editing process.
Competing interests. The authors declare that they have no conflict of interest.
Acknowledgements. We thank Judy Geer and Dick Dreissigacker, directors of the Craftsbury Outdoor Center, for enthusiastically supporting this project. We also thank our editor, Jürg Schweizer, and reviewers, Thomas Grünewald, Nina Lintzen, and one anony-mous reviewer, for providing constructive criticism to strengthen this manuscript. Field work was generously assisted by Landon Williams and Amelia Murtha. We acknowledge that the land the research was preformed upon was once the land of the Abenaki peo-ple.
Financial support. This research has been financially supported by the University of Vermont’s Department of Geology, Department of Mechanical Engineering, Rubenstein School of Environment and Natural Resources, the Office of Undergraduate Research, and the Graduate College. Additional support was provided by the National Science Foundation under CMMI-1229045.
Review statement. This paper was edited by Jürg Schweizer and re-viewed by Thomas Grünewald, Nina Lintzen, and one anonymous referee.
References
Abu-Hamdeh, N. H.: Thermal properties of soils as affected by density and water content, Biosyst. Eng., 86, 97–102, https://doi.org/10.1016/S1537-5110(03)00112-0, 2003. Ashcraft, I. S. and Long, D. G.: Differentiation between
melt and freeze stages of the melt cycle using SSM/I channel ratios, IEEE T. Geosci. Remote, 43, 1317–1323, https://doi.org/10.1109/TGRS.2005.845642, 2005.
Climate Central: More Rain, Less Snow for US Win-ters, available at: https://www.climatecentral.org/news/ winters-becoming-more-rainy-across-us-20017 (last access: 10 August 2019), 2016.
Dunne, T. and Leopold, L.: Snow Hydrology, in: Water in environ-mental planning, WH Freeman and Company, New York, 465– 483, 1978.
Granger, R. J. and Male, D. H.: Melting of a prairie snowpack, J. Appl. Meteorol. Clim., 17, 1833–1842, https://doi.org/10.1175/1520-0450(1978)017<1833:Moaps>2.0.Co;2, 1978.
Grünewald, T. and Wolfsperger, F.: Water losses during technical snow production: results from field experiments, Front. Earth Sci., 7, 1–13, https://doi.org/10.3389/feart.2019.00078, 2019. Grünewald, T., Wolfsperger, F., and Lehning, M.: Snow farming:
conserving snow over the summer season, The Cryosphere, 12, 385–400, https://doi.org/10.5194/tc-12-385-2018, 2018. Hamada, Y., Kubota, H., Nakamura, M., Kudo, K., and
Hashimoto, Y.: Experiments and evaluation of a mobile high-density snow storage system, Energ. Buildings, 42, 178–182, https://doi.org/10.1016/j.enbuild.2009.08.012, 2010.
Hanzer, F., Marke, T., and Strasser, U.: Distributed, explicit model-ing of technical snow production for a ski area in the Schladmmodel-ing region (Austrian Alps), Cold Reg. Sci. Technol., 108, 113–124, https://doi.org/10.1016/j.coldregions.2014.08.003, 2014. Hewitt, B. A., Lopez, L. S., Gaibisels, K. M., Murdoch, A.,
Hig-gins, S. N., Magnuson, J. J., Paterson, A. M., Rusak, J. A., Yao, H., and Sharma, S.: Historical trends, drivers, and future projections of ice phenology in small north temperate lakes in the Laurentian Great Lakes watershed, Water-SUI, 70, 1–16, https://doi.org/10.3390/w10010070, 2018.
Horne, F. E. and Kavvas, M. L.: Physics of the spa-tially averaged snowmelt process, J. Hydrol, 191, 179–207, https://doi.org/10.1016/s0022-1694(96)03063-6, 1997.
Jin, J., Gao, X., Yang, Z. L., Bales, R. C., Sorooshian, S., Dick-inson, R. E., Sun, S. F., and Wu, G. X.: Comparative analy-ses of physically based snowmelt models for climate simula-tions, J. Climate, 12, 2643–2657, https://doi.org/10.1175/1520-0442(1999)012<2643:caopbs>2.0.co;2, 1999.
Kaján, E. and Saarinen, J.: Tourism, climate change and adaptation: A review, Curr. Issues Tour., 16, 167–195, https://doi.org/10.1080/13683500.2013.774323, 2013.
Kane, D. L., Hinkel, K. M., Goering, D. J., Hinzman, L. D., and Outcalt, S. I.: Non-conductive heat transfer associ-ated with frozen soils, Global Planet. Change, 29, 275–292, https://doi.org/10.1016/S0921-8181(01)00095-9, 2000. Koenig, U., and Abegg, B.: Impacts of climate change on
win-ter tourism in the Swiss Alps, J. Sustain. Tour., 5, 46–58, https://doi.org/10.1080/09669589708667275, 2010.
Kumar, V., Hewage, K., Haider, H., and Sadiq, R.: Techno-economic performance evaluation of building cooling systems: A study of snow storage and conventional chiller systems, Cold Reg. Sci. Technol., 130, 8–20, https://doi.org/10.1016/j.coldregions.2016.07.004, 2016. Lintzén, N. and Knutsson, S.: Snow storage–Modelling, theory
and some new research, Cold Reg. Sci. Technol., 153, 45–54, 10.1016/j.coldregions.2018.04.015, 2018.
Moen, J., and Fredman, P.: Effects of climate change on alpine skiing in Sweden, J. Sustain Tour., 15, 418–437, https://doi.org/10.2167/jost624.0, 2009.
Molina, J.-L., Rodríguez-Gonzálvez, P., Molina, M. C., González-Aguilera, D., and Espejo, F.: Geomatic methods at the ser-vice of water resources modelling, J. Hydrol., 509, 150–162, https://doi.org/10.1016/j.jhydrol.2013.11.034, 2014.
Resources, and Environment, Beijing, China, 405–412, 7–12 November 1982.
Nagnengast, B.: Comfort from a block of ice: a history of comfort cooling using ice, ASHRAE J., Supplement, 49–57, 1999. National Oceanic and Atmospheric Administration (NOAA):
Na-tional Oceanic and Atmospheric Administration Forecast Office, Burlington VT, available at: https://www.noaa.gov/, last access: 22 October 2018.
Nordell, B. and Skogsberg, K.: Seasonal snow storage for cooling of hospital at Sundsvall, 8th International Conference on Thermal Energy Storage, University of Stuttgart, Germany, 2000. Pestereva, N. M.: Modern engineering technology to adapt to the
adverse weather and climatic conditions at mountain ski resorts, Life Sci. J., 11, 800–804, 2014.
Pickering, C. M. and Buckley, R. C.: Climate response by the ski industry: the shortcomings of snowmaking for Australian resorts, Ambio, 39, 430–438, https://doi.org/10.1007/s13280-010-0039-y, 2010.
Prokop, A., Schirmer, M., Rub, M., Lehning, M., and Stocker, M.: A comparison of measurement methods: terrestrial laser scanning, tachymetry and snow probing for the determination of the spatial snow-depth distribution on slopes, Ann. Glaciol., 49, 210–216, https://doi.org/10.3189/172756408787814726, 2008.
Rees, J.: Refrigeration Nation: a History of Ice, Appliances, and En-terprise in America, John Hopkins University Press, Maryland, 248 pp., 2013.
Riegl Laser Measurement Systems GmbH: RiScan Pro: Viewer, Acquisition and Processing Software, Software Description and User’s Instructions, Horn, Austria, 2011
Sanders-DeMott, R., McNellis, R., Jabouri, M., and Templer, P. H.: Snow depth, soil temperature and plant–herbivore interactions mediate plant response to climate change, J Ecol., 106, 1508– 1519, https://doi.org/10.1111/1365-2745.12912, 2018.
Schneebeli, M.: Development and stability of preferential flow paths in a layered snowpack, IAHS Boulder Symposium, Boul-der, United States, July 1995, IAHS Publ. no. 288, 1995. Scott, D. and McBoyle, G.: Climate change adaptation
in the ski industry, Mitig. Adapt. Strat. Gl., 12, 1411, https://doi.org/10.1007/s11027-006-9071-4, 2007.
Skogsberg, K. and Lundberg, A.: Wood chips as thermal in-sulation of snow, Cold Reg. Sci. Technol., 43, 207–218, https://doi.org/10.1016/j.coldregions.2005.06.001, 2005. Spandre, P., François, H., George-Marcelpoil, E., and Morin,
E.: Panel based assessment of snow management operations in French ski resorts, J. Outdoor Rec. Tour., 16, 24–36, https://doi.org/10.1016/j.jort.2016.09.002, 2016.
Steffen, W., Rockström, J., Richardson, K., Lenton, T. M., Folke, C., Liverman, D., Summerhayes, C. P., Barnosky, A. D., Cor-nell, S. E., and Crucifix, M.: Trajectories of the earth system in the Anthropocene, P. Natl. Acad. Sci. USA, 115, 8252–8259, https://doi.org/10.1073/pnas.1810141115, 2018.
Steiger, R., Scott, D., Abegg, B., Pons, M., and Aall, C.: A critical review of climate change risk for ski tourism, Curr. Issues Tour., 22, 1343–1379, https://doi.org/10.1080/13683500.2017.1410110, 2017. Tervo, K.: The operational and regional vulnerability of winter
tourism to climate variability and change: The case of the Finnish nature-based tourism entrepreneurs, Scand. J. Hosp. Tour., 8, 317–332, https://doi.org/10.1080/15022250802553696, 2008. Weiss, H. and Bierman, P.: Meteorological observations,
snow volume change and insulation experiment data at Craftsbury Outdoors Center, Vermont in PANGAEA, https://doi.org/10.1594/PANGAEA.899744, 2018.