www.clim-past.net/11/1417/2015/ doi:10.5194/cp-11-1417-2015
© Author(s) 2015. CC Attribution 3.0 License.
Increased aridity in southwestern Africa during the warmest
periods of the last interglacial
D. H. Urrego1,2, M. F. Sánchez Goñi1, A.-L. Daniau3, S. Lechevrel4, and V. Hanquiez4
1Ecole Pratique des Hautes Etudes EPHE, Université de Bordeaux, Environnements et Paléoenvironnements Océaniques et
Continentaux (EPOC), Unité Mixte de Recherche 5805, 33615 Pessac, France
2Geography, College of Life and Environmental Sciences, University of Exeter, Exeter, UK
3Centre National de la Recherche Scientifique CNRS, Université de Bordeaux, Environnements et Paléoenvironnements
Océaniques et Continentaux (EPOC), Unité Mixte de Recherche 5805, 33615 Pessac, France
4Université de Bordeaux, Environnements et Paléoenvironnements Océaniques et Continentaux (EPOC), Unité Mixte de
Recherche 5805, 33615 Pessac, France
Correspondence to: D. H. Urrego (d.urrego@exeter.ac.uk)
Received: 14 December 2014 – Published in Clim. Past Discuss.: 16 February 2015 Accepted: 17 September 2015 – Published: 20 October 2015
Abstract.Terrestrial and marine climatic tracers from ma-rine core MD96-2098 were used to reconstruct glacial– interglacial climate variability in southwestern Africa be-tween 194 and 24 thousand years before present. The pollen record documented three pronounced expansions of Nama-karoo and fine-leaved savanna during the last interglacial (Marine Isotopic Stage 5 – MIS 5). These Nama-karoo and fine-leaved savanna expansions were linked to increased aridity during the three warmest substadials of MIS 5. En-hanced aridity potentially resulted from a combination of reduced Benguela Upwelling, expanded subtropical high-pressure cells, and reduced austral-summer precipitation due to a northward shift of the Intertropical Convergence Zone. Decreased austral-winter precipitation was likely linked to a southern displacement of the westerlies. In contrast, during glacial isotopic stages MIS 6, 4 and 3, fynbos expanded at the expense of Nama-karoo and fine-leaved savanna indicat-ing a relative increase in precipitation probably concentrated during the austral winter months. Our record also suggested that warm–cold or cold–warm transitions between isotopic stages and substages were punctuated by short increases in humidity. Increased aridity during MIS 5e, 5c and 5a warm substages coincided with minima in both precessional index and global ice volume. On the other hand, austral-winter pre-cipitation increases were associated with precession maxima at the time of well-developed Northern Hemisphere ice caps.
1 Introduction
Southern Africa is influenced at present by tropical and sub-tropical atmospheric circulation and by both the Indian and the Atlantic oceans (Tyson and Preston-Whyte, 2000). The water exchange between the two oceans is termed the Agul-has leakage and is suggested as a potential trigger of merid-ional overturning circulation changes (Beal et al., 2011; Bi-astoch et al., 2008). The Benguela Upwelling System (BUS) also affects climate in southwestern Africa and is linked to arid conditions on the continent (Lutjeharms and Meeuwis, 1987). The complex link between globally important atmo-spheric and oceanic systems and the climate of southern Africa make understanding past climate change in the region particularly significant.
northward migration. These three climatic factors combined would result in a slight increase in humidity in northeast-ern South Africa during interglacials. However, other works suggest contrasting climate conditions with increased inter-glacial aridity based on ratios of aeolian dust and fluvial mud in marine sediments off southern Africa (Stuut and Lamy, 2004).
Vegetation-based climate reconstructions for southern Africa have been less straightforward given the paucity of records (Dupont, 2011) and fragmentary nature of some ter-restrial sequences (Scott et al., 2012; Meadows et al., 2010). On the one hand, some records point to expansions of the fynbos biome (Shi et al., 2001) and the winter-rainfall zone during glacial periods (Chase and Meadows, 2007), and to a contracting Namib Desert during interglacials (Shi et al., 2000) and the late Holocene (Scott et al., 2012). On the other hand, it has been suggested that savannas ex-panded southwards during the Holocene climate optimum (Dupont, 2011), and that the southern Africa summer-rainfall zone expanded during interglacials due to a strengthening of the Walker circulation and a southward migration of the ITCZ (Tyson, 1999). Contrastingly, significant reduc-tions of austral-summer precipitation in southern Africa are suggested to coincide with precession minima both during glacials and interglacials (Partridge et al., 1997) and are in-dependently supported by reductions of grass-fuelled fires in the subcontinent (Daniau et al., 2013). The latter observa-tions suggest aridity increase and savanna biome reducobserva-tions, instead of expansions, during the last-interglacial precession minima. Whether the last interglacial was characterised by orbitally driven increased aridity or increased precipitation may have significant implications for resource availability and climate in the region today and in the near future. Pro-jected patterns of precipitation change for the end of the 21st century indicate at least a 20 % reduction in precipita-tion in southern Africa compared to pre-2005 values (IPCC, 2014). Understanding glacial–interglacial climate and vege-tation dynamics in this region may help unravel how much of the projected precipitation change corresponds to natural variability.
In this study we aim to disentangle the contrasting hy-potheses of orbital-scale climate change in southern Africa by combining terrestrial and marine tracers from the marine sequence MD96-2098. We use pollen and charcoal as terres-trial tracers, andδ18O from benthic foraminifera as a marine tracer. Vegetation reconstructions from marine records have contributed to our understanding of ocean–land interactions in many regions of the world, including the Iberian Penin-sula (Sánchez Goñi et al., 2000), the eastern subtropical Pa-cific (Lyle et al., 2012), and the tropical Atlantic (González and Dupont, 2009). Studies from the African margin (e.g. Dupont, 2011; Dupont and Behling, 2006; Hooghiemstra et al., 1992; Leroy and Dupont, 1994; Lézine and Hooghiem-stra, 1990) have demonstrated that pollen records from ma-rine sequences are reliable and useful tools to reconstruct
changes in the regional vegetation of adjacent landmasses and the climate dynamics at orbital and suborbital timescales. In arid environments, marine sequences are particularly es-sential in providing continuous records of vegetation change at the regional scale.
The pollen sequence from MD96-2098 presented here covers the period between 24 and 190 thousand years be-fore present (ka) and provides an integrated picture of past regional vegetation changes in southwestern Africa. South-western Africa refers here to the South-western half of South Africa and Namibia that is drained by the Orange River. We com-pare vegetation-based atmospheric changes with indepen-dent climatic markers from the same marine sequence, along with other regional records for oceanic conditions and global ice dynamics, to reconstruct atmospheric and oceanic config-urations around southern Africa for Marine Isotopic Stages (MIS) 6, 5, 4 and 3.
2 Modern environmental setting
The southwestern part of the African continent (Atlantic side) is influenced by the seasonal migration of the subtrop-ical front and the southern westerlies that bring precipitation during the austral-winter months (Beal et al., 2011). Precip-itation in southwestern Africa is additionally controlled by the cold Benguela Current and wind-driven upwelling that results in aridity on the adjacent continent (Stuut and Lamy, 2004). In the Indian Ocean, warm waters from the Agulhas Current (Beal and Bryden, 1999) and austral-summer heat enhance evaporation and result in relatively high precipita-tion in southeastern Africa and the interior of the continent (Fig. 1). Austral-summer precipitation is also linked to the position of tropical low-pressure systems (e.g. ITCZ) and re-duced subtropical high pressure (Tyson and Preston-Whyte, 2000). As tropical low-pressure systems migrate northwards during the austral winter, subtropical high-pressure cells ex-pand and reduce precipitation in southern Africa. This cli-matic configuration broadly determines the vegetation distri-bution in southern Africa.
The vegetation of southern Africa was initially classi-fied into phytogeographical regions (White, 1983; Gold-blatt, 1978), and later revisited and described into seven biome units (Rutherford, 1997). These include the suc-culent karoo, Nama-karoo, desert, savanna, fynbos, grass-land, and forest (Fig. 1). The succulent karoo receives between 20 and 290 mm yr−1, of which more than 40 % falls during the austral-winter months (Rutherford, 1997). The two most abundant succulent families are Crassulaceae and Mesembryanthemaceae, and non-succulents are Anacar-diaceae, Asteraceae, and Fabaceae (Milton et al., 1997). C4 perennial grasses (Poaceae) have relatively low abundance in the succulent karoo (Milton et al., 1997).
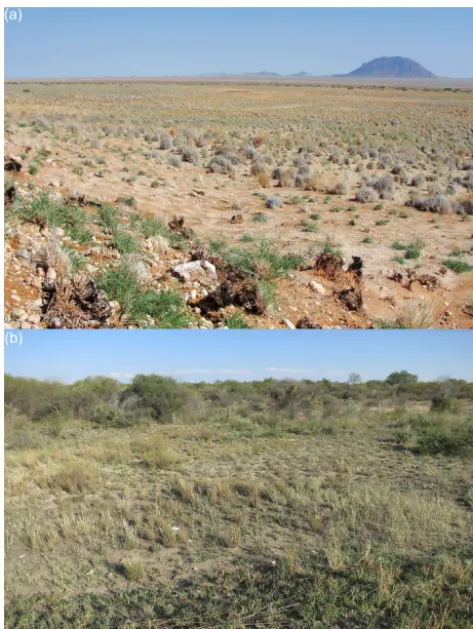
Figure 2. (a) Grass-dominated Nama-karoo vegetation near Grunau, Namibia. Photo: D. H. Urrego. (b) Grass-dominated fine-leaved savanna vegetation in the Kalahari region of Namibia. Photo: F. d’Errico.
(Palmer and Hoffman, 1997). Vegetation is characterised as dwarf open shrubland with high abundance of Poaceae, Asteraceae, Aizoaceae, Mesembryanthemaceae, Liliaceae and Scrophulariaceae (Palmer and Hoffman, 1997). Grasses from the Poaceae family can be particularly dominant in the Nama-karoo biome (Fig. 2a). The Nama-karoo and succulent karoo are structurally similar but influenced by different sea-sonal precipitation (Rutherford, 1997). The Nama-karoo is influenced primarily by austral summer precipitation, while the distribution of the succulent karoo coincides with the austral-winter rainfall region (Chase and Meadows, 2007). To the northwest, the Nama-karoo biome transitions into the desert, where mean annual precipitation can be as low as 20 mm yr−1(Jürgens et al., 1997) and water deficit as high as 2000 mm (Barnard, 1998, Fig. 1d). The desert reaches 300 km inland and its low precipitation input is linked to the intensity of BUS (Cowling et al., 1994).
High precipitation seasonality (i.e. difference between dry-season and rainy-season precipitation) and high austral-summer rainfall characterise the savanna. The savanna biome represents a mosaic that includes shrublands, dry forests, lightly wooded grasslands, and deciduous woodlands
(Sc-holes, 1997). At the landscape scale, however, the savanna can be subdivided into the fine- and broad-leaved savannas based on moisture conditions and soils (Scholes, 1997). The fine-leaved savanna (Fn-LSav) is found in fertile and dry en-vironments (between 400 and 800 mm yr−1), and the broad-leaved savanna (Bd-LSav) is found in nutrient-poor and moist environments (up to 1500 mm yr−1) (Scholes, 1997). Additionally, in the Fn-LSav fuel load and fire frequency are very low, while Bd-LSav has high fuel load and fire fre-quency (Scholes, 1997; Archibald et al., 2010). The Fn-LSav is found to the northeast of the Nama-karoo biome (Fig. 1), known as the Kalahari Highveld transition zone (Cowling and Hilton-Taylor, 2009). Due to the transitional character of the Fn-LSav, some of its outer parts have been classified as grassland or Nama-karoo (White, 1983). The composition of the Fn-LSav can be similar to that of the Nama-karoo, with dominance of C4 grasses (Poaceae) and succulent plants, but it differs in having scattered trees (Fig. 2b) (Cowling et al., 1994). The Bd-LSav is characterised by broad-leaved trees from the Caesalpiniaceae and Combretaceae families and an understory dominated by grasses (Scholes, 1997).
The grassland biome is dominated by C4 grasses and non-grassy forbs as Anthospermum sp., Lycium sp., Solanum sp. and Pentzia sp. (O’Connor and Bredenkamp, 1997). At the high elevations the biome is dominated by C3 grasses. In the grasslands, precipitation is highly seasonal with mean annual rainfall ranging between 750 and 1200 mm, falling primar-ily during the austral-summer months (O’Connor and Bre-denkamp, 1997) (Fig. 1).
The southernmost part of Africa is characterised by the fynbos biome, a fire-prone vegetation dominated by Eri-caceous and Asteraceae shrubs, diverse Protea shrubs and trees, and Restionaceae herbs (Cowling et al., 1997a). This biome receives relatively high annual precipitation (1200 mm per year) concentrated during the austral-winter months (Rutherford, 1997). The coastal forest biome is found along the eastern coast of the subcontinent and often occurs in small patches with high abundance of Podocarpus (Ruther-ford, 1997). Podocarpus patches can also be found in the southeastern part of the fynbos.
3 Materials and methods
3.1 Marine core description and pollen analysis
Pollen analysis was conducted on marine core MD96-2098 (25◦360S, 12◦380E). This giant CALYPSO core was
ar-tificial gaps created during piston extraction (Bertrand et al., 1996).
Sample volumes were estimated by water displacement. Pollen concentrations per unit volume were calculated based on a known spike of exotic Lycopodium spores added to each sample. Pollen extraction techniques included treatment with hydrofluoric and hydrochloric acids, and sieving through 150 and 10 µm filters. This filtration allowed for separating small non-palynomorph particles and concentrating pollen grains and spores. An independent test of this protocol showed that the use of a 10 µm sieve had no effect on the pollen spectra of marine samples – i.e. comparison of filtered and unfiltered sample counts showed that taxa were not selectively filtered out during pollen preparation and concentration (see http:// www.ephe-paleoclimat.com/ephe/Lab%20Facilities.htm for a detailed pollen preparation protocol). Marine sediment samples from MD96-2098 were analysed under the micro-scope until a sum of at least 100 pollen grains excluding fern spores was reached.
We used the pollen spectra from 31 terrestrial surface sam-ples collected along a transect (Fig. 1) from Cape Town (South Africa) to Lüderitz (Namibia) and designed to cover the four major biomes of southwestern Africa (Table S1 in the Supplement). The transect included samples from the desert, fynbos, Nama-karoo and succulent karoo. The ter-restrial surface samples were treated with standard acetol-ysis (Faegri and Iversen, 1989) and analysed under the mi-croscope until a pollen sum greater than 300 grains was reached. Additional details on terrestrial surface-sample col-lection and analysis can be found in the Supplement. We also used previously published pollen spectra from 150 ad-ditional surface samples collected between 22 and 35◦
lati-tude south (African Pollen Database; Gajewski et al., 2002). These pollen spectra were used to assess the distribution of Poaceae pollen abundance and other pollen taxa with po-tential indicator value for large biomes in southern Africa. ArcGIS 10 was used to draw isolines of pollen percentages by interpolating values from a total of 178 surface samples through the natural neighbour method. Additionally, we anal-ysed two marine pollen samples from the upper part of core MD96-2098 (at 5 and 10 cm depth). We compared the pollen spectra from these core-top samples with the pollen signal of the modern vegetation to evaluate how well marine sed-iments represent the vegetation of the adjacent landmasses, and to aid interpretation of the pollen record (see also Lézine and Hooghiemstra, 1990).
Pollen identification was aided by the pollen reference collection of the Department of Plant Sciences at the Uni-versity of the Free State (Bloemfontein, South Africa), the African Pollen Database (http://medias3.mediasfrance. org/pollen), the Universal Pollen Collection (http://www. palyno.org/pollen), and pollen descriptions published by Scott (1982). Pollen grains from the Asteraceae family were grouped into three pollen taxa: Artemisia-type, Stoebe-type and other morphoStoebe-types were classified into
Asteraceae-other. Some morphotypes were grouped into family types: Acanthaceae, Chenopodiaceae–Amaranthaceae, Cras-sulaceae, Cyperaceae, Ericaceae, Myrtaceae, Ranuncu-laceae, Restionaceae, and Solanaceae.
Detrended correspondence analysis (DCA) and non-metric multidimensional scaling (NMDS) (McCune and Grace, 2002) were used as parametric and non-parametric ordinations to summarise changes in the fossil pollen record. Results from the DCA ordination were preferred when NMDS was unable to reach a stable solution after several random starts, and when stress levels were too high to al-low a meaningful interpretation (McCune and Grace, 2002). These ordinations were performed on the complete data set and filtering out pollen morphotypes that occurred only in one sample. Results from the ordination performed on the re-duced data set were preferred when differences in axis scores were not discernible between the two ordinations aiming to reduce the statistical effect of rare taxa.
3.2 Marine core chronology
4 Results and discussion
4.1 Pollen preservation and sources in marine core MD96-2098
Pollen sums ranged from 100 to 240 grains (excluding fern spores) in the 141 samples analysed from core MD96-2098. We identified 83 different pollen taxa in the whole sequence, and the mean number of pollen taxa per sample was 21. The proportion of unknown pollen taxa was between 1 and 2 % per sample. The total pollen concentration ranged between ca. 300 and 16 000 grains cm−3 during most of MIS 6, 5 and 3 and increased up to 48 000 grains cm−3 during MIS 4 (Fig. S2 in the Supplement). The MIS 5 pollen concentra-tions were comparable to those found in other oceanic mar-gins (Sánchez Goñi et al., 1999), even though BUS facili-tates preservation of pollen grains and other organic micro-fossils at this site (Bertrand et al., 2003). The low net primary productivity that characterises the vegetation of southwestern Africa (Imhoff et al., 2004) is probably linked to low pollen production and could explain relatively low pollen concen-trations in the continental margin (Fig. S2).
Pollen grains are part of the fine sediment fraction and can be transported by two main vectors: aeolian or fluvial (Hooghiemstra et al., 1986; Heusser and Balsam, 1977). Dupont and Wyputta (2003) modelled present-day wind tra-jectories for marine core locations between 6 and 30◦S along the coastline of southern Africa. They suggest aeolian pollen input to the Walvis area (23◦S) via the southeast trade winds during austral summer, and dominant east-to-west wind di-rections during the austral autumn and winter. These winds transport pollen and other terrestrial particles from the Namib Desert, southern Namibia and western South Africa. The di-rection of the winds indicate that the Namib Desert, Nama-karoo and succulent Nama-karoo are the most likely sources of pollen in the Walvis Bay area (Dupont and Wyputta, 2003). The authors also infer that wind directions south of 25◦S are predominantly west to east and aeolian terrestrial input is very low. Marine site MD96-2098 is located less than a de-gree south of the area determined by Dupont and Wyputta (2003) to be dominated by wind-transported terrestrial in-put. However, given that this threshold was established using only two marine sites located 6◦apart at 23◦260 (GeoB1710-3) and 29◦270 (GeoB1722-1), it is difficult to conclude that MD96-2098 only receives wind-transported pollen.
MD96-2098 likely receives fine sediments from the Or-ange River plume. Sedimentological analyses of the OrOr-ange River delta and plume indicate that fine muds are transported both northwards and southwards (Rogers and Rau, 2006). Additionally, an analysis of the imprint of terrigenous in-put in Atlantic surface sediments found relatively high Fe/K values along the Namibian and South African margin that could reflect the input of Orange River material (Govin et al., 2012). Pollen grains are hence likely to reach the coring site from the Orange River catchment area.
Scott et al. (2004) argue that pollen in marine sediments can be the result of long-distance transport by ocean currents, suggesting that pollen assemblages in marine sediments do not reflect accurately past changes in vegetation and cli-mate. However, the highest pollen influx in marine sediments along this margin is near the coast and the vegetation source (Dupont et al., 2007), not along the paths of oceanic currents (i.e. the Benguela Current). Additionally, analyses of pollen transport vs. source in northwestern Africa show that pollen grains can sink rapidly in the water column (Hooghiemstra et al., 1986) before they can be carried away by ocean cur-rents. As a result, influence of oceanic currents on the com-position of pollen assemblages is probably negligible. Over-all, the marine site MD96-2098 might receive both aeolian and fluvial pollen input from the vegetation located east and southeast to the site.
The pollen spectra of the two core-top samples from core MD96-2098 are dominated by Poaceae (30 and 40 %), Cyperaceae (20 %) and Chenopodiaceae–Amaranthaceae (20 and 30 %) (Fig. S2 in the Supplement). This composition corresponds well with the pollen spectra from the three major biomes occupying today the adjacent landmasses (Fig. 1a): desert, Nama-karoo and Fn-LSav (Fig. S3 in the Supple-ment). Pollen percentages from fynbos taxa are less than 10 %, Podocarpus is weakly represented, and taxa specif-ically found in the broad-leaved savanna (e.g. Caesalpini-aceae, Combretaceae) are not recorded. These results support the assumption that the main pollen source for marine core MD96-2098 is the vegetation from southwestern Africa.
4.2 Distribution and interpretation of Poaceae pollen in terrestrial and marine surface samples
Occurrence of Poaceae pollen in all surface samples corre-sponds to the presence of grass species in virtually all south-ern African biomes (Cowling et al., 1997b). Altogether, the spatial distribution of Poaceae pollen percentages appears to be essential information to distinguish the pollen signal from major biomes, and therefore climatic zones, in this region. In the eastern and northeastern part of southern Africa, the high-est percentages of Poaceae pollen (up to 90 %) are found in the pollen rain of the Bd-LSav and grasslands. In the west-ern half of southwest-ern Africa, Poaceae pollen percentages in terrestrial surface samples are up to 60 % in the Nama-karoo and its transition with the Fn-LSav (Fig. 3). This suggests an over-representation of Poaceae in the pollen rain of the Nama-karoo biome, where grasses can be abundant but are not necessarily dominant.
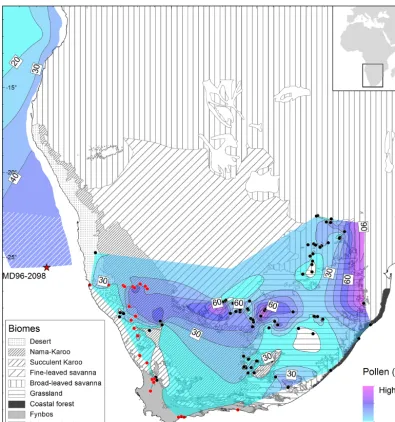
Figure 3.Poaceae pollen percentage isolines drawn over biome units of southern Africa (modified from Scholes, 1997; Mucina et al., 2007). The broad-leaved savanna distribution includes the Mopane and mixed savannas described by Scholes (1997). Isolines are plotted based on pollen percentage data from surface samples analysed in this study (red dots) and pollen spectra from other samples previously published and extracted from the African Pollen Database (black dots) (Gajewski et al., 2002). Poaceae pollen percentages in the marine domain are redrawn from Dupont and Wyputta (2003) and extended to latitude 25◦S using two MD96-2098 core-top samples (hatched).
In marine surface samples along the southwestern African coast, Poaceae pollen percentages are as low as 10 % in samples collected offshore of the Bd-LSav at around 15◦S (Fig. 3). Poaceae pollen percentages increase to the south and the highest values (40 %) are found between 20 and 25◦S (Dupont and Wyputta, 2003) and correspond well with the distribution of the desert and the Fn-LSav on the continent. The Poaceae pollen percentages in the two core-top sam-ples from MD96-2098 are used to extend the isolines drawn by Dupont and Wyputta (2003) to 25.5◦S, and show that
Poaceae pollen percentages are between 30 and 40 % off-shore of the desert, Nama-karoo and Fn-LSav biomes. As
4.3 Southwestern Africa vegetation and climatic changes from MIS 6 to 2
The pollen record presented here spans from 24.7 to 190 ka. A log transformation of concentration values in MD96-2098 results in a curve remarkably similar to that of δ18Obenthic values (Fig. 4) and may be linked to changes in pollen in-put at the coring site. Relative increases in pollen concentra-tion could indicate an increase in pollen supply during low sea-level stands when the vegetation source was closest (i.e. during glacial stages). However, this is unlikely because of the rapid depth change of the Walvis continental shelf. An increase in pollen concentration might indicate instead an in-crease in pollen supply during glacials, and/or an inin-crease in pollen preservation linked to upwelling enhancement as sug-gested by Pichevin et al. (2005). Glacial–interglacial pollen concentration variations have no effect on the interpretation of the pollen record, which is based on relative frequencies, but they do indicate the influence of the obliquity signal in the pollen record from MD96-2098. In other words, the ef-fect of orbital-scale precipitation changes on the density of the vegetation and the pollen production as a consequence.
The axis scores on DCA1 reveal changes in the compo-sition of pollen assemblages that also resemble variations in the δ18Obenthic record (Fig. 4). This similarity suggests that glacial–interglacial vegetation changes in southern Africa track global ice volume changes. DCA1 axis scores from MIS 5 and 3 are overall positive in value, while scores from MIS 6 and 4 are negative, although clustering of samples was not observed. The DCA1 axis represents relative changes in the pollen assemblage from one sample to the next. A series of large-magnitude changes in DCA1 axis scores are also vis-ible and increase in amplitude after ca. 100 ka. Such changes are also observed during MIS 6 but are of lesser magnitude. Changes in DCA axis scores suggest significant changes in vegetation composition from one sample to the next.
Nama-karoo and Fn-LSav pollen percentages are up to 60 % during MIS 5 and display three percentage peaks that correspond withδ18Obenthicand precession minima (Fig. 4a). These percentage peaks are centred at 125, 107 and 83 ka. The pollen spectra from warm marine substages MIS 5e, 5c and 5a are comparable to the core-top samples (Fig. 4) and correspond well with the modern pollen spectra from Nama-karoo and Fn-LSav (Fig. S3 in the Supplement). Addi-tionally, Nama-karoo and Fn-LSav pollen percentages in the core-top samples are relatively low compared to their maxi-mum during MIS 5e (Fig. 4b).
During MIS 6 and 4, Nama-karoo and Fn-LSav per-centages are reduced and co-vary with δ18Obenthic values. Pollen percentages of Chenopodiaceae–Amaranthaceae and Asteraceae-other are relatively high and increase along with enriched δ18Obenthic values during MIS 6 and at the end of MIS 4 (Fig. S2). Cyperaceae pollen percentages vary throughout the record and are as high as 40 % during MIS 4 (Fig. S2). Fynbos indicators (Ericaceae, Passerina,
Anthos-permum, Cliffortia, Protea, Artemisia-type, and Stoebe-type) show relative increases in pollen percentage during MIS 6, 4 and 3 (Figs. 4b and S2). Pollen percentages of Restionaceae increase after the 105 ka δ18Obenthic minimum and remain abundant during the rest of MIS 5 through MIS 3, despite a relative decrease during MIS 4. Podocarpus percentages are lower than 10 % but show increases at stage boundaries around 135 ka (MIS 6/5), 100 ka (5c/5b), 75 ka (MIS 5a/4), 60 ka (MIS 4/3), and 27 ka (MIS 3/2) (Fig. S2).
The increases in Nama-karoo and Fn-LSav during MIS 5e, 5c and 5a suggest an increase in aridity in southwestern Africa that likely resulted from expansions in three directions (Fig. 5). The Nama-karoo and Fn-LSav probably expanded to the northwest into the present-day area of the coastal Namib Desert as the intensity of BUS weakened during MIS 5 warm substages. This weakening has been documented through alkenone-based SST from marine core GeoB1711-3 (Kirst et al., 1999) (Fig. 4c), foraminifera-assemblage-based SST (Chen et al., 2002) and grain-size end-member mod-elling (Stuut et al., 2002). Stuut and Lamy (2004) also sug-gested reduced atmospheric circulation and weakening of trade winds during interglacials compared to glacials, result-ing in a reduction in the wind-driven upwellresult-ing. A weak-ened BUS and the associated relative increase in humid-ity likely led to a colonisation of desert areas by Nama-karoo or Fn-LSav (Fig. 5a). Comparable contractions of the Namib Desert linked to increased SSTs and weakening of BUS during the present interglacial are documented by Shi et al. (2000).
0 20 40 60 80 100 120 140 160 180
MIS6 MIS5
MIS4 MIS3 MIS1 MIS2
0 20 40 60 80 100 120 140 160 180 Age (ka)
Age (ka)
Precession
-0.05 0 0.05 Eccentricity
0.01 0.03 0.05
Obliquity 22
24
MIS6 MIS5
MIS4 MIS3 MIS1 MIS2
(a)
(b)
18
d
O
(%
0
)
benthic
2
3
4
5e 5c 5a
Degrees
0 40
20
Fynbos taxa (%)
Agulhas forams (%)
0 20 40 (c)
Benguela
Upwelling 18
15 21
T
emperature (°C)
190 240 280
Antarctica CO
(ppmv)2
Westerlies southward Southern Ocean
ventilation
Agulhas leakage
Log
pollen concentration
10
-3
(grains.cm
)
2.0
3.5
5.0
DCA1 axis scores
0.6
0
-0.6
Charcoal
-1
6
(nb.g
x10
)
0 5
2.5
Biomass burning
Nama-karoo/fine-leaved
savanna taxa (%)
20 60
40
0 Vegetation change
Productivity Global ice volume
Regional aridity
Austral winter precipitation
Figure 4.Terrestrial, atmospheric and oceanic markers from southern Africa plotted against age in ka (thousands of calibrated/calendar years before present). (a) Orbital parameters plotted for latitude 25◦360S using La2004 (Laskar et al., 2004). (b) Stable oxygen profile of benthic foraminifera Cibicidoides wuellerstorfi (Bertrand et al., 2002), log-transformed total pollen concentration plotted on a descending scale, detrended correspondence analysis Axis1 scores, pollen percentages of indicator taxa for Nama-karoo and fine-leaved savanna (Acanthaceae, Aizoaceae, Crassulaceae, Euphorbia, Poaceae, and Tribulus), and fynbos (Artemisia-type, Ericaceae, Passerina, Protea, and Stoebe-type), charcoal concentrations in number of particles per gram (nb g−1) from marine core MD96-2098 (Daniau et al., 2013). Stars on the left correspond to percentage of pollen taxa in two top-core samples dating 530 and 1060 calibrated years before present. (c) Independent climatic records discussed in the text: alkenone-based SST record from GeoB1711-3 indicating the strength of the Benguela Upwelling system (Kirst et al., 1999). Antarctica CO2concentration record; grey curve: low-resolution record from Vostok (Petit et al., 1999); black curve:
high-resolution EDML-Talos Dome Antarctic ice core CO2data (Bereiter et al., 2012). Cape Basin spliced record of planktic foraminifera
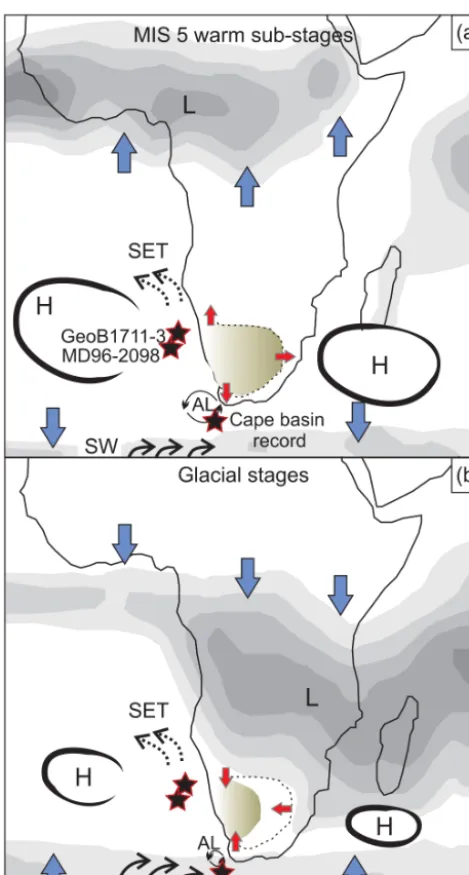
Figure 5. Schematic and simplified configuration of vegetation and atmospheric and oceanic systems over southern Africa during (a) the MIS 5 warm substages and (b) glacial isotopic stages. Rain-fall is illustrated as grey areas showing the current configuration of tropical and subtropical convection systems using average austral-winter (a) and austral-summer (b) precipitation data between 1979 and 1995 from the International Research Institute for Climate Pre-diction (http://iri.ldeo.columbia.edu). L: tropical low-pressure sys-tems; H: subtropical high-pressure syssys-tems; SET: southeast trade winds; SW: southern westerlies; AL: Agulhas leakage. Stars indi-cate the location of marine records discussed in the text and blue arrows indicate the direction of pressure system migration. Red ar-rows and the brown shaded area indicate hypothesised expansion (a) or contraction (b) of the Nama-karoo and fine-leaved savanna.
To the northeast, Nama-karoo and Fn-LSav likely pushed the limit of Bd-LSav equatorward as austral-summer pre-cipitation decreased (Fig. 5a). Austral-summer prepre-cipitation reductions in southern Africa have been linked to reduced austral-summer insolation in the Pretoria saltpan (Partridge et al., 1997) and to reductions of grass-fuelled fires during precession minima reconstructed from MD96-2098 (Daniau et al., 2013) (Fig. 4b). Increased Northern Hemisphere inso-lation during MIS 5 warm substages would drive the ITCZ northwards while subtropical high-pressure cells over the south Atlantic and the Indian Oceans would expand (Fig. 5a) (Ruddiman, 2006). Such changes in the tropical and subtropi-cal pressure systems would allow the expansion of the Nama-karoo and Fn-LSav to the northeast.
In contrast with the results presented here, previous works report poleward interglacial expansions of savannas based on pollen records from marine sediments along the southwest-ern African coast (Dupont, 2011). These studies univocally interpret the Poaceae pollen percentage increases as the result of savanna expansions. Such an interpretation is potentially plausible in marine records collecting pollen from broad-leaved savanna vegetation, e.g. the Limpopo Basin (Dupont, 2011). However, our results show that Poaceae pollen per-centage increases in sequences located off the southwest-ern African coast can altsouthwest-ernatively indicate the expansion of fine-leaved savanna and Nama-karoo vegetation. Previ-ous studies, on the other hand, do not differentiate between the Bd-LSav and Fn-LSav, despite the significant climatic and structural differences between these two types of veg-etation. The Bd-LSav is influenced by fire and receives a considerable amount of precipitation during the austral sum-mer (Scholes, 1997). The Fn-LSav is structurally and cli-matically more similar to the Nama-karoo biome, as it re-ceives very low austral-summer precipitation and does not burn (Archibald et al., 2010) despite being under a regime of significant precipitation seasonality (Scholes, 1997). If high Poaceae pollen percentages during MIS 5 warm sub-stages in our record were related to expansions of the Bd-LSav and increased summer precipitation, the fire activity should also increase during these substages. Instead, an in-dependent charcoal record from the same marine sequence MD96-2098 (Fig. 4b) documents reductions of grass-fuelled fires and a decrease in austral-summer precipitation during MIS 5 precession minima (Daniau et al., 2013). An atmo-spheric configuration with reduced austral summer precipita-tion in southern Africa and the ITCZ shifted northward dur-ing the warmest periods of MIS 5 is also consistent with doc-umented strengthening of the Asian monsoon and weakening of the South American monsoon during the last-interglacial precession minima (Wang et al., 2004).
biome during MIS 5 compared to 35 % in the core-top sam-ples. Recent model experiments on the impact of precession changes on southern African vegetation indicate that high precession is linked to reductions of the Bd-LSav (Woillez et al., 2014). Altogether these vegetation changes point to increased aridity in southwestern Africa during the warmest periods of the last interglacial.
During glacial isotopic stages, contractions of the Nama-karoo and Fn-LSav would result from a different atmo-spheric configuration (Fig. 5b): a southward migration of the ITCZ and the associated African monsoon (Daniau et al., 2013; Partridge et al., 1997) increasing austral-summer rain-fall over southern Africa; an intensification of BUS and de-creased SST off the Namibian coast (Stuut and Lamy, 2004; Kirst et al., 1999) leading to aridification of coastal areas; and, lastly, an equatorward migration of the westerlies in-creasing austral-winter precipitation and allowing a north-ward expansion of the winter-rain zone in southern Africa (Chase and Meadows, 2007). The proposed glacial precip-itation changes are consistent with recent estimates of Last Glacial Maximum palaeoprecipitation based on glacier re-construction and mass-balance modelling (Mills et al., 2012), with leaf-wax reconstructions of hydroclimate (Collins et al., 2014), and with simulated glacial climatic fluctuations in southern Africa (Huntley et al., 2014).
The pollen record from MD96-2098 also suggested glacial expansions of fynbos (Fig. 4b), as pollen percentages of Artemisia-type, Stoebe-type, Passerina and Ericaceae were higher during MIS 6, 4 and 3 than in the core-top samples (Fig. S2 in the Supplement). These results were consistent with glacial northward expansions of fynbos documented in other pollen records from southern Africa (Shi et al., 2000; Dupont et al., 2007). Our record also documented a large peak in fynbos indicators (Fig. 4b) that coincided with a fast decrease in Nama-karoo and fine-leaved savanna pollen per-centages at the MIS 5e–5d transition (ca. 117 ka), a preces-sion and eccentricity maxima (Laskar, 1990), and an acceler-ated cooling in Antarctica (EPICA, 2006; Masson-Delmotte et al., 2010) (Fig. 4c). As pollen percentages of Artemisia-type obtained from surface samples were associated with the fynbos biome and austral-winter precipitation (Figs. S4 and S5 in the Supplement), it cannot be discarded that this peak resulted from a rapid and short-lived expansion of the winter-rain zone of southern Africa. Transitions MIS 6/5 and 4/3 were characterised by small but rapid increases in Podocarpus, potentially linked to a short increase in annual precipitation. Such increases in Podocarpus have also been documented in other records from southern Africa (Dupont, 2011).
Finally, the amplitude of millennial-scale vegetation changes increased between ca. 100 and ca. 25 ka and was highlighted by switches from negative to positive DCA1 scores (Fig. 4b) and increased variability of Restionaceae pollen percentages. Increased Restionaceae pollen could in-dicate expansions of fynbos vegetation, or enhanced pollen
transport from the fynbos region linked to increased trade-wind strength (see additional discussion on present-day pollen–vegetation–climate relationships in the Supplement). Other fynbos indicators did not display the same trend (Fig. 4), suggesting that Restionaceae variability between 100 and 24 ka was more likely the result of enhanced vari-ability of southeast trade winds. Restionaceae pollen percent-age data from a record 2◦ of latitude north of our marine site also showed comparable increases in the amplitude of millennial-scale changes (Shi et al., 2001). Grain-size wind strength tracers from the Walvis Ridge also displayed en-hanced millennial-scale variability, although only after ca. 80 ka (Stuut and Lamy, 2004). An analysis of BUS dy-namics over the past 190 ka found increased millennial-scale variability in wind strength after ca. 100 ka and the high-est wind strength in this zone during MIS 4 and 3 (Stuut et al., 2002). Such millennial-scale atmospheric reorganisations were probably recorded in the pollen-based DCA analysis as rapid biome shifts in southwestern Africa.
5 Conclusions
Terrestrial and marine markers from the marine core MD96-2098 documented expansions of the Nama-karoo and fine-leaved savanna during MIS 5e, 5c and 5a warm substages. Northwestern expansions of the Nama-karoo and Fn-LSav are potentially linked to the reduction in BUS and a local increase in humidity in the desert area, while aridification increased at a regional scale. Towards the east, Nama-karoo and Fn-LSav expansions probably resulted from increased subtropical high pressure, a northward shift of the ITCZ, and reduced austral-summer precipitation. Nama-karoo and Fn-LSav expansions to the southern boundary are possibly asso-ciated with southern displacement of the westerlies and the subtropical front, decreasing austral-winter precipitation.
During glacial isotopic stages MIS 6, 4 and 3, fynbos biome expansions are probably linked to the increased influ-ence of the southern westerlies and austral-winter precipita-tion in southwestern Africa. Our pollen record also suggested that warm–cold or cold–warm transitions between isotopic stages and substages were punctuated by short increases in humidity. Increased variability in vegetation changes at mil-lennial timescales ca. 100 ka was also documented and could be associated with previously identified enhanced variability of the southeastern trade winds.
Nama-karoo at the expense of the winter-rain fed fynbos and succulent karoo biomes. However, taking the current orbital configuration alone, the Nama-karoo and fine-leaved savanna in southern Africa might naturally remain relatively reduced for several millennial ahead.
The Supplement related to this article is available online at doi:10.5194/cp-11-1417-2015-supplement.
Acknowledgements. We would like to thank H. Hooghiemstra and C. Miller for their helpful and constructive feedback. We are also grateful to L. Scott for giving us access to the pollen reference collection at the University of the Free State, Bloemfontein, South Africa. Thanks to K. Gajewski and the African Pollen Database for complementary terrestrial surface data. We acknowledge the Artemis programme for support for radiocarbon dates at the Laboratoire de Mesure du Carbone 14. We thank Murielle Georget and Marie Hélène Castera for sample preparation and pollen extraction, Linda Rossignol for foraminifera preparation for 14C dating, Ludovic Devaux for help with the surface-sample data set, and Will Banks for English proofreading. The marine core was retrieved during the NAUSICAA oceanographic cruise (IMAGES II). This work was funded by the European Research Council grant TRACSYMBOLS no. 249587 http://tracsymbols.eu/.
Edited by: D. Fleitmann
References
Archibald, S., Scholes, R. J., Roy, D. P., Roberts, G., and Boschetti, L.: Southern African fire regimes as revealed by re-mote sensing, International Journal of Wildland Fire, 19, 861– 878, doi:10.1071/WF10008, 2010.
Barnard, P.: Biological diversity in Namibia, The Namibian Na-tional Biodiversity Task Force, Windhoek, Namibia, 332 pp., 1998.
Beal, L. M. and Bryden, H. L.: The velocity and vorticity structure of the Agulhas Current at 32◦S, J. Geophys. Res.-Oceans, 104, 5151–5176, 10.1029/1998jc900056, 1999.
Beal, L. M., De Ruijter, W. P. M., Biastoch, A., and Zahn, R.: On the role of the Agulhas system in ocean circulation and climate, Nature, 472, 429–436, doi:10.1038/nature09983, 2011. Bereiter, B., Lüthi, D., Siegrist, M., Schüpbach, S., Stocker, T.
F., and Fischer, H.: Mode change of millennial CO2
variabil-ity during the last glacial cycle associated with a bipolar ma-rine carbon seesaw, P. Natl. Acad. Sci. USA, 109, 9755–9760, doi:10.1073/pnas.1204069109, 2012.
Bertrand, P., Balut, Y., Schneider, R., Chen, M. T., Rogers, J., and Shipboard Scientific Party: Scientific report of the NAUSICAA-IMAGES II coring cruise. Les rapports de campagne à la mer à bord du Marion-Dufresne, URA CNRS 197, Université Bor-deaux1, Departement de Geologie et Oceanographie, Talence, France, 382 pp., 1996.
Bertrand, P., Giraudeau, J., Malaize, B., Martinez, P., Gallinari, M., Pedersen, T. F., Pierre, C., and Vénec-Peyré, M. T.: Oc-currence of an exceptional carbonate dissolution episode dur-ing early glacial isotope stage 6 in the Southeastern Atlantic, Mar. Geol., 180, 235–248, doi:10.1016/s0025-3227(01)00216-x, 2002.
Bertrand, P., Pedersen, T. F., Schneider, R., Shimmield, G., Lallier-Verges, E., Disnar, J. R., Massias, D., Villanueva, J., Tribovillard, N., Huc, A. Y., Giraud, X., Pierre, C., and Vénec-Peyre, M.-T.: Organic-rich sediments in ventilated deep-sea environments: Re-lationship to climate, sea level, and trophic changes, J. Geophys. Res., 108, 3045, doi:10.1029/2000JC000327, 2003.
Biastoch, A., Böning, C. W., and Lutjeharms, J. R. E.: Agulhas leak-age dynamics affects decadal variability in Atlantic overturning circulation, Nature, 456, 489–492, 2008.
Chase, B. M. and Meadows, M. E.: Late Quaternary dynamics of southern Africa’s winter rainfall zone, Earth-Sci. Rev., 84, 103– 138, doi:10.1016/j.earscirev.2007.06.002, 2007.
Chen, M.-T., Chang, Y.-P., Chang, C.-C., Wang, L.-W., Wang, C.-H., and Yu, E.-F.: Late Quaternary sea-surface temperature variations in the southeast Atlantic: a planktic foraminifer fau-nal record of the past 600 000 yr (IMAGES II MD962085), Mar. Geol., 180, 163–181, doi:10.1016/s0025-3227(01)00212-2, 2002.
Collins, J. A., Schefuß, E., Govin, A., Mulitza, S., and Tiedemann, R.: Insolation and glacial–interglacial control on southwestern African hydroclimate over the past 140 000 years, Earth Planet. Sc. Lett., 398, 1–10, doi:10.1016/j.epsl.2014.04.034, 2014. Correa-Metrio, A., Urrego, D. H., Cabrera, K., and Bush, M. B.:
pa-leoMAS: paleoecological analysis, R package version 1.1 Edn., 2010.
Cowling, R. M., Esler, K. J., Midgley, G. F., and Honig, M. A.: Plant functional diversity, species diversity and climate in arid and semi-arid southern Africa, J. Arid Environ., 27, 141–158, 1994.
Cowling, R. M., Richardson, D. M., and Mustart, P. J.: Fynbos, in: Vegetation of Southern Africa, edited by: Cowling, R. M., Richardson, D. M., and Pierce, S. M., Cambridge University Press, Cambridge, UK, 99–130, 1997a.
Cowling, R. M., Richardson, D. M., and Pierce, S. M.: Vegetation of Southern Africa, Cambridge University Press, Cambridge, UK, 615 pp., 1997b.
Cowling, R. M. and Hilton-Taylor, C.: Phytogeography, flora and endemism, in: The Karoo. Ecological Patterns and Processes, edited by: Dean, W. R. J., and Milton, S., Cambridge University Press, Cambridge, UK, 42–56, 2009.
Daniau, A.-L., Sánchez Goñi, M. F., Martinez, P., Urrego, D. H., Bout-Roumazeilles, V., Desprat, S., and Marlon, J. R.: Orbital-scale climate forcing of grassland burning in southern Africa, P. Natl. Acad. Sci., 110, 5069–5073, doi:10.1073/pnas.1214292110, 2013.
Dewar, G., Reimer, P. J., Sealy, J., and Woodborne, S.: Late-Holocene marine radiocarbon reservoir correction (1R) for the west coast of South Africa, The Holocene, 22, 1481–1489, doi:10.1177/0959683612449755, 2012.
Dupont, L. M.: Orbital scale vegetation change in Africa, Quaternary Sci. Rev., 30, 3589–3602, doi:10.1016/j.quascirev.2011.09.019, 2011.
Dupont, L. M. and Wyputta, U.: Reconstructing pathways of aeolian pollen transport to the marine sediments along the coastline of SW Africa, Quaternary Sci. Rev., 22, 157–174, 2003.
Dupont, L. M. and Behling, H.: Land–sea linkages during deglacia-tion: High-resolution records from the eastern Atlantic off the coast of Namibia and Angola (ODP site 1078), Quatern. Int., 148, 19–28, doi:10.1016/j.quaint.2005.11.004, 2006.
Dupont, L. M., Behling, H., Jahns, S., Marret, F., and Kim, J.-H.: Variability in glacial and Holocene marine pollen records off-shore from west southern Africa, Veg. Hist. Archaeobot., 16, 87– 100, doi:10.1007/s00334-006-0080-8, 2007.
EPICA: One-to-one coupling of glacial climate variabil-ity in Greenland and Antarctica, Nature, 444, 195–198, doi:10.1038/nature05301, 2006.
Faegri, K. and Iversen, J.: Textbook of Pollen Analysis, 4th Edn., Wiley, Chichester, 328 pp., 1989.
Gajewski, K., Lezine, A.-M., Vincens, A., Delestan, A., and Sawada, M.: Modern climate.vegetation.pollen relations in Africa and adjacent areas, Quaternary Sci. Rev., 21, 1611–1631, 2002.
Goldblatt, P.: An Analysis of the Flora of Southern Africa: Its Char-acteristics, Relationships, and Orgins, Ann. Mo. Bot. Gard., 65, 369–436, doi:10.2307/2398858, 1978.
González, C. and Dupont, L. M.: Tropical salt marsh succession as sea-level indicator during Heinrich events, Quaternary Sci. Rev., 28, 939–946, doi:10.1016/j.quascirev.2008.12.023, 2009. Govin, A., Holzwarth, U., Heslop, D., Ford Keeling, L., Zabel, M.,
Mulitza, S., Collins, J. A., and Chiessi, C. M.: Distribution of major elements in Atlantic surface sediments (36◦N–49◦S): Im-print of terrigenous input and continental weathering, Geochem. Geophy. Geosy., 13, Q01013, doi:10.1029/2011GC003785, 2012.
Henderson, G. M. and Slowey, N. C.: Evidence from U-Th dat-ing against Northern Hemisphere forcdat-ing of the penultimate deglaciation, Nature, 404, 61–66, doi:10.1038/35003541, 2000. Heusser, L. and Balsam, W. L.: Pollen distribution in the
north-east Pacific Ocean, Quatern. Res., 7, 45–62, doi:10.1016/0033-5894(77)90013-8, 1977.
Hijmans, R. J., Cameron, S. E., Parra, J. L., Jones, P. G., and Jarvis, A.: Very high resolution interpolated climate surfaces for global land areas, Internat. J. Climatol., 25, 1965–1978, 2005. Hooghiemstra, H., Agwu, C. O. C., and Beug, H.-J.: Pollen and
spore distribution in recent marine sediments: a record of NW-African seasonal wind patterns and vegetation belts, Meteor Forschungs-Ergebnisse C, 40, 87–135, 1986.
Hooghiemstra, H., Stalling, H., Agwu, C. O. C., and Dupont, L. M.: Vegetational and climatic changes at the northern fringe of the Sahara 250,000–5000 years BP: evidence from 4 marine pollen records located between Portugal and the Canary Islands, Rev. Palaeobot. Palyno., 74, 1–53, doi:10.1016/0034-6667(92)90137-6, 1992.
Hughen, K., Baillie, M., Bard, E., Bayliss, A., Beck, J., Bertrand, C., Blackwell, P., Buck, C., Burr, G., Cutler, K., Damon, P., Edwards, R., Fairbanks, R., Friedrich, M., Guilderson, T., Kromer, B., Mc-Cormac, F., Manning, S., Ramsey, C. B., Reimer, P., Reimer, R., Remmele, S., Southon, J., Stuiver, M., Talamo, S., Taylor,
F., Plicht, J. V. D., and Weyhenmeyer, C.: Marine04 Marine ra-diocarbon age calibration, 26–0 ka BP, Rara-diocarbon, 46, 1059– 1086, 2004.
Huntley, B., Midgley, G. F., Barnard, P., and Valdes, P. J.: Suborbital climatic variability and centres of biological diversity in the Cape region of southern Africa, J. Biogeogr., 41, 1338–1351, 2014. Imhoff, M. L., Bounoua, L., Ricketts, T., Loucks, C., Harriss, R.,
and Lawrence, W. T.: Global patterns in human consumption of net primary production, Nature, 429, 870–873, 2004.
IPCC: Fifth Assessment Report of the Intergovernmental Panel on Climate Change, Intergovernmental Panel on Climate Change, NJ, USA, 2014.
Jürgens, N., Burke, A., Seely, M. K., and Jacobson, K. M.: Desert, in: Vegetation of Southern Africa, edited by: Cowling, R. M., Richardson, D. M., and Pierce, S. M., Cambridge Unversity Press, Cambridge, 189–214, 1997.
Kirst, G. J., Schneider, R. R., Müller, P. J., von Storch, I., and Wefer, G.: Late Quaternary temperature variability in the Benguela Cur-rent System derived from alkenones, Quatern. Res., 52, 92–103, doi:10.1006/qres.1999.2040, 1999.
Laskar, J.: The chaotic motion of the solar system: A numerical estimate of the chaotic zones, Icarus, 88, 266–291, 1990. Laskar, J., Robutel, P., Joutel, F., Gastineau, M., Correia, A. C. M.,
and Levrard, B.: A long-term numerical solution for the insola-tion quantities of the Earth Astronomy and Astrophysics, 428, 261–285, 2004.
Leroy, S. and Dupont, L.: Development of vegetation and continen-tal aridity in northwestern Africa during the Late Pliocene: the pollen record of ODP site 658, Palaeogeogr. Palaeocl., 109, 295– 316, doi:10.1016/0031-0182(94)90181-3, 1994.
Lézine, A. and Hooghiemstra, H.: Land-sea comparisons dur-ing the last glacial-interglacial transition: pollen records from West Tropical Africa, Palaeogeogr. Palaeocl., 79, 313–331, doi:10.1016/0031-0182(90)90025-3, 1990.
Lisiecki, L. E. and Raymo, M. E.: A Pliocene-Pleistocene stack of 57 globally distributed benthic d18O records, Paleoceanography, 20, PA1003, doi:10.1029/2004pa001071, 2005.
Lutjeharms, J. R. E. and Meeuwis, J. M.: The extent and variability of South-East Atlantic upwelling, S. Afr. J. Marine Sci., 5, 51– 62, doi:10.2989/025776187784522621, 1987.
Lyle, M., Heusser, L., Ravelo, C., Yamamoto, M., Barron, J., Diff-enbaugh, N. S., Herbert, T., and Andreasen, D.: Out of the trop-ics: the Pacific, Great Basin Lakes, and Late Pleistocene water cycle in the western United States, Science, 337, 1629–1633, 2012.
Masson-Delmotte, V., Stenni, B., Pol, K., Braconnot, P., Cattani, O., Falourd, S., Kageyama, M., Jouzel, J., Landais, A., Minster, B., Barnola, J. M., Chappellaz, J., Krinner, G., Johnsen, S., Röth-lisberger, R., Hansen, J., Mikolajewicz, U., and Otto-Bliesner, B.: EPICA Dome C record of glacial and interglacial intensities, Quaternary Sci. Rev., 29, 113–128, 2010.
Mills, S. C., Grab, S. W., Rea, B. R., Carr, S. J., and Farrow, A.: Shifting westerlies and precipitation patterns during the Late Pleistocene in southern Africa determined using glacier recon-struction and mass balance modelling, Quaternary Sci. Rev., 55, 145–159, doi:10.1016/j.quascirev.2012.08.012, 2012.
Milton, S. J., Yeaton, R. I., Dean, W. R. J., and Vlok, J. H. J.: Succu-lent karoo, in: Vegetation of Southern Africa, edited by: Cowling, R. M., Richardson, D. M., and Pierce, S. M., Cambridge Unver-sity Press, Cambridge, 131–166, 1997.
Mucina, L., Rutherford, M. C., and Powrie, L. W.: Vegetation Map of South Africa, Lesotho and Swaziland, 2nd Edn., South African National Biodiversity Institute Pretoria, 2007.
O’Connor, T. G. and Bredenkamp, G. J.: Grassland, in: Vegetation of Southern Africa, edited by: Cowling, R. M., Richardson, D. M., and Pierce, S. M., Cambridge University Press, Cambridge, UK, 215–257, 1997.
Palmer, A. R. and Hoffman, M. T.: Nama-Karoo, in: Vegetation of Southern Africa, edited by: Cowling, R. M., Richardson, D. M., and Pierce, S. M., Cambridge Unversity Press, Cambridge, 167– 188, 1997.
Partridge, T. C., Demenocal, P. B., Lorentz, S. A., Paiker, M. J., and Vogel, J. C.: Orbital forcing of climate over South Africa: A 200,000-year rainfall record from the pretoria salt-pan, Quaternary Sci. Rev., 16, 1125–1133, doi:10.1016/S0277-3791(97)00005-X, 1997.
Peeters, F. J. C., Acheson, R., Brummer, G.-J. A., de Ruijter, W. P. M., Schneider, R. R., Ganssen, G. M., Ufkes, E., and Kroon, D.: Vigorous exchange between the Indian and Atlantic oceans at the end of the past five glacial periods, Nature, 430, 661–665, 10.1038/nature02785, 2004.
Petit, J. R., Jouzel, J., Raynaud, D., Barkov, N. I., Barnola, J.-M., Basile, I., Bender, M., and Chappellaz, J.: Climate and atmo-spheric history of the past 420 000 years from the Vostok ice core, Antarctica, Nature, 399, 429–436, 1999.
Pichevin, L., Martinez, P., Bertrand, P., Schneider, R., Giraudeau, J., and Emeis, K.: Nitrogen cycling on the Namibian shelf and slope over the last two climatic cycles: Local and global forcings, Pa-leoceanography, 20, PA2006, doi:10.1029/2004pa001001, 2005. Reimer, P. J., Bard, E., Bayliss, A., Beck, J. W., Blackwell, P. G., Bronk Ramsey, C., Buck, C. E., Cheng, H., Edwards, R. L., Friedrich, M., Grootes, P. M., Guilderson, T. P., Haflidason, H., Hajdas, I., Hatté, C., Heaton, T. J., Hoffmann, D. L., Hogg, A. G., Hughen, K. A., Kaiser, K. F., Kromer, B., Manning, S. W., Niu, M., Reimer, R. W., Richards, D. A., Scott, E. M., Southon, J. R., Staff, R. A., Turney, C. S. M., and Plicht, J. V. D.: IntCal13 and Marine13 radiocarbon age calibration curves 0–50 000 years cal BP, Radiocarbon, 55, 1869–1887, 2013.
Rogers, J. and Rau, A. J.: Surficial sediments of the wave-dominated Orange River Delta and the adjacent continental mar-gin off south-western Africa, Afr. J. Mar. Sci., 28, 511–524, doi:10.2989/18142320609504202, 2006.
Röthlisberger, R., Mudelsee, M., Bigler, M., de Angelis, M., Fis-cher, H., Hansson, M., Lambert, F., Masson-Delmotte, V., Sime, L., Udisti, R., and Wolff, E. W.: The Southern Hemisphere at glacial terminations: insights from the Dome C ice core, Clim. Past, 4, 345–356, doi:10.5194/cp-4-345-2008, 2008.
Ruddiman, W. F.: Orbital changes and climate, Quaternary Sci. Rev., 25, 3092–3112, 2006.
Rutherford, M. C.: Categorization of biomes, in: Vegetation of Southern Africa, edited by: Cowling, R. M., Richardson, D. M., and Pierce, S. M., Cambridge University Press, Cambridge, UK, 91–98, 1997.
Sánchez Goñi, M. F., Eynaud, F., Turon, J. L., and Shackleton, N. J.: High resolution palynological record off the Iberian mar-gin: direct land-sea correlation for the Last Interglacial com-plex, Earth Planet. Sc. Lett., 171, 123–137, doi:10.1016/s0012-821x(99)00141-7, 1999.
Sánchez Goñi, M. F., Turon, J.-L., Eynaud, F., and Gendreau, S.: European climatic response to millennial-scale changes in the atmosphere–ocean system during the Last Glacial period, Quatern. Res., 54, 394–403, doi:10.1006/qres.2000.2176, 2000. Sánchez Goñi, M. F., and Harrison, S. P.: Millennial-scale climate
variability and vegetation changes during the Last Glacial: Con-cepts and terminology, Quatern. Sci. Rev., 29, 2823–2827, 2010. Scholes, R. J.: Savanna, in: Vegetation of Southern Africa, edited by: Cowling, R. M., Richardson, D. M., and Pierce, S. M., Cam-bridge University Press, CamCam-bridge, UK, 258–277, 1997. Scott, L.: Late Quaternary fossil pollen grains from the Transvaal,
South Africa, Rev. Palaeobot. Palynol., 36, 241–268, 1982. Scott, L., Marais, E., and Brook, G. A.: Fossil hyrax dung
and evidence of Late Pleistocene and Holocene vegetation types in the Namib Desert, J. Quaternary Sci., 19, 829–832, doi:10.1002/jqs.870, 2004.
Scott, L., Neumann, F. H., Brook, G. A., Bousman, C. B., Norström, E., and Metwally, A. A.: Terrestrial fossil-pollen evidence of climate change during the last 26 thousand years in Southern Africa, Quaternary Sci. Rev., 32, 100–118, doi:10.1016/j.quascirev.2011.11.010, 2012.
Shi, N., Dupont, L. M., Beug, H.-J., and Schneider, R.: Corre-lation between vegetation in southwestern Africa and oceanic upwelling in the past 21,000 years, Quatern. Res., 54, 72–80, doi:10.1006/qres.2000.2145, 2000.
Shi, N., Schneider, R., Beug, H.-J., and Dupont, L. M.: Southeast trade wind variations during the last 135 kyr: evidence from pollen spectra in eastern South Atlantic sediments, Earth Planet. Sc. Lett., 187, 311–321, doi:10.1016/s0012-821x(01)00267-9, 2001.
Southon, J., Kashgarian, M., Fontugne, M., Metivier, B., and Yim, W. W.-S.: Marine reservoir corrections for the Indian Ocean and Southeast Asia, Radiocarbon, 44, 167–180, 2002.
Stuut, J.-B. W., Prins, M. A., Schneider, R. R., Weltje, G. J., Jansen, J. H. F., and Postma, G.: A 300-kyr record of aridity and wind strength in southwestern Africa: inferences from grain-size dis-tributions of sediments on Walvis Ridge, SE Atlantic, Mar. Geol., 180, 221–233, doi:10.1016/s0025-3227(01)00215-8, 2002. Stuut, J.-B. W. and Lamy, F.: Climate variability at the
south-ern boundaries of the Namib (southwestsouth-ern Africa) and Ata-cama (northern Chile) coastal deserts during the last 120,000 yr, Quatern. Res., 62, 301–309, doi:10.1016/j.yqres.2004.08.001, 2004.
Toggweiler, J. R. and Russell, J.: Ocean circulation in a warming climate, Nature, 451, 286–288, 2008.
Tyson, P. D.: Atmospheric circulation changes and palaeoclimates of southern Africa, S. Afr. J. Sci., 95, 194–201, 1999.
Waelbroeck, C., Frank, N., Jouzel, J., Parrenin, F., Masson-Delmotte, V., and Genty, D.: Transferring radiometric dating of the last interglacial sea level high stand to marine and ice core records, Earth Planet. Sc. Lett., 265, 183–194, 2008.
Wang, X., Auler, A. S., Edwards, R. L., Cheng, H., Cristalli, P. S., Smart, P. L., Richards, D. A., and Shen, C.-C.: Wet periods in northeastern Brazil over the past 210 kyr linked to distant climate anomalies, Nature, 432, 740–743, 2004.
Weldeab, S., Stuut, J.-B. W., Schneider, R. R., and Siebel, W.: Holocene climate variability in the winter rainfall zone of South Africa, Clim. Past, 9, 2347–2364, doi:10.5194/cp-9-2347-2013, 2013.
White, F.: The vegetation of Africa: a descriptive memoir to ac-company the Unesco/AETFAT/UNSO vegetation map of Africa, Paris, 356 pp., 1983.