www.solid-earth.net/6/173/2015/ doi:10.5194/se-6-173-2015
© Author(s) 2015. CC Attribution 3.0 License.
High-precision relocation of seismic sequences above a dipping
Moho: the case of the January–February 2014 seismic sequence
on Cephalonia island (Greece)
V. K. Karastathis, E. Mouzakiotis, A. Ganas, and G. A. Papadopoulos
National Observatory of Athens, Institute of Geodynamics, Lofos Nymfon, P.O. Box 20048, 11810 Athens, Greece Correspondence to: V. K. Karastathis (karastathis@noa.gr)
Received: 5 August 2014 – Published in Solid Earth Discuss.: 2 September 2014
Revised: 15 December 2014 – Accepted: 23 December 2014 – Published: 12 February 2015
Abstract. Detailed velocity structure and Moho mapping is of crucial importance for a high precision relocation of micity occurring out of, or marginal to, the geometry of seis-mological networks. Usually the seismographic networks do not cover the boundaries of converging plates such as the Hellenic arc. The crustal thinning from the plate bound-ary towards the back-arc area creates significant errors in accurately locating the earthquake, especially when distant seismic phases are included in the analysis. The case of the Cephalonia (Ionian Sea, Greece) sequence of January– February 2014 provided an excellent example where the hypocentral precision was greatly affected by the crustal thinning from the plate boundary at the Ionian sea towards the Aegean sea. This effect was examined in detail by test-ing various velocity models of the region in order to deter-mine an optimal model. Our tests resulted in the adoption of a velocity model that resembles the crustal thinning of the region. Then, a relocation procedure was performed in the Cephalonia sequence for the time period of 26 January to 15 May 2014 by applying probabilistic non-linear loca-tion algorithms. The high-precision relocaloca-tion resulted in an improved spatial distribution of the seismicity with respect to the preliminary locations and provided a reliable basis to examine seismotectonic implications of the Cephalonia se-quence.
1 Introduction
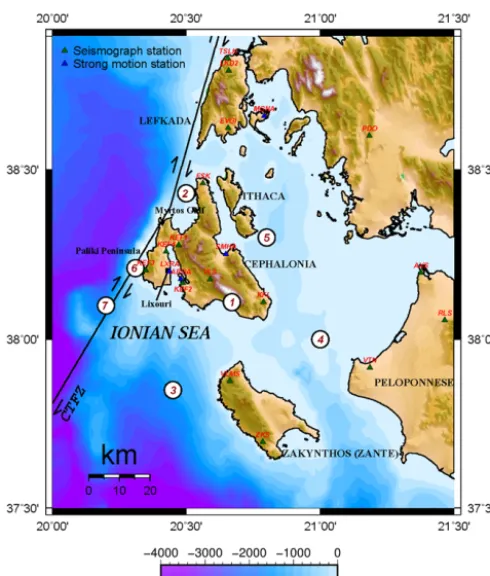
On 26 January (13:55:42 and 18:45:08 GMT) and 3 February 2014 (03:08:44 GMT), western Cephalonia, an island on the
Ionian Sea (Greece) (Fig. 1), was ruptured by three strong earthquakes of magnitudesMw=6.0,Mw=5.3, andMw= 5.9 (Table 1, Fig. 2). The two strongest earthquakes caused considerable damage in buildings and infrastructure as well as several types of ground failures (rockfalls, landslides, soil liquefaction) on the Paliki peninsula, mainly in Lixouri and its surrounding villages (Papadopoulos et al., 2014; Valka-niotis et al., 2014) (Fig. 1). The peak ground acceleration (PGA) recorded in several localities at accelerometric sta-tions, operated by the National Observatory of Athens, In-stitute of Geodynamics (NOAGI) (NOA web report, 2014a, b) and the Institute of Engineering Seismology and Earth-quake Engineering (EPPO-ITSAK, 2014a, b) reached up to 0.56 and 0.77g in Lixouri during the first and third earth-quake, respectively. Since only three permanent seismic sta-tions existed in Cephalonia, on 28 and 29 January 2014 four portable seismic stations (Fig. 2) were installed by NOAGI in the aftershock zone of western Cephalonia with the aim of improving the monitoring capabilities.
Figure 1. Location map of the study region. The Cephalonia Trans-form Fault zone (CTFZ) is also indicated on the map. The seis-mographic stations of the Hellenic Unified Seismological Network (HUSN) are depicted with green-colored triangles and the strong motion stations with blue ones. Significant earthquakes after 1900 (Papazachos et al., 2010) are shown as white circles: (1) 24 Ja-nuary 1912,M=6.8; (2) 9 August 1953,M=6.4; (3) 11 August 1953,M=6.8; (4) 12 August 1953,M=6.3; (5) 12 August 1953,
M=7.2; (6) 17 September 1972,M=6.3; (7) 17 January 1983,
M=7.0.
et al., 1999) (Fig. 1). The strong (Mw=6.2) earthquake on 14 August 2003 ruptured off the coast of western Lefkada along the Lefkada segment of CTFZ (Fig. 1; Papadopoulos et al., 2003). Recently, Papadopoulos et al. (2014) proposed, based on the spatial pattern of the Cephalonia 2014 earth-quake sequence, that the Lefkada segment does not termi-nate at the NW side of Cephalonia, as previously thought, but extends into western Cephalonia (Fig. 1). A second major structure that controls the seismicity of the area is the north-eastern subduction of the Ionian segment of the Hellenic Arc beneath Cephalonia (Sachpazi et al., 2000), thus making up a highly complex seismotectonic setting.
The January–February 2014 seismic sequence is the first one that ruptured western Cephalonia and was recorded by modern seismograph instruments. Therefore, the study of this sequence is of particular importance to better understand the seismicity of Cephalonia. To this aim we performed a high-precision relocation of the seismic sequence of more
than 3300 events of magnitude range M=1.0–6.0 from 26 January to 15 May 2014. Then, relocation results were utilized to interpret the seismotectonics of the 2014 activity as well as the geometry and kinematics of the major structure of the CTFZ.
2 The problem of location
The routine determination of earthquake hypocentral param-eters usually suffers from significant errors.
More specifically, the main sources of errors for an accu-rate determination of the hypocentral parameters are (a) pick-ing errors, (b) false identification of the seismic phases, (c) insufficient number of phases, (d) deficient azimuthal coverage of the seismographic network, and finally (e) use of non-effective seismic velocity models that are usually over-simplified (often 1-D) without adequate information for the velocity structure and the lateral velocity heterogeneities. It is a common practice that unified, regional 1-D velocity mod-els are in use, which is also the case of NOAGI for the daily seismicity monitoring of Greece (see Fig. 3). Such velocity models deviate considerably from the local velocity structure of an area, especially outside of the area covered by the net-work.
Although it is feasible to derive reliable seismic velocity models for areas on a local scale through the implementa-tion of nonlinear inversion techniques that simultaneously in-vert travel-time data for the hypocentral parameters and seis-mic velocity determination (Kissling et al., 1994; Kissling, 1995; Thurber, 1993; Koulakov, 2009), it is difficult to per-form this practice on a regional scale. Additionally, inper-forma- informa-tion coming from crustal seismic surveys is usually useful to build only local velocity models. The crustal mapping based on gravity models suffers from intrinsic ambiguity and the resolution of the seismic velocity global models is too low (Koulakov and Sobolev, 2006).
Table 1. Focal parameters of the three strong earthquakes of the January–February 2014 Cephalonia seismic sequence as preliminary calcu-lated by NOA. The revised solutions are also shown.
Date Time Lat Long Mw ML h
(deg) (deg) (km)
26.01.14 13.55.42.7 38.2190 20.5322 6.0 5.8 16.4 Preliminary 38.2102 20.4614 16.5 Relocated
26.01.14 18.45.08.3 38.2282 20.4138 5.3 5.1 16.5 Preliminary 38.2514 20.4555 12.5 Relocated
03.02.14 03.08.44.7 38.2462 20.3958 5.9 5.7 11.3 Preliminary
38.2734 20.4310 4.6 Relocated
Figure 2. Map of the aftershock sequence from 26 January to 15 May 2014 as determined by the National Observatory of Athens. The moment tensor solutions for the largest events as calculated by the Global Centroid Moment Tensor Project: Harvard University, USA (HARV), National Observatory of Athens (NOA), and the German Research Centre for Geoscience (GFZ).
low as 20 km or less (Makris, 1975, 1976, 1977; Bohnhoff et al., 2001; Tirel et al., 2004). A similar pattern of crustal thinning to the east but with shallower Moho depths (28 km under Cephalonia) was proposed by Sodoudi et al. (2006). Thus, when an earthquake occurs in the thick part of the crust and the paths of the first arriving waves pass through the Moho as it progressively becomes shallower, the travel-time errors may increase considerably with the increase of the epicentral distance. In contrast, shallower events are not so strongly affected, particularly in short epicentral distances since only Pg phases are actually picked. This structure causes an asymmetrical shape to the head-wave wavefront. Due to this structure, the adoption of a 1-D velocity model (see NOA-IG model in Fig. 3) can cause systematic travel-time residuals at the event’s location.
3 Analysis of seismological data
Figure 3. The seismicP- andS-wave velocity models tested for the relocation of the aftershock sequence. Green, blue, and red corre-spond to velocity models proposed by Haslinger et al. (1999), Sach-pazi et al. (2000), and Hirn et al. (1996), respectively. The model routinely used by NOAGI is marked in purple. TheS-wave model of NOAGI is based on a constantVp/Vs=1.73. For Hirn et al. (1996) and Sachpazi et al. (2000), a constantVp/Vsratio of 1.80 was used as proposed by previous studies (Hatzfeld et al., 1995; Le Meur et al., 1997; see also Haslinger et al., 1999). Haslinger et al. (1999) provide a separate velocity model.
permanent network, meaning that no stations were situated to the west of the earthquake focus. Consequently, the az-imuthal coverage was poor, leading to unstable location so-lutions. In addition, the preliminary solution included several phases from significantly large epicentral distances extend-ing up to 360 km, where the crustal thickness was signifi-cantly smaller than that in the subduction regime of west-ern Cephalonia. The 1-D model used by NOAGI (Fig. 3), with the Moho boundary placed at 40 km, could not match Pn phase data from areas of thin crust, particularly at large epicentral distances. Therefore, significant errors were in-volved and consequently the epicenter of the first strong earthquake was shifted substantially to the east. Its after-shocks, however, were not shifted significantly because their small magnitudes prevented the use of many distant stations where the velocity model was inadequate. In a next para-graph it is explained more precisely how errors are intro-duced in the epicentral solution.
The preliminary epicenter of the strong (Mw=5.3) after-shock on 26 January 2014 (18:45:08 GMT) was located in a noticeably better agreement to the macroseismic epicen-ter (Fig. 2), although it was calculated before the installation of the portable network in Cephalonia. This is explained by the fact that its actual focal depth was shallower than that of the first strong earthquake. It is also worth mentioning that 1 s after the first strong shock on 26 January 2014, an-other strong aftershock occurred. Unfortunately, the wave-form of this event partially overlapped with the wavewave-form of the first strong shock, making an accurate estimation of its
local and moment magnitudes quite difficult. The estimation of its duration magnitude isMd=5.0. The existence of this event, although not reported in earthquake catalogs, justifies the accounts of local people of another shock strongly felt in Cephalonia a few seconds after the first major event.
After the installation of the portable network in western Cephalonia, the maximum azimuthal gap was decreased sig-nificantly, becoming less than 180◦ for most of the seis-mic events. The preliminary focus of the strong earthquake (Mw=5.9) on 3 February 2014 was located at a shallower depth (h=11 km, Table 1) but within the aftershock cloud (Fig. 2) and at a position close to its macroseismic epi-center, which again was determined to be (Papadopoulos et al., 2014) in Lixouri.
To effectively relocate the hypocenter data of the sequence one may use a velocity model resembling as much as possi-ble the real velocity structure. An effective model can com-pensate for most of the systematic time residuals created at distant stations. An alternative method is to use a 1-D model to find the epicentral distance range where the effect of the inclined Moho does not considerably affect the location ac-curacy. This approach limits the seismic phases taken into account. It is reasonably expected that the two different ap-proaches should lead to quite similar results.
4 Selection of a velocity model – relocation of the Cephalonia 2014 earthquake sequence
4.1 Proposed models for the region
structure in this model was almost horizontal, the 1-D model in Fig. 3 can be easily derived.
The velocity model of Haslinger et al. (1999) (Fig. 3) was built for the eastern region of Lefkada (western Greece), which as regards to the Cephalonia 2014 sequence, concen-trates a high percentage of the ray paths between the earth-quakes and the stations. This model was based on a pas-sive experiment and was built as a “1-D minimum velocity model” for this region by the VELEST algorithm (Kissling et al., 1994; Kissling, 1995) and used in a following stage as the initial model in the local earthquake tomography method and SIMULPS code (Thurber, 1993; Eberhart-Phillips, 1990, 1993), implemented to calculate the 3-D crustal velocity structure. The SIMULPS code uses a linearized damped least-square inversion to solve the non-linear problem of the hypocentral location and velocity model. Because of this non-linear nature of the problem, the initial velocity model and the initial hypocenter locations in the inversion proce-dure should be as close as possible to their true values. The “1-D minimum velocity model” calculated by the VELEST algorithm can provide a good approximation and be used as an initial velocity model. The minimum 1-D velocity models are usually used for seismicity relocation (e.g., Lippitsch et al., 2005; Ganas et al., 2014).
The model proposed by Sachpazi et al. (2000) (Fig. 3) was also created by the VELEST algorithm in order to be used as the initial model in a 3-D local earthquake tomography to determine the velocity structure of the studied area. The procedure for the construction of a 1-D minimum velocity model is highly dependent on the selection of an initial model (Karastathis et al., 2011) and, therefore, it is usually based on the results of seismic profiles. Sachpazi et al. (2000) based their initial model on the seismic profiles presented by Hirn et al. (1996).
For the adoption of an appropriate seismic velocity model, we compared the three 1-D models mentioned above (Fig. 3). As we will see later in detail, the model that performed bet-ter was that proposed by Haslinger et al. (1999). With a ver-tical velocity gradient based on Haslinger et al. (1999) we constructed, tested, and adopted a 2-D velocity model with a non-horizontal Moho boundary based on Papazachos and Nolet (1997). Figure 4 shows the vertical cross section of the 2-D model.
4.2 Synthetic data
Before comparing the performance of these models, we ex-amine the influence on the location procedure of the non-horizontal Moho boundary in the Aegean region. More specifically, in order to assess the impact of the errors im-posed in the earthquake location procedure by the adoption of a simplified 1-D model in the presence of a non-horizontal Moho structure, we constructed synthetic arrival times for the adopted model using the 3-D version of the eikonal finite-difference scheme of Podvin and Lecomte (1991) and
esti-Figure 4. The 2-D velocity model tested to assess the influence of Moho structure. The Moho boundary has been based on the results of Papazachos and Nolet (1997). The position of Cephalonia is be-tween 0 and 50 km. The hypocenters of the major events are shown with stars: blue for the event of 26 January 2014 (Mw=6.0), yel-low for the aftershock on 26 January 2014 (Mw=5.3), and red for the event of 3 February 2014 (Mw=5.9).
mated the time differences for both a horizontal and a non-horizontal Moho structure. The velocity gradient was based on Haslinger et al. (1999). The 2-D model with the non-horizontal Moho boundary is shown in Fig. 4 and the re-sults of the comparison with the respective 1-D model are depicted in Fig. 5. As one may expect, the time difference is zero only when the first arrivals are also zero due to the Pg seismic phases. Obviously, the shallower events, with fo-cal depth between 5 and 10 km are not, or only slightly, af-fected, particularly when they do not bare enough energy to travel at long epicentral distances. As a result, the majority of the shallow aftershocks remain unaffected. In contrast, the influence is higher for the deeper and stronger events, such as the first strong earthquake on 26 January 2014. For this strong earthquake three different epicenters were calculated with the use of the 1-D (with the inclusion or the exclusion of distant phases) and 2-D (with all phases) models (Fig. 6). It can be seen how the simplified 1-D velocity model affects the epicenter location when distant phases are taken into ac-count. The error decreases when distant phases are omitted.
We concluded that, for lack of reliable knowledge regard-ing the structure and velocity of the Moho boundary and in the presence of poor azimuthal seismographic coverage, it is preferable to limit the range of the epicentral distances of sta-tions used and to base the location mostly on the Pg phases.
Figure 5. Time differences ofP-wave (the two panels in the upper row) and S-wave (the two panels in the lower panel) arrivals be-tween synthetic data calculated on the basis of the 1-D model and data collected using the 2-D model (based on the same 1-D model but with a non-horizontal Moho boundary). Earthquake focal depths of 5 km (left column) and 15 km (right column) are represented. The hypothetical epicenter is shown as a red circle. The errors imported in the case which does not take into account the Moho structure can be significant at long distances.
is characterized by strong advantages compared to linearized methods. More precisely, the EDT function provides a more reliable uncertainty estimate, especially in the presence of outliers, than the conventional least-squares L1 and L2 norms for the misfit calculation between the observed and calcu-lated travel times. Another advantage of the method is that it is independent of origin time, so the 4-D problem of hypocenter location reduces to a 3-D search over spatial loca-tion of the hypocenter (latitude, longitude, depth). The Non-LinLoc algorithm can also use 2-D and 3-D velocity models.
4.3 Real data
For the relocation of the Cephalonia 2014 aftershock se-quence, we used NOAGI phase data set consisting of more than 44 000P-wave and 24 000S-wave arrivals for the time interval from 26 January to 15 May 2014, corresponding to more than 3300 events. Phase data from distant stations (1 >120 km) were excluded. It should be noted, however, that small magnitude events remained unaffected since they could hardly be identified at greater epicentral distances any-way.
Figure 6. The epicenter of the strong earthquake (Mw=6.0) on 26 January 2014 calculated with the 1-D model of Haslinger et al. (1999) (see Fig. 3) including distant phases (light blue star at the east), the same 1-D model excluding distant phases (blue star at the west), and the 2-D model (see Fig. 4) including distant phases (red star).
We compared both the 2-D and 1-D versions of the adopted model with the three models proposed by previous authors (Fig. 3). For the comparison we selected events with at least sixP- and oneS-wave arrivals and an azimuthal gap lower than 180◦. The station delays were calculated as an average value of observed travel-time residual of the well-located events (GAP<180◦, RMS<1 s, horizontal uncer-tainty ERH and vertical unceruncer-tainty ERZ<1 km) and ap-plied to the location procedure. Station corrections compen-sate for the effect of the station’s local geology, which could not be taken into account by the use of a 1-D velocity model. The adopted model succeeds in producing a more compact horizontal projection (Fig. 7) and verifies that the aftershock sequence, trending NNE–SSW, covers only the western part of Cephalonia at a length of about 35 km and maximum lat-eral width of about 10 km (see also Table 1 for the relocated hypocenters of the three major events). It is noteworthy that the relocated aftershock area nearly coincides with the main part of the macroseismic field that is covered by the isoseis-mal of level V, which is also the area of ground failures pro-duced by the strong earthquakes on 26 January and 3 Febru-ary 2014 (Papadopoulos et al., 2014).
Figure 7. Relocation results by using the velocity models of (a) the 2-D velocity model that resembles the Moho structure, (b) the 1-D velocity model proposed by Haslinger et al. (1999), (c) the 1-D velocity model proposed by Sachpazi et al. (2000), (d) the 1-D velocity model proposed by Hirn et al. (1996), and (e) the 1-D velocity model used by NOAGI for the daily seismic monitoring.
have a horizontal uncertainty less than 600 m (Table 2). As we can also see in the same table, the original 1-D model of Haslinger et al. (1999) is not notably inferior to the other three models, which produced significantly larger uncertain-ties. Similar results can be seen also in Fig. 9, depicting the vertical uncertainty distribution (see also Table 2).
For the first 15 km of depth, the model of Haslinger et al. (1999) has similar velocity values with the model pro-posed by Hirn et al. (1996), which was produced from
Table 2. Distribution of horizontal (ERH) and vertical (ERZ) uncertainties for the events relocated with several seismic velocity models.
Performance Adopted model Haslinger et al. (1999) Sachpazi et al. (2000) Hirn et al. (1996) NOAGI
ERH<900 m 86 % 83 % 71 % 39 % 76 %
ERH<600 m 57 % 57 % 43 % 21 % 46 %
ERZ<900 m 89 % 87 % 81 % 64 % 68 %
ERZ<600 m 69 % 67 % 59 % 44 % 43 %
RMS SD 0.063 0.065 0.119 0.488 0.086
shallow Moho boundary is likely the main reason for the poor relocation results we obtained from the model of Hirn et al. (1996).
The aftershock focal depths calculated by various models also show significant variations (Fig. 8). The adopted model, as well as that of Haslinger et al. (1999), has the vast ma-jority of focal depths between 6 and 14 km. The model of Sachpazi et al. (2000) calculated a significant percentage of the hypocenters at depths between 4 and 6 km and a very low percentage with depths greater than 12 km. No hypocenters with unrealistic depth values (<4) were calculated by the models based on Haslinger et al. (1999).
5 Seismotectonic implications and discussion
The spatial distribution of the relocated earthquake sequence (Fig. 7a) confirms that the 2014 earthquake activity covers only the western part of Cephalonia Island trending from NNE to SSW at a length of about 35 km and maximum lateral width of ca. 10 km. No earthquake activity developed off the coast of western Cephalonia. As a consequence, the January– February 2014 earthquake sequence can hardly be seismo-tectonically associated with the Cephalonia segment of the major right-lateral strike-slip structure of the CTFZ, as the latter was proposed by Louvari et al. (1999). On the contrary, the aftershock pattern implies that the 2014 activity ruptured western Cephalonia due to onshore strike-slip faulting. One possible scenario is that the activated strike-slip faults com-prise the southern prolongation of the NNE–SSW trending Lefkada segment of the CTFZ. Papadopoulos et al. (2014) suggested that the Lefkada CTFZ segment does not terminate off the coast of NW Cephalonia, as proposed by previous au-thors (Louvari et al., 1999), but extends further into western Cephalonia. Another scenario is that the activated strike-slip faults comprise segments of a 30 km, nearly N–S trending fault zone that splits the island into a western and an eastern part. The consequence is that western Cephalonia appears as a seismotectonic block independent of eastern Cephalonia, which hosted the sources of the large 1953 earthquakes.
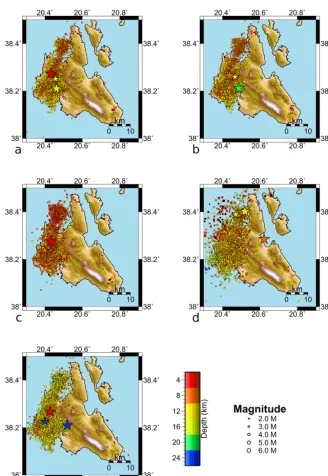
The space–time evolution of the 2014 sequence (Fig. 9), based on the high-precision relocated earthquake catalogue that we produced, indicates that soon after the occurrence of the first strong earthquake on 26 January 2014, the aftershock area was already well shaped. No further expansion of the
af-Figure 8. Distribution of hypocentral depth of the relocated Cephalonia 2014 earthquake sequence up to 15 May 2014 for dif-ferent seismic velocity models: (a) the adopted 2-D model, which is a modification of the Haslinger et al. (1999) model; (b) Haslinger et al. (1999); (c) Sachpazi et al. (2000); (d) Hirn et al. (1996); and (e) the model routinely used in the daily seismic monitoring by NOAGI.
tershock area was observed either after 29 January, when the portable network was installed, or after the strong earthquake on 3 February 2014.
Figure 9. Space–time evolution of the Cephalonia 2014 sequence. The maps show the aftershocks with 1-week time interval (a–f) between 26 January 2014 and 26 March 2014.
in the area of the Myrtos Gulf, possibly a near-vertical fault striking WNW–ESE that is perpendicular to the NNE–SSW strike of the Lefkada 2003 and the Cephalonia 2014 after-shock areas. This fault, which probably controlled the initi-ation of the 2014 sequence, can be seen in the NNE–SSW cross section in Fig. 10c that depicts clearly the vertical ge-ometry of the EW cross fault at Myrtos Gulf at depths of 5– 12 km. Evidence also comes from the space–time evolution of the relocated 2014 sequence (Fig. 9), but further examina-tion is needed.
With the relocation applied, the foci of the three strongest earthquakes of the sequence shifted at shallower depths, while the first strong earthquake on 26 January 2014 also shifted towards WNW with respect to the preliminary
deter-minations (Table 1). The thickness of the seismogenic layer does not exceed 16 km. That the 2014 aftershock area was well formed from the very beginning without spatial expan-sion after the strong earthquake on 3 February 2014 provides evidence that this earthquake ruptured within the aftershock volume of the 26 January 2014 earthquake, the largest event of the sequence. From this point of view we may consider that the 3 February event was the strongest aftershock of the sequence that ruptured at a shallower depth and at a different fault from that of the main shock on 26 January 2014.
Table 3. Mean horizontal and absolute source location distances between the adopted model and the other seismic velocity models.
Haslinger et al. (1999) Sachpazi et al. (2000) Hirn et al. (1996) NOAGI
Mean horizontal distance (km) 0.7 1.8 5.3 2.4
Mean absolute distance (km) 2.5 3.1 7.1 3.7
Figure 10. Vertical sections of the aftershock sequence and their lo-cation on the map: (a) the hypocenters (with GAP<180◦) between 26 and 30 January 2014; (b) the hypocenters (with GAP<180◦) between 3 and 8 February 2014; and (c) the hypocenters (with GAP<180◦) for the whole sequence (26 January–15 May 2014).
shock on 26 January, the aftershocks until 30 January in-cluded in a ±4 km wide zone seem arranged in a plane of nearly (+/−10◦) N–S and dip of about 65◦ to the east (Fig. 10a). The preferred fault-plane adopted by Papadopou-los et al. (2014) and Valkaniotis et al. (2014) is of strike 23◦ and dip 68◦to the east, which is consistent with the geom-etry represented by the vertical section. However, the verti-cal section through the hypocenter of the 3 February 2014 event (Fig. 10b) shows that the fault plane strikes nearly (+/−10◦) N–S but its dip is about 65◦ to the west. The geometry of this fault plane is compatible with the fault plane that dips 56◦to the west according to the focal mech-anism computed by the GFZ (183◦/56◦/138◦; reported on
the European-Mediterranean Seismological Centre website (2015). The western dip in combination with the oblique-slip rake may result in uplift of the hanging wall (western) of the N–S fault during co-seismic motion.
Our relocation procedure suggests a different fault model than that of Karakostas et al. (2014; their Fig. 8), who sug-gested a right step of CTFZ, on the Paliki peninsula. Contrar-ily, we detected the activation of two blind strike-slip faults along the N–S axis at the Myrtos Gulf–Lixouri line, possibly overlapping with a left step. The 26 January 2014 activated fault (Fig. 10a) is in agreement with the blind fault model of Valkaniotis et al. (2014). Such a fault configuration may explain the co-seismic uplift seen on the Paliki peninsula in InSAR data (Boncori et al., 2015) because our relocation data in the epicentral region of the 3 February 2014 event point to a west-dipping fault (Fig. 10b). If this is the case, then the hanging wall of this fault moved upwards during co-seismic motion; it is known that Cephalonia region is in state of com-pression with maximum horizontal stress oriented at N78◦E (+/−9◦; Ganas et al., 2013), as determined from GPS data.
In addition, Lagios et al. (2012) obtained a N–S discontinu-ity in their horizontal velocdiscontinu-ity field (see Fig. 4c of Lagios et al., 2012) across the Gulf of Argostoli, which may be indica-tive of a crustal block boundary or a large fault zone beneath the Gulf.
6 Conclusions
1. The strong earthquakes on Cephalonia on 26 January and 3 February 2014 clearly show the problem of in-correct hypocentral determination for earthquakes that occur at the borders of the seismograph network of Greece, near the region of convergence of the tectonic plates when an oversimplified 1-D velocity model is used.
2. We propose a 2-D velocity model with a non-horizontal Moho boundary that resembles the crustal thinning of the Hellenic Arc region.
4. The distribution of the relocated epicenters covers only the western part of Cephalonia, trending NNE–SSW for about 35 km with a lateral width of ca. 10 km.
5. The 2014 earthquake sequence is associated with dex-tral, strike-slip faults on the island of Cephalonia. More-over, a vertical section through the hypocenter of the 3 February 2014 event shows that the fault plane strikes nearly N–S but its dip is about 65◦to the west.
6. Our relocated hypocentral distribution delineates a shal-low, near-vertical fault existing in the area of Myrtos Gulf, striking WNW–ESE, perpendicular to both the strike of the Lefkada 2003 and the Cephalonia 2014 af-tershock areas.
Acknowledgements. Thanks are extended to the acting director and the staff of the Institute of Geodynamics for the daily processing of many seismic phases as well as for the installation of the portable network in Cephalonia. Thanks are also due to the topical editor of the journal, Takaaki Taira, for his suggestions on improving the original manuscript. We would also like thank Ivan Koulakov and the anonymous reviewer for the thorough review of the manuscript and their constructive comments.
Edited by: T. Taira
References
Ambraseys, N.: Earthquakes in the Mediterranean and Middle East, Cambridge University Press, New York, 8, 4333–4355, 2009. Bohnhoff, M., Makris, J., Papanikolaou, D., and Stavrakakis, G.:
Crustal investigation of the Hellenic subduction zone using wide aperture seismic data, Tectonophysics, 343, 239–262, 2001. Boncori, J. P. M., Papoutsis, I., Pezzo, G., Tolomei, C., Atzori, S.,
Ganas, A., Karastathis, V., Salvi, S., Kontoes, C., and Antonioli, A.: The February 2014 Cephalonia Earthquake (Greece): 3D De-formation Field and Source Modeling from Multiple SAR Tech-niques, Seismol. Res. Lett., in press, 2015.
Eberhart-Phillips, D.: Three-dimensional P and S velocity structure in the Coalinga Region, California, J. Geophys. Res., 95, 15343– 15363, 1990.
Eberhart-Phillips, D.: Local earthquake tomography: earthquake source regions, in: Seismic Tomography: Theory and Practice, edited by: Iyer, H. M. and Hiahara, K., Chapman and Hall, Lon-don, 613–643, 1993.
EPPO-ITSAK: The January 26th, 2014 Earthquake in Cephalonia, Preliminary Report, by EPPO-ITSAK, available at: http://www.slideshare.net/itsak-eppo/ 2014-0127-kefaloniaeqpreliminaryreporta, last access: 28 Ja-nuary 2015, 2014a (in Greek).
EPPO-ITSAK: Strong Ground Motion of the February 3, 2014 Cephalonia Earthquake: Effect on Soil and Built Environment in Combination with the January 26, 2014 Event, available at: http://www.slideshare.net/itsak-eppo/ 20140203-kefaloniaeq-report-en, last access: 28 January 2015, 2014b.
European-Mediterranean Seismological Centre website: Full ten-sors solutions (event 20140203 03:08), http://www.emsc-csem. org/Earthquake/mtfull.php?id=357329, last access: 28 January 2015.
Ganas, A., Marinou, A., Anastasiou, D., Paradissis, D., Papazissi, K., Tzavaras, P., and Drakatos, G.: GPS-derived estimates of crustal deformation in the central and north Ionian Sea, Greece: 3-yr results from NOANET continuous network data, J. Geody-namics, 67, 62–71, 2013.
Ganas, A., Karastathis, V., Moshou, A., Valkaniotis, S., Mouzaki-otis, E., and Papathanassiou, G.: Aftershock properties and seis-motectonic setting of the 7 August 2013 moderate earthquake in Kallidromon Mountain, central Greece, Tectonophysics, 617, 101–113, 2014.
Haslinger, F., Kissling, E., Ansorge, J., Hatzfeld, D., Papadimitriou, E., Karakostas, V., Makropoulos, K., Kahle, H. G., and Peter, Y.: 3D crustal structure from local earthquake tomography around the Gulf of Arta (Ionian region, NW Greece), Tectonophysics, 304, 201–218, 1999.
Hatzfeld, D., Kassaras, I., Panagiotopoulos, D., Amorese, D., Makropoulos, K., Karakaisis G., and Coutant, O.: Microseismic-ity and strain pattern in northwestern Greece, Tectonics, 14, 773– 785, 1995.
Hellenic Unified Seismological Network: Webpage of Hellenic Unified Seismic Network (H.U.S.N.) hosted in the website of In-stitute of Geodynamics, of National Observatory of Athens: http: //www.gein.noa.gr/en/networks/husn/, last access: 28 January 2015.
Hirn, A., Sachpazi, M., Siliqi, R., Bride, J. M., Marnelis, F., Cerno-bori, L., and STREAMERS-PROFILES group: A traverse of the Ionian islands front with coincident normal incidence and wide-angle seismics, Tectonophysics, 264, 35–49, 1996.
Karagianni, E. E., Papazachos, C. B., Panagiotopoulos, D. G., Suhadolc, P., Vuan, A., and Panza, G. F.: Shear velocity struc-ture in the Aegean area obtained by inversion of Rayleigh waves, Geophys. J. Int., 160, 127–143, 2005.
Karakostas, V., Papadimitriou, E., Mesimeri, M., Gkarlaouni, C., and Paradisopoulou, P.: The 2014 Kefalonia doublet (Mw 6.1 and Mw 6.0), Central Ionian Islands, Greece: Seismotectonic impli-cations along the Kefalonia transform fault zone, Acta Geophys., 1–16, 2014.
Karastathis, V. K., Papoulia, J., Di Fiore, B., Makris, J., Tsambas, A., Stampolidis, A., and Papadopoulos, G. A.: Deep structure investigations of the geothermal field of the North Euboean Gulf, Greece, using 3-D local earthquake tomography and Curie point depth analysis, J. Volcanol. Geoth. Res., 206, 106–120, 2011. Kissling, E.: Velest User’s Guide, Institute of Geophysics, ETH
Zurich, Switzerland, 26 pp., http://www.seg.ethz.ch/software/ velest_guide.pdf, 1995.
Kissling, E., Ellsworth, W. L., Eberhart-Phillips, D., and Kradolfer, U.: Initial reference models in local earthquake tomography, J. Geophys. Res., 99, 19635–19646, 1994.
Koulakov, I. and Sobolev, S. V.: Moho depth and three-dimensional P and S structure of the crust and uppermost mantle in the Eastern Mediterranean and Middle East derived from tomographic inver-sion of local ISC data, Geophys. J. Int., 164, 218–235, 2006. Lagios, E., Papadimitriou, P., Novali, F., Sakkas, V., Fumagalli, A.,
Vlachou, K., and Del Conte, S.: Combined Seismicity Pattern Analysis, DGPS and PSInSAR studies in the broader area of Cephalonia (Greece), Tectonophysics, 524, 43–58, 2012. Le Meur, H., Virieux, J., and Podvin, P.: Seismic tomography of the
Gulf of Corinth: a comparison of methods, Ann. Geophys.-Italy, 40, 1–24, 1997.
Lippitsch, R., White, R. S., and Soosalu, H.: Precise hypocentre relocation of microearthquakes in a high temperature geothermal field: the Torfajökull central volcano, Iceland. Geophys. J. Int, 160, 371–388, 2005.
Lomax, A., Virieux, J., Volant, P., and Berge-Thierry, C.: Prob-abilistic earthquake location in 3-D and layered models, in: Advances in Seismic Event Location, edited by: Thurber, C. H. and Rabinowitz, N., Kluwer Academic Publishers, Dor-drecht/Boston/London, 101–134, 2000.
Louvari, E., Kiratzi, A. A., and Papazachos, B. C.: The CTF and its extension to western Lefkada Island, Tectonophysics, 308, 223– 236, 1999.
Makris, J.: Crustal Structure of the Aegean Sea and the Hellenides Obtained from Geophysical Survey, J. Geophys., 41, 441–443, 1975.
Makris, J.: A dynamic model of the Hellenic arc deduced from geo-physical data, Tectonophysics, 36, 339–346, 1976.
Makris, J.: Geophysical Investigations of the Hellenides, Ham-burger Geophysikalische Einzelschriften, G. M. L. Wittenborn Söhne, Hamburg, Heft 34, 124 pp., 1977.
Makris, J.: The crust and upper mantle of the Aegean region from deep seismic soundings, Tectonophysics, 46, 269–284, 1978. Makris, J., Papoulia, J., and Yegorova, T.: A 3-D density model of
Greece constrained by gravity and seismic data, Geophys. J. Int., 194, 1–17, 2013.
NOA web report, internal report, available at: http://www.gein.noa. gr/Documents/pdf/Cefalonia_20140126_preliminary_web.pdf (last access: 4 June 2014), 2014a.
NOA web report, internal report, available at: http://www.gein.noa. gr/Documents/pdf/Cefalonia_20140203_preliminary_web.pdf (last access: 4 June 2014), 2014b.
Papadopoulos, G. A., Karastathis, V. K., Ganas, A., Pavlides, S., Fokaefs, A., and Orfanogiannaki, K.: The Lefkada, Ionian Sea (Greece), shock (Mw 6.2) of 14 August 2003: Evidence for the characteristic earthquake from seismicity and ground failures, Earth Planet. Space, 55, 713–718, 2003.
Papadopoulos, G. A., Karastathis, V. K., Koukouvelas, I., Sach-pazi, M., Baskoutas, I., Chouliaras, G., Agalos, A., Daskalaki, E., Minadakis, G., Moschou, A., Mouzakiotis, E., Orfanogian-naki, A., Papageorgiou, A., Spanos D., and Triantafyllou, I.: The Cephalonia, Ionian Sea (Greece), sequence of strong earthquakes of January-February 2014: a first report, Res. Geophys., 4, 19– 30, 2014.
Papazachos, B. C. and Papazachou C. B.: The Earthquakes of Greece, Ziti Editions, Thessaloniki, 2003 (in Greek).
Papazachos, B. C., Comninakis, P. E., Scordilis, E. M., Karakaisis, G. F., and Papazachos C. B.: A catalogue of earthquakes in the Mediterranean and surrounding area for the period 1901–2010, Publ. Geophys. Laboratory, University of Thessaloniki, Greece, 2010.
Papazachos, C. B. and Nolet, G.: P and S deep velocity structure of the Hellenic area obtained by robust nonlinear inversion of travel times, J. Geophys. Res., 102, 8349–8367, 1997.
Pearce, F. D., Rondenay, S., Sachpazi, M., Charalampakis, M., and Royden, L. H.: Seismic investigation of the transition from con-tinental to oceanic subduction along the western Hellenic Sub-duction Zone, J. Geophys. Res., 117, 1978–2012, 2012. Podvin, P. and Lecomte, I.: Finite difference computation of
trav-eltimes in very contrasted velocity models: a massively parallel approach and its associated tools, Geophys. J. Int., 105, 271–284, 1991.
Sachpazi, M., Hirn, A., Clement, C., Laigle, M., Haslinger, F., Kissling, E., Charvis, P., Hello, Y., Lepine, J., Sapine, M., and Ansorge, J.: Western Hellenic subduction and Cephalonia trans-form: local earthquakes and plate transport and strain, Tectono-physics, 319, 301–319, 2000.
Scordilis, E. M., Karakaisis, G. F., Karakostas, B. G., Panagiotopou-los, D. G., Comninakis, P. E., and Papazachos, B. C.: Evidence for Transform Faulting in the Ionian Sea: the Cephalonia Island Earthquake Sequence of 1983, Pure Appl. Geophys., 123, 388– 397, 1985.
Sodoudi, F., Kind, R., Hatzfeld, D., Priestley, K., Hanka, W., Wyle-galla, K., Stavrakakis, G., Vafidis, A., Harjes H.-P., and Bohn-hoff, M.: Lithospheric structure of the Aegean obtained from P and S receiver functions, J. Geophys. Res., 111, B12307, doi:10.1029/2005JB003932, 2006.
Tarantola, A. and Valette, B.: Inverse problems=quest for infor-mation, J. Geophys., 50, 159–170, 1982.
Thurber, C. H.: Local earthquake tomography: velocities andVp= Vs – theory, in: Seismic Tomography: Theory and Practice, edited by: Iyer, H. M. and Hiahara, K., Chapman and Hall, Lon-don, 563–583, 1993.
Tiberi, C., Diament, M., Lyon-Caen, H., and King, T.: Moho topog-raphy beneath the Corinth Rift area (Greece) from inversion of gravity data, Geophys. J. Int., 145, 797–808, 2001.
Tirel, C., Gueydan, F., Tiberi, C., and Brun, J. P.:. Aegean crustal thickness inferred from gravity inversion. Geodynamical impli-cations, Earth Planet. Sc. Lett., 228, 267–280, 2004.
Tsokas, G. N. and Hansen, R. O.: Study of the crustal thickness and the subducting lithosphere in Greece from gravity data, J. Geophys. Res., 102, 20585–20597, 1997.
Underhill, J. R.: Late Cenozoic deformation of the Hellenide fore-land, western Greece, Geol. Soc. Am. Bull., 101, 613–634, 1989. Valkaniotis, S., Ganas, A., Papathanassiou, G., and Papaniko-laou, M.: Field observations of geological effects trig-gered by the January-February 2014 Cephalonia (Ionian Sea, Greece) earthquakes, Tectonophysics, 630, 150–157, doi:10.1016/j.tecto.2014.05.012, 2014.