Communication
Study of Very Forward Neutrons with the CMS Zero
Degree Calorimeter
Olivér Surányi on Behalf of the CMS Collaboration
MTA-ELTE Lendület CMS Particle and Nuclear Physics Group, Eötvös Loránd University, 1053 Budapest, Hungary; [email protected]
Received: 15 August 2019; Accepted: 5 October 2019; Published: 9 October 2019
Abstract: Forward neutrons are studied in proton-lead collisions at the CMS experiment at the CERN LHC. They provide information on the centrality and event plane of collisions and provide an opportunity to study nuclear breakup. At the CMS experiment they are detected by the Zero Degree Calorimeters (ZDCs) in the|η|>8.5 pseudorapidity range. The ZDCs are quartz fiber Cherenkov
calorimeters using tungsten as absorber. Test beam data and events with a single spectator neutron are used for the calibration of these detectors. A Fourier-based method is used correct for the effect of multiple pPb collisions. The corrected ZDC energy distribution is used to calculate centrality percentiles and unfold the neutron multiplicity distribution.
Keywords:forward neutrons; zero degree calorimetry; centrality; heavy ions
1. Introduction
Very forward (|η| > 8.5) neutrons are produced in hadron-nucleus and heavy ion collisions.
The main physics processes involved are intranuclear cascades [1], nuclear evaporation [2], and nuclear resonances, like the giant dipole resonance [3]. The information gathered from the observation of these neutrons can be used to tag ultraperipheral collisions, calculate the event plane and estimate centrality in heavy ion and hadron-nucleus collisions. Cascade and evaporation nucleons were observed and studied by a wide range of fix target experiments [4]. Ultraperipheral collisions accompanied by nuclear resonances were studied by the STAR Collaboration at RHIC [5,6]. In the ALICE experiments at LHC cascade and evaporation neutrons are used for the estimation of centrality [7,8]. The energy spectrum of very forward neutrons produced in proton-proton collisions was measured by the LHCf experiment [9,10]. In the CMS experiment these neutrons can be observed by the Zero Degree Calorimeters (ZDC). The most important models, which include forward neutron production are DPMJet [2], URQMD [11], Geant4 [12,13], SMASH [14], JAM [15], and PHSD [16].
2. The Zero Degree Calorimeter of CMS Experiment
The two ZDCs are located in the neutral particle absorber (TAN), roughly±140 m away from the CMS interaction point, between the two beampipes. They measure neutral particles at pseudorapidity values|η|>8.5, as the charged products are removed by dipole magnets located between the central
CMS detectors and the ZDCs. They are Cherenkov sampling calorimeters consisted of cladded quartz fibers and tungsten plates. They have three different sections (Figure1): the electromagnetic (EM) section, the hadron (HAD) section, and the reaction plane detector (RPD). The EM section is 19 radiation lengths long, which is equal to one interaction length and has five transverse segments. The RPD is a 4×4 array of quartz tiles and is used to determine the event plane for flow measurements in heavy ion collisions. The HAD section is 5.6 hadronic interaction length and has four longitudinal segments. The plates in the HAD section are tilted by 45◦to maximize the light yield of the fibers. This paper presents results using the EM and HAD sections of the ZDC detector on the lead going side (z<0)
measured in pPb collisions at the CMS experiment in 2016. A more detailed description of the ZDC detectors can be found in references [17–20].
HAD section
EM section tungsten plates
fibers light guides
PMTs
Figure 1. The side view of the CMS Zero Degree Calorimeter (left) and the segmentation of each
sections (right) [21].
Every channel of the detector is read out in 10 timeslices (denoted with TS0 – TS9), each 25 ns long. The main signal arrives in TS4 as shown in the left panel of Figure2. The bunch spacing in the 2016 pPb datataking was 100 ns, so additional collisions may happen four timeslice before or after the primary signal (out-of-time pileup). The signal valueQifor a certainichannel is extracted as:
Qi =Qi,TS3−
1
2(Qi,TS2+Qi,TS6), (1)
whereQi,TSXis the signal value in theXth timeslice for channeli. The second term is used to subtract
contribution from pedestal and the tail of out-of-time pileup events.
TS [25 ns]
0 1 2 3 4 5 6 7 8 9
Q [fC]
0 1000 2000 3000 4000 5000
6000 HAD1
pPb 8.16 TeV CMSPreliminary
R
0 5 10 15 20 25 30
Entries
0 50 100 150 200 250 300
HAD2
pPb 8.16 TeV
CMS
Preliminary
Figure 2.The time dependence of the Zero Degree Calorimeters (ZDC) signal (left) and the distribution of TS4 and TS5 signal ratio (right) [21].
R= Qi,TS3−
1
2(Qi,TS2+Qi,TS6)
Qi,TS4−12(Qi,TS2+Qi,TS6)
, (2)
which is shown in the right panel of Figure2. The value ofhRiis calculated from the mean of this distribution. This method ensures that both the resolution remains good for the low-energy signals and the whole energy range of the detector can be used.
3. Calibration
The relative gains of the different channels are matched (intercalibrated) by using distributions of signal ratios between different channels. These are compared to the same distributions from the 2010 PbPb data collection period, following the test beam calibration of ZDCs. An example of two such distributions is shown in Figure3.
0.2 0.4 0.6 0.8 1 1.2 1.4 1.6 1.8 2
3
10
4
10
5
10 HAD3/HAD1 Run 152642 TS678 Centrality=0-39
CMS Preliminary PbPb 2.76 TeV
Counts
HAD3/HAD1 HAD3/HAD1
0 0.5 1 1.5 2 2.5 3 3.5 4 4.5 5
Entries
3
10
4
10
5
10
6
10
7
10
pPb 8.16 TeV CMS
Preliminary
Figure 3. Comparison of signal ratio distributions between 2.76 TeV PbPb (left) and 8.16 TeV pPb
collisions (right) [21].
The low energy part of the total ZDC signal distribution is shown in Figure4. Since the slow neutrons are close to being monoenergetic, the peaks correspond to events with single, double, and triple neutrons. The widths of the peaks are due to the slight variation in the neutron energy and the finite resolution of the detector. The spectrum is fitted with the sum of Gaussian shapes, with the n-neutron peak positionµnand widthσnconstrained as:
µn =nµ1, (3)
σn2=nσ12, (4)
whereµ1andσ1are the position and width of the single neutron peak respectively. The results from
ZDC signal [au.]
0 50 100 150 200 250 300 350 400 450 500
Events
0 2000 4000 6000 8000 10000 12000 14000 16000 18000
20000 Data, run: 286178 Sum of Gaussians:
0 µ
= n
n µ
0 σ
n =
n σ
pPb 8.16 TeV
CMS
Preliminary
Figure 4.The low end of ZDC signal distribution. The peaks correspond to events with one, two and
three neutrons detected by the ZDC respectively. The position of the first peak corresponds to 2.56 TeV, the energy of nucleons in the Pb ion for 8.16 TeV pPb collisions [21].
4. Pileup Correction
The ZDC energy spectrum is shown in Figure5for two different data collection periods with different average number of collisions in a single event (pileup). An important feature of these spectra is a shoulder at high energies, which is larger in the data set with a larger pileup. It is caused by pileup collisions. This effect is corrected by the following mathematical procedure, based on the compound Poisson distribution.
Assuming thatnis the number of simultaneous pPb collisions in a single event and it follows a Poisson distribution:
pn = µ n
n! e−µ
1−e−µ, (5)
where only then>0 case is considered, therefore 1−e−µis included in the denominator to ensure the
normalization of the above expression.µis the average number of collisions in an event, that provide
at least one neutron in the ZDC. The ZDC energy deposit is described by a random variableX:
X=
n
∑
i=1
Yi, (6)
whereYi is the random variable describing ZDC energy deposit for an event with single collision.
The probability density functions ofYi andXare denoted byg(x)and f(x)respectively. The f(x)
function can be expressed as:
f(x) =g(x)p1+ (g∗g)(x)p2+ (g∗g∗g)(x)p3+. . . , (7)
where the∗operation stands for convolution. Then using Fourier transform and the convolution theorem one may write:
ZDC signal [au.]
0 2000 4000 6000 8000 10000 12000
Events 1 10 2 10 3 10 4 10 Run: 286200 0.3 ≈ 〉 µ 〈
pPb 8.16 TeV
CMS
Preliminary
ZDC signal [au.]
0 2000 4000 6000 8000 10000 12000
Events 1 10 2 10 3 10 4 10 5 10 Run: 286314 0.1 ≈ 〉 µ 〈
pPb 8.16 TeV
CMS
Preliminary
Figure 5. ZDC energy distribution in data sets with average number of collisions 0.3 (left) and 0.1
(right) [21].
After substituting the definition of pn into the equation above, the infinite series becomes a
geometrical series and can be summed up to:
Ff = e
−µ
1−e−µ
eµFg−1. (9)
By rearranging this equation, it is possible to expressg(x)as:
g(x) =F−1
1
µlog[(e
µ−1)Ff+1]
, (10)
providing a formula to calculate the pileup corrected distribution.
The result of this calculation is shown at three differentµvalues in Figure6. As it is expected
the shoulder at high energies disappeared. The method gives a similar result when the value ofµis
varied; there is only a moderate variation in the tail of the distributions.
ZDC signal [a.u.]
0 2000 4000 6000 8000
Probability 5 − 10 4 − 10 3 − 10 2 − 10 Uncorrected = 0.16 µ Corrected, = 0.18 µ Corrected, = 0.2 µ Corrected,
pPb 8.16 TeV
CMS
Preliminary
Figure 6.Pileup correction results with Fourier deconvolution method with differentµvalues assumed
5. Using ZDC as a Centrality Estimator in pPb Collisions
The typical quantities used to estimate centrality in heavy ion collisions, such as the multiplicity of charged particles, cannot be used in hadron-nucleus collisions, since they are only loosely correlated with the quantitiesNcollandNpart. A good alternative is to use the very forward energy to estimate
centrality, since it is correlated with the number of spectator nucleons. The centrality percentiles, calculated from the corrected energy distribution, are shown in Figure7. For a proper usage of this zero degree energy as a centrality estimator in a physics measurement, a model of spectator neutron production is needed, which connects the zero degree energy withNcollandNpart. The current models
are not valid in the LHC collision energies [1,2,4,12], therefore results from ZDC detectors give a useful input for the development of these models.
ZDC signal [au.]
0 1000 2000 3000 4000
Events
2 −
10
1 −
10 1 10
2
10
3
10
4
10
5
10
6
10
0-5 %
5-10 %
10-20 %
20-40 %
40-60 %
60-80 %
80-100 %
pPb 8.16 TeV
CMS
Preliminary
Figure 7.Centrality classes based on ZDC energy [21].
6. Unfolding Neutron Multiplicity Distribution
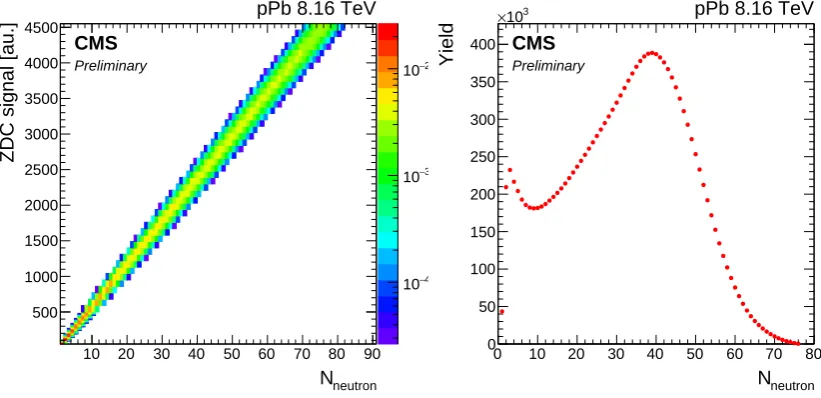
From the fits in Section3, neutron multiplicity distribution can be calculated for events where only a few neutrons are produced. But the fit cannot be extended to the larger ZDC energy range, as the Gaussian distributions would overlap causing rapid oscillation of the amplitudes. This problem can be circumvented by constraining the amplitude values to change smoothly with the neutron number. This property is achieved by considering the calculation as an unfolding problem. The ZDC response is calculated for N-neutron events and a response matrixRis constructed (left panel of Figure8), assuming the linearity of the detector. Using the response matrix, the original fit can be performed by minimalizing aχ2term. The smoothness of the neutron number distribution is ensured
by a linear regularization term (Tikhonov regularization [23]), which requires the first derivative of the distribution to be small. The fullχ2term to minimalize is:
χ2= (R·n−e)TV−1(R·n−e) +λ(D·n)2, (11)
wheren ande are vectors, whose elements represent the unknown neutron distribution and the measured ZDC spectrum respectively,Vis the covariance matrix ofe,Dis the first derivative matrix andλis the regularization strength.
The optimal solution is calculated by taking the derivative of the above equation, with respect to n. The derivative can be rearranged into the form of linear system of equations:
The optimalnis calculated from this expression using the LU decomposition method.
The result of this calculation is shown in the right panel of Figure8. This result serves as a strong constraint and may challenge the models of hadron-nucleus collisions and spectator neutron production [2,11–16].
neutron
N
10 20 30 40 50 60 70 80 90
ZDC signal [au.]
500 1000 1500 2000 2500 3000 3500 4000 4500
4 −
10
3 −
10
2 −
10
pPb 8.16 TeV
CMS
Preliminary
neutron
N
0 10 20 30 40 50 60 70 80
Yield
0 50 100 150 200 250 300 350 400
3
10
× pPb 8.16 TeV
CMS
Preliminary
Figure 8.Response matrix (left) and the unfolded neutron multiplicity distribution (right). [21]
7. Conclusions
Very forward neutrons are produced in hadron-nucleus and heavy ion collisions via intranuclear cascades, evaporation and nuclear resonances. In the CMS experiment they are observed by the ZDCs. The individual channels of ZDCs in 2016 were gain matched using data collected in 2010. Peaks are observed in the ZDC energy spectrum, which correspond to events with one, two and three nearly monoenergetic spectator neutrons. This provides an opportunity to calibrate the detector and measure the resolution, which is 24%. The pileup effects are corrected using a Fourier deconvolution method. As the very forward energy is suitable to be a centrality estimator, the corrected ZDC energy distribution is used to calculate centrality percentiles. The neutron multiplicity distribution can be unfolded using Tikhonov regularization and the results serve as a constraint for the theoretical nuclear break-up models.
Funding: The CMS Zero Degree Calorimeter detector is supported by the Office of Science, US Department
of Energy. This research is supported by the ÚNKP-19-3 New National Excellence Program of the Ministry for Innovation and Technology, the National Research, Development and Innovation Office of Hungary (K 124845, K 128713, and K 128786) and the Hungarian Academy of Sciences ”Lendület” (Momentum) Program (LP 2015-7/2015).
Conflicts of Interest:The author declares no conflict of interest. The funders had no role in the design of the study; in the collection, analyses, or interpretation of data; in the writing of the manuscript, or in the decision to publish the results.
References
1. Cugnon, J.; Volant, C.; Vuillier, S. Improved intranuclear cascade model for nucleon-nucleus interactions.
Nucl. Phys. A1997,620, 475. [CrossRef]
2. Ferrari, A.; Sala, P.R.; Ranft, J.; Roesler, S. Cascade particles, nuclear evaporation, and residual nuclei in high-energy hadron-nucleus interactions.Z. Phys. C Part. Fields1996,C70, 413. [CrossRef]
3. Berman, B.L.; Fultz, S.C. Measurements of the giant dipole resonance with monoenergetic photons.
4. Sikler, F. Centrality Control of Hadron Nucleus Interactions by Detection of Slow Nucleons. Available online: https://arxiv.org/abs/hep-ph/0304065(accessed on 5 October 2019).
5. Adler, C.; et al. [STAR Collaboration]. Coherentρ0 production in ultraperipheral heavy ion collisions.
Phys. Rev. Lett.2002,89, 272302. [CrossRef] [PubMed]
6. Adams, J.; et al. [STAR Collaboration]. Production of e+e−pairs accompanied by nuclear dissociation in ultra-peripheral heavy ion collision. Phys. Rev. C2004,70, 031902. [CrossRef]
7. Abelev, B.; et al. [STAR Collaboration]. Centrality determination of Pb-Pb collisions at√sNN= 2.76 TeV
with ALICE.Phys. Rev. C2013,88, 044909. [CrossRef]
8. Adam, J.; et al. [ALICE Collaboration]. Centrality dependence of particle production in p-Pb collisions at √
sNN= 5.02 TeV.Phys. Rev. C2015,91, 064905. [CrossRef]
9. Adriani, O.; Berti, E.; Bonechi, L.; Bongi, M.; Castellini, G.; D’Alessandro, R.; Del Prete, M.; Haguenauer, M.; Itow, Y.; Kasahara, K.; et al. Measurement of very forward neutron energy spectra for 7 TeV proton–proton collisions at the Large Hadron Collider. Phys. Lett. B2015,750, 360. [CrossRef]
10. Ueno, M. Zero degree neutron energy spectra measured by the LHCf at√s= 13 TeV proton-proton collision.
PoS2018,ICRC2017, 322.
11. Bass, S.A.; Belkacem, M.; Bleicher, M.; Brandstetter, M.; Bravina, L.; Ernst, C.; Gerland, L.; Hofmann, M.; Hofmann, S.; Konopka, J.; et al. Microscopic models for ultrarelativistic heavy ion collisions. Prog. Part. Nucl. Phys.1998,41, 255. [CrossRef]
12. Galoyan, A.; Ribon, A.; Uzhinsky, V. Simulation of neutron production in hadron-nucleus and nucleus-nucleus interactions in Geant4. In Proceedings of the 24th International Baldin Seminar on High Energy Physics Problems: Relativistic Nuclear Physics and Quantum Chromodynamics (ISHEPP 2018) Dubna, Russia, 17–22 September 2018.
13. Allison, J.; Amakoca, K.; Apostolakisd, J.; Arcee, P.; Asaif, M.; Asog, T.; Baglih, E.; Bagulyai, A.; Banerjeej, S.; Barrand, G.; et al. Recent developments in Geant4. Nucl. Instrum. Meth. A2016,835, 186. [CrossRef] 14. Weil, J.; Steinberg, V.; Staudenmaier, J.; Pang, L.G.; Oliinychenko, D.; Mohs, J.; Kretz, M.; Kehrenberg, T.;
Goldschmidt, A.; Bäuchle, B.; et al. Particle production and equilibrium properties within a new hadron transport approach for heavy-ion collisions. Phys. Rev.2016,C94, 054905. [CrossRef]
15. Nara, Y.; Otuka, N.; Ohnishi, A.; Niita, K.; Chiba, S. Study of relativistic nuclear collisions at AGS energies from p + Be to Au + Au with hadronic cascade model. Phys. Rev. C2000,61, 024901. [CrossRef]
16. Cassing, W.; Bratkovskaya, E.L. Parton transport and hadronization from the dynamical quasiparticle point of view.Phys. Rev.2008,C78, 034919. [CrossRef]
17. Grachov, O.A.; Murray, M.J.; Ayan, A.S.; Debbins, P.; Norbeck, E.; Onel, Y.; d’Enterria, D.G. Status of zero degree calorimeter for CMS experiment.AIP Conf. Proc.2006,867, 258.
18. Grachov, O.A.; Grachov, O.A.; Metzler, B.; Murray, M.; Snyder, J.; Stiles, L.; Wood, J.; Zhukova, V.; Beaumont, W.; Ochesanu, S.; et al. Measuring photons and neutrons at zero degrees in CMS. Int. J. Mod. Phys. E2007,16, 2137. [CrossRef]
19. Grachov, O.A.; Murray, M.; Snyder, S.; Wood, J.; Zhukova, V.; Ayan, A.S.; Debbins, P.; Ingram,D.F.; Norbeck, E.; Onel, Y.; et al. Performance of the combined zero degree calorimeter for CMS. J. Phys. Conf. Ser.2009,160, 012059. [CrossRef]
20. Grachov, O.; Murray, M.; Wood, J.; Onel, Y.; Sen, S.; Yetkin, T. Commissioning of the CMS zero degree calorimeter using LHC beam.J. Phys. Conf. Ser.2011,293, 012040. [CrossRef]
21. CMS Collaboration.The Performance of CMS ZDC Detector in 2016; CMS Detector Performance Summary; CMS-DP-2018-025; CMS Collaboration: 2017. Available online:https://cds.cern.ch/record/2621978?ln=en (accessed on 9 October 2019).
22. Jowett, J.M. The LHC as a Nucleus-Nucleus Collider. J. Phys. G2008,35, 104028. [CrossRef]
23. Tikhonov, A.N. Solution of incorrectly formulated problems and the regularization method. Soviet Math.
1963,4, 1035.
c
![Figure 1. The side view of the CMS Zero Degree Calorimeter (left) and the segmentation of eachsections (right) [21].](https://thumb-us.123doks.com/thumbv2/123dok_us/9702020.1497856/2.595.83.515.464.664/figure-view-zero-degree-calorimeter-segmentation-eachsections-right.webp)
![Figure 3. Comparison of signal ratio distributions between 2.76 TeV PbPb (left) and 8.16 TeV pPbcollisions (right) [21].](https://thumb-us.123doks.com/thumbv2/123dok_us/9702020.1497856/3.595.99.499.292.454/figure-comparison-signal-ratio-distributions-pbpb-ppbcollisions-right.webp)

![Figure 5. ZDC energy distribution in data sets with average number of collisions 0.3 ((left) and 0.1right) [21].](https://thumb-us.123doks.com/thumbv2/123dok_us/9702020.1497856/5.595.192.386.545.737/figure-zdc-energy-distribution-average-number-collisions-right.webp)
![Figure 7. Centrality classes based on ZDC energy [21].](https://thumb-us.123doks.com/thumbv2/123dok_us/9702020.1497856/6.595.193.384.252.446/figure-centrality-classes-based-zdc-energy.webp)