R E S E A R C H A R T I C L E
Open Access
Insulin resistance and systemic metabolic
changes in oral glucose tolerance test in
5340 individuals: an interventional study
Qin Wang
1,2,3,4*, Jari Jokelainen
3,5, Juha Auvinen
3,6, Katri Puukka
7, Sirkka Keinänen-Kiukaanniemi
3,5,8,9,
Marjo-Riitta Järvelin
3,4,5,10,11, Johannes Kettunen
1,3,4,12†, Ville-Petteri Mäkinen
13,14†and
Mika Ala-Korpela
1,2,3,4,15,16,17,18*†Abstract
Background:Insulin resistance (IR) is predictive for type 2 diabetes and associated with various metabolic abnormalities in fasting conditions. However, limited data are available on how IR affects metabolic responses in a non-fasting setting, yet this is the state people are mostly exposed to during waking hours in the modern society. Here, we aim to comprehensively characterise the metabolic changes in response to an oral glucose test (OGTT) and assess the associations of these changes with IR.
Methods:Blood samples were obtained at 0 (fasting baseline, right before glucose ingestion), 30, 60, and 120 min during the OGTT. Seventy-eight metabolic measures were analysed at each time point for a discovery cohort of 4745 middle-aged Finnish individuals and a replication cohort of 595 senior Finnish participants. We assessed the metabolic changes in response to glucose ingestion (percentage change in relative to fasting baseline) across the four time points and further compared the response profile between five groups with different levels of IR and glucose intolerance. Further, the differences were tested for covariate adjustment, including gender, body mass index, systolic blood pressure, fasting, and 2-h glucose levels. The groups were defined as insulin sensitive with normal glucose (IS-NGT), insulin resistant with normal glucose (IR-NGT), impaired fasting glucose (IFG), impaired glucose tolerance (IGT), and new diabetes (NDM). IS-NGT and IR-NGT were defined as the first and fourth quartile of fasting insulin in NGT individuals.
Results:Glucose ingestion induced multiple metabolic responses, including increased glycolysis intermediates and decreased branched-chain amino acids, ketone bodies, glycerol, and triglycerides. The IR-NGT subgroup showed smaller responses for these measures (mean + 23%, interquartile 9–34% at 120 min) compared to IS-NGT (34%, 23–44%,P< 0.0006 for difference, corrected for multiple testing). Notably, the three groups with glucose abnormality (IFG, IGT, and NDM) showed similar metabolic dysregulations as those of IR-NGT. The difference between the IS-NGT and the other subgroups was largely explained by fasting insulin, but not fasting or 2 h glucose. The findings were consistent after covariate adjustment and between the discovery and replication cohort.
Conclusions:Insulin-resistant non-diabetic individuals are exposed to a similar adverse postprandial metabolic milieu, and analogous cardiometabolic risk, as those with type 2 diabetes. The wide range of metabolic abnormalities associated with IR highlights the necessity of diabetes diagnostics and clinical care beyond glucose management.
Keywords:Insulin resistance, Metabolic profiling, Oral glucose tolerance test, Impaired glucose tolerance, Impaired fasting glucose, Type 2 diabetes
© The Author(s). 2019Open AccessThis article is distributed under the terms of the Creative Commons Attribution 4.0 International License (http://creativecommons.org/licenses/by/4.0/), which permits unrestricted use, distribution, and reproduction in any medium, provided you give appropriate credit to the original author(s) and the source, provide a link to the Creative Commons license, and indicate if changes were made. The Creative Commons Public Domain Dedication waiver (http://creativecommons.org/publicdomain/zero/1.0/) applies to the data made available in this article, unless otherwise stated. * Correspondence:qin.wang@baker.edu.au;mika.ala-korpela@baker.edu.au
†Johannes Kettunen, Ville-Petteri Mäkinen, and Mika Ala-Korpela are joint
senior authors.
1Computational Medicine, Faculty of Medicine, University of Oulu, Oulu, Finland
Background
Diabetes affects approximately 1 in 11 adults worldwide, and people with diabetes are at a twofold excess risk for cardiovascular disease (CVD) [1, 2]. A decline in insulin sensitivity is an early sign of susceptibility to type 2 diabetes, typically manifested as elevated levels of fasting insulin [3]. Insulin is a key regulator of glucose metabolism by promot-ing glucose uptake in peripheral tissues and inhibitpromot-ing glu-cose production in the liver [4]. Insufficient insulin action results in increased fasting glucose and eventually leads to overt type 2 diabetes [4]. Insulin resistance (IR) is also linked to the development of cardiometabolic complica-tions, the risk arising already prior to the onset of type 2 diabetes [5,6]. Studies in the fasting state have identified a cluster of biomarkers robustly associated with IR and pre-disposing to increased risk for CVD [3,5,6]. In the modern society, however, people spend most of their waking hours at a postprandial state, yet we are not aware of epidemio-logical studies on non-fasting metabolism in representative cohorts.
An oral glucose tolerance test (OGTT) assesses an in-dividual’s ability to clear circulating glucose after an in-gestion of a 75-g glucose bolus taken after an overnight fast. An OGTT induces a transition from fasting to feed-ing, and subsequent changes in various metabolic nutri-ents occur as the body makes adjustmnutri-ents to achieve glucose homeostasis [7]. It is thus feasible to expect that individuals with impaired insulin action are likely to dis-play a widespread systemic abnormality beyond glucose. Although the dynamics of insulin and glucose during an OGTT in both healthy and insulin-resistant individuals are well studied [8,9], much less is known on other, par-ticularly emerging cardiometabolic biomarkers, for ex-ample, lipoprotein lipid profiles, amino acids, ketone bodies, and inflammatory markers [10,11].
Metabolic profiling, simultaneously measuring mul-tiple metabolic measures, has been frequently used in studying metabolic dysregulations in the fasting state. Previous studies have revealed that higher fasting ketone bodies, branched-chain amino acids, and aromatic amino acids are predictive for future type 2 diabetes [10, 12]. Similarly, higher concentration of very-low-density lipo-protein (VLDL) particles and increased triglycerides are associated with higher risk of cardiovascular diseases [13]. In particular, recent genetic studies have suggested that disturbed branched-chain amino acid metabolism and increased triglycerides are on the causal path of car-diometabolic diseases [14, 15]. Metabolic profiling has also been applied to assess the metabolic changes during OGTT in small studies. For example, amino acids, ke-tone bodies, and triglycerides are decreased during an OGTT and some of these changes seem to be blunted in obese and insulin-resistant individuals [7, 16–21]. How-ever, all these studies have been limited in their sample
size (up to a few hundred individuals) and often spanned only two time points (pre- and post-OGTT).
In this study, we performed an OGTT across 4 time points and quantified 78 metabolic measures for a total of 5340 individuals (over 21,000 serum samples) from 2 independent population-based cohorts. Our aims were (1) to comprehensively characterise systemic metabolic responses to oral glucose in large scale and (2) to inves-tigate how insulin resistance is associated with postpran-dial metabolic dysregulation across multiple clinical categories of glucose intolerance. To our knowledge, this is the first population-based large-scale metabolomics time-series study of an OGTT, providing new insights into the metabolic consequences of insulin resistance in non-fasting conditions.
Methods
Study population
The Northern Finland Birth Cohort 1966 (NFBC66) was initiated to study factors affecting preterm birth and subsequent morbidity in the two northernmost prov-inces in Finland [22]. It included 12,058 children born alive, comprising 96% of all births during 1966 in the re-gion. The participants were further followed up at the age of 1, 14, 31, and 46 years. Data collection conducted in 2012 at their age of 46, including clinical examination and serum sampling, was available for 5839 individuals. Among them, 4745 study participants, who were free of prior diagnosed diabetes, underwent metabolic profiling of OGTT serum samples (97% had 4 time points), and had information on baseline fasting insulin and glucose, were used in this study.
The Oulu1945 cohort studies ageing populations in Oulu, Finland. It was started in 2000 and was originally comprised of 1400 individuals born in 1945. In the follow-up study conducted in 2015, data collection in-cluding clinical examination and serum sampling was available for 717 participants. Among them, 595 partici-pants who were free of prior diagnosed diabetes, under-went metabolic profiling of OGTT samples (92% had 4 time points), and had data on baseline fasting insulin and glucose were included.
Clinical assessment
Subjects underwent a 2-h, 75-g OGTT after an over-night fasting. Blood samples were obtained at 0 (fasting baseline, right before glucose ingestion), 30, 60, and 120 min during the OGTT. Plasma glucose were analysed by an enzymatic dehydrogenase method (Advia 1800, Sie-mens Healthcare Diagnostics, Tarrytown, NY, USA) and serum insulin by a chemiluminometric immunoassay (Advia Centaur XP, Siemens Healthcare Diagnostics, Tarrytown, NY, USA). Insulin resistance was estimated by fasting insulin, homeostasis model assessment of
insulin resistance (HOMA-IR), and insulin sensitivity index-Matsuda (ISI-Matsuda). First-phase insulin secre-tion, an index of beta-cell funcsecre-tion, was measured by insulinogenic index. The formulas for these models are shown in the legend for Table1.
According to an individual’s insulin resistance status and the American Diabetes association 2003 criteria [8], participants were classified into five groups (Table 1, Fig.1, and Additional file1: Table S1):
1) Insulin-sensitive subgroup of normal glucose tolerance (IS-NGT, fasting insulin at the bottom quartile of NGT and fasting glucose < 5.6 mmol/L and 2-h glucose < 7.8 mmol/L)
2) Insulin-resistant subgroup of normal glucose tolerance (IR-NGT, fasting insulin at the top quartile of NGT and fasting glucose < 5.6 mmol/L and 2-h glucose < 7.8 mmol/L)
3) Impaired fasting glucose (IFG, fasting glucose between 5.6 and 6.9 mmol/L and 2-h glucose < 7.8 mmol/L)
4) Impaired glucose tolerance (IGT, fasting glucose≤ 6.9 mmol/L and 2-h glucose between 7.8 and 11.0 mmol/L)
5) New onset of type 2 diabetes (NDM, fasting glucose
≥7.0 mmol/L or 2-h glucose≥11.1 mmol/L)
Metabolic profiling
The human serum metabolome is dominated by hydrophobic lipid-like molecules, including diglycer-ides, triglycerdiglycer-ides, phospholipids, fatty acids, steroids, and steroid derivatives [23]. These lipids are packed in various lipoprotein particles, e.g. VLDL, intermediate-density lipoprotein (IDL), low-intermediate-density lipoprotein (LDL), and high-density lipoprotein (HDL). Other me-tabolites found in high abundance in serum include amino acids, glucose, lactate, and several waste or catabolic by-products, such as urea and creatinine [23]. Here, a nuclear magnetic resonance (NMR) spec-troscopy metabolomics platform was used to measure all the detectable lipids and metabolites in a non-selective way. The high-throughput NMR metabolo-mics platform was applied to quantify over 200 lipid and metabolite measures from serum samples col-lected at 0, 30, 60, and 120 min during an OGTT chal-lenge. The platform applies a single experimental setup, which allows for simultaneous quantification of standard clinical lipids, 14 lipoprotein subclasses, and individual lipids (triglycerides, phospholipids, free and esterified cholesterol) transported by these particles, multiple fatty acids, glucose and various glycolysis pre-cursors, ketone bodies, and amino acids in absolute concentration units [24–26]. As the total lipids and
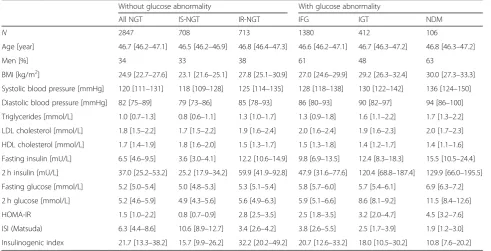
Table 1Characteristics of the Northern Finland Birth Cohort 1966
Without glucose abnormality With glucose abnormality
All NGT IS-NGT IR-NGT IFG IGT NDM
N 2847 708 713 1380 412 106
Age [year] 46.7 [46.2–47.1] 46.5 [46.2–46.9] 46.8 [46.4–47.3] 46.6 [46.2–47.1] 46.7 [46.3–47.2] 46.8 [46.3–47.2]
Men [%] 34 33 38 61 48 63
BMI [kg/m2] 24.9 [22.7–27.6] 23.1 [21.6–25.1] 27.8 [25.1–30.9] 27.0 [24.6–29.9] 29.2 [26.3–32.4] 30.0 [27.3–33.3] Systolic blood pressure [mmHg] 120 [111–131] 118 [109–128] 125 [114–135] 128 [118–138] 130 [122–142] 136 [124–150] Diastolic blood pressure [mmHg] 82 [75–89] 79 [73–86] 85 [78–93] 86 [80–93] 90 [82–97] 94 [86–100] Triglycerides [mmol/L] 1.0 [0.7–1.3] 0.8 [0.6–1.1] 1.3 [1.0–1.7] 1.3 [0.9–1.8] 1.6 [1.1–2.2] 1.7 [1.3–2.2] LDL cholesterol [mmol/L] 1.8 [1.5–2.2] 1.7 [1.5–2.2] 1.9 [1.6–2.4] 2.0 [1.6–2.4] 1.9 [1.6–2.3] 2.0 [1.7–2.3] HDL cholesterol [mmol/L] 1.7 [1.4–1.9] 1.8 [1.6–2.0] 1.5 [1.3–1.7] 1.5 [1.3–1.8] 1.4 [1.2–1.7] 1.4 [1.1–1.6] Fasting insulin [mU/L] 6.5 [4.6–9.5] 3.6 [3.0–4.1] 12.2 [10.6–14.9] 9.8 [6.9–13.5] 12.4 [8.3–18.3] 15.5 [10.5–24.4] 2 h insulin [mU/L] 37.0 [25.2–53.2] 25.2 [17.9–34.2] 59.9 [41.9–92.8] 47.9 [31.6–77.6] 120.4 [68.8–187.4] 129.9 [66.0–195.5] Fasting glucose [mmol/L] 5.2 [5.0–5.4] 5.0 [4.8–5.3] 5.3 [5.1–5.4] 5.8 [5.7–6.0] 5.7 [5.4–6.1] 6.9 [6.3–7.2] 2 h glucose [mmol/L] 5.2 [4.6–5.9] 4.9 [4.3–5.6] 5.6 [4.9–6.3] 5.9 [5.1–6.6] 8.6 [8.1–9.2] 11.5 [8.4–12.6] HOMA-IR 1.5 [1.0–2.2] 0.8 [0.7–0.9] 2.8 [2.5–3.5] 2.5 [1.8–3.5] 3.2 [2.0–4.7] 4.5 [3.2–7.6] ISI (Matsuda) 6.3 [4.4–8.6] 10.6 [8.9–12.7] 3.4 [2.6–4.2] 3.8 [2.6–5.5] 2.5 [1.7–3.9] 1.9 [1.2–3.0] Insulinogenic index 21.7 [13.3–38.2] 15.7 [9.9–26.2] 32.2 [20.2–49.2] 20.7 [12.6–33.2] 18.0 [10.5–30.2] 10.8 [7.6–20.2] Values are median [interquartile range]. Characteristics for the replication cohort Oulu45 is shown in Additional file1: Table S1
Abbreviations:BMIbody mass index,NGTnormal glucose tolerance,IFGisolated impaired fasting glucose,IGTisolated impaired glucose tolerance,NDMnew type 2 diabetes,IS-NGTinsulin-sensitive individuals within NGT (at the first quartile of fasting insulin within NGT),IR-NGTinsulin-resistant individuals within NGT (at the top quartile of fasting insulin within NGT)
HOMA-IR = fasting glucose (mmol/L) × fasting insulin (mIU/L)/22.5
individual lipids within the same lipoprotein subclass are highly correlated [27], we chose a priori to analyse the total lipids in the 14 subclasses and limit specific lipids for the 4 major fractions (VLDL, IDL, LDL, and HDL). These together with all the fatty acids and non-lipid measures provided by this platform, in total 77 measures, were used in the present study. A similar metabolic panel has been widely applied in previous studies [3,28,29].
Statistical analyses
In total, 78 metabolic measures were used in the ana-lyses. Of those, 77 were measured by NMR metabolo-mics and glucose by a clinical assay. Insulin was treated as an exposure in this study. All analyses were under-taken in the R programming environment (version 3.5.1). Primary analyses were conducted using NFBC66, and key results were replicated in Oulu1945.
To study the physiological response to an OGTT, metabolic trajectories for NGT individuals were re-ported. Metabolic trajectories were calculated as per-centage changes in relative to baseline concentration at 30, 60, and 120 min, respectively, e.g. (Concentra-tion120m−Concentration0m)/Concentration0m× 100%.
In the formula, metabolic concentrations are in their
original units, e.g. mmol/L. The significance of a change was evaluated via paired t test by comparing the metabolite concentration at post-load time points against the fasting baseline. The analyses were re-peated for men and women separately. Due to the cor-related nature of the metabolic measures, 19 principle components were able to explain 95% variation of the 78 measures; therefore, P< 0.05/19/4 = 0.0006 was considered statistically significant after correcting for multiple comparisons (corrected for 19 independent components and across 4 time points) [30,31].
To assess whether metabolic trajectories would be dif-ferent across the groups, two-way ANOVA was used, with metabolite change (%) as the response, time points × groups as the interaction term, and gender as the covari-ate. In total, 60 out of 78 measures showed significant interaction of time points and groups, suggesting the metabolic trajectories would be different between the groups for these measures (Additional file2: Table S2).t tests were further used to compare the metabolic trajec-tories between IR-NGT and IS-NGT across the 78 measures. For those metabolic measures that showed sig-nificant differences between IR-NGT and IS-NGT, we fur-ther assessed their differences between IR-NGT and those with IGT or NDM.
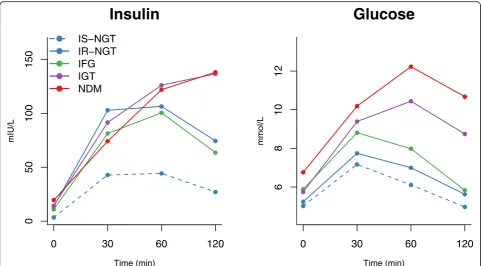
Fig. 1Mean concentration of insulin and glucose at 0, 30, 60, and 120 min during an oral glucose tolerance test. Insulin and glucose trajectories for insulin-sensitive subgroup of normal glucose tolerance (IS-NGT, dashed blue,n= 708), insulin-resistant subgroup of normal glucose tolerance (IR-NGT, solid blue,n= 713), impaired fasting glucose (IFG, green,n= 1380), impaired glucose tolerance (purple,n= 412), and newly-diagnosed type 2 diabetes (red, NDM,n= 106) are shown. IS-NGT was defined as the bottom quartile of fasting insulin within NGT, and IR-NGT was defined as the top quartile. The dots denote mean absolute concentrations. Interquartile ranges are listed in Table1
In addition, sensitivity analyses were conducted to assess the effect of potential covariates for those measures that showed significant differences between IR-NGT and IS-NGT. Linear regression models were used to quantify the metabolic differences between the groups, using 2-h change in metabolite concen-tration as the response variable and group category as the independent variable. Four sets of covariates were used: (1) sex, (2) sex + BMI + systolic blood pressure, (3) sex + baseline glucose + 2-h glucose, and (4) sex + fasting insulin. Metabolite concentra-tions at baseline and 2 h were log-transformed, and the changes between the baseline and 2 h were scaled to baseline SD.
Results
Two population cohorts were used to study the meta-bolic changes during an OGTT. The primary analyses were conducted in 4745 individuals in the NFBC66 (mean age 47 years, 44% men, Table1), and the key re-sults were replicated in 595 participants in the Oulu1945 (mean age 69 years, 41% men, Additional file 1: Table S1). Among the participants in the NFBC66, 60% of in-dividuals had normal fasting and 2-h glucose (NGT), 29% had impaired fasting glucose (IFG), and 11% had impaired 2-h glucose tolerance (IGT or NDM). Al-though NGT individuals are generally considered healthy, the IR-NGT subgroup had over 3 times higher fasting insulin than the IS-NGT. After glucose ingestion, these insulresistant individuals secreted even more in-sulin in the early phase (30 min), yet they were still un-able to restore glucose levels back to the pre-OGTT levels after 2 h (Table 1 and Fig. 1). The IR-NGT indi-viduals were also more likely to be male and had higher BMI, blood pressure, and fasting triglycerides and lower HDL cholesterol (Table 1). Similar characteristics were observed for IFG, IGT, and NDM, and their fasting insu-lin levels were comparable to IR-NGT, ranging from 2.7 to 4.3 times more than IS-NGT.
Metabolic trajectories under normal glucose tolerance Selected responses to an OGTT for the NGT individ-uals are summarised in Fig. 2 (P< 0.0006 at any time point), and results for all measures are available in Additional file 1: Figure S1 and Additional file 2: Table S3. During the OGTT, glycolysis-related meta-bolic measures (pyruvate and lactate) were primarily increased during 30 and 60 min (peaking at 60 min with 49% [interquartile 19%, 74%] and 31% [14%, 47%], respectively), lagging approximately 30 min be-hind the glucose rise (Fig. 2a). A smaller increase was seen with citrate (peaking with 7% [−2%, 15%] at 30 min). On the other hand, ketone bodies beta-hydroxybutyrate and acetoacetate were continuously
reduced after glucose ingestion and lowered by 26% (8%, 42%) and 41% (29%, 56%) at 120 min, respect-ively. Similarly, almost all amino acids were decreased during the OGTT, except for alanine (Fig. 2b). Branched-chain (isoleucine, leucine, and valine) and aromatic amino acids (phenylalanine and tyrosine) were decreased (15 to 45%) more than the other amino acids (6 to 10%) at 120 min. Acetate and glycerol were decreased throughout the OGTT and reduced by 24% (16%, 33%) and 39% (25%, 55%) at 120 min, respectively (Fig. 2c). Changes in lipids and fatty acids were generally smaller in comparison to the aforementioned non-lipid measures (Fig. 2 and Additional file 1: Figure S1A). The largest changes in lipids were seen for the total lipids in extremely large, very large, large, and medium VLDL particles, with 11 to 32% reduction at 120 min, after initial increases at 60 min (e.g. large VLDL in Fig. 2c). All HDL sub-class measures were suppressed during the OGTT, with a 2 to 9% decrease at 120 min (e.g. very large HDL in Fig. 2c). Interestingly, circulating triglycerides in all main lipoprotein particles, VLDL, IDL, LDL, and HDL, were decreased at 120 min (1 to 11%, e.g. VLDL-TG and HDL-TG in Fig. 2c). Inconsistent and small changes were seen in the corresponding choles-terol concentrations (see Additional file 1: Figure S1A for details).
Metabolic trajectories under insulin resistance
Fig. 2Selected metabolic changes in response to an oral glucose tolerance test in individuals with normal glucose tolerance. The dots and error bars denote mean percent change and 95%CI. Percent change is defined as the absolute change in relative to baseline.aGlycolysis-related and ketone bodies.bAmino acids.cLipoprotein lipids and others
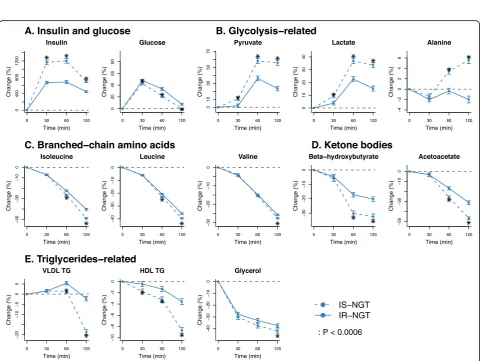
Fig. 3Metabolic trajectoires compared between insulin-resistant and insulin-sensitive individuals in the normal glucose tolerance group. IS-NGT, indiviudals with normal glucose tolerance and in the first quartile of fasting insulin (n= 708); IR-NGT, individuals with normal glucose tolerance and in the top quartile of fasting insulin (n= 713). The dots and error bars denote mean percentage changes and 95% confidence intervals, respectively. The asterisk denotes that there are signficiant differences between IS-NGT and IR-NGT at corresponding time point.aInsulin and glucose.bGlycolysis-related.cBranched-chain amino acids.dKetone bodies.eTriglycerides-related
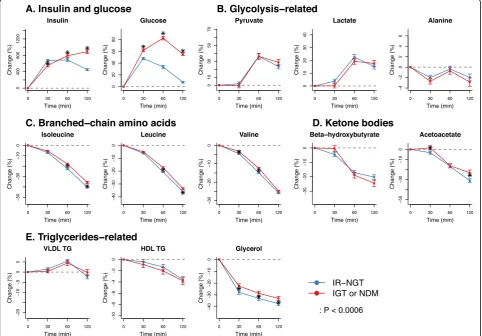
Metabolic trajectories under prediabetes and diabetes Figure4 (Additional file 2: Table S5) presents the com-parison of the metabolic trajectories in individuals with 2-h impaired glucose tolerance (IGT or NDM) and those of IR-NGT. Although large differences in glucose re-sponses were observed by definition, these two groups showed marginal differences in metabolic responses in glycolysis products, branched-chain amino acids, ketone bodies, and triglyceride-related measures (Fig. 4b–e). In addition, the IFG individuals who had normal 2-h glu-cose response but high fasting gluglu-cose (5.9 vs 5.2 mmol/ L in IFG and IR-NGT) also showed marginal differences in metabolic trajectories compared to those of IR-NGT (Additional file 1: Figure S5). The metabolic trajectories in percent change and absolute concentrations across all five individual groups (IS-NGT, IR-NGT, IFG, IGT, and NDM) are shown in Additional file1: Figures S6 and S7. Results corresponding to those shown in Figs. 2, 3, and 4 for the discovery cohort NFBC66 are replicated in the
Oulu1945 cohort (see Additional file1: Figure S8 for de-tailed results).
Metabolic responses associated with IR with or without glucose abnormality
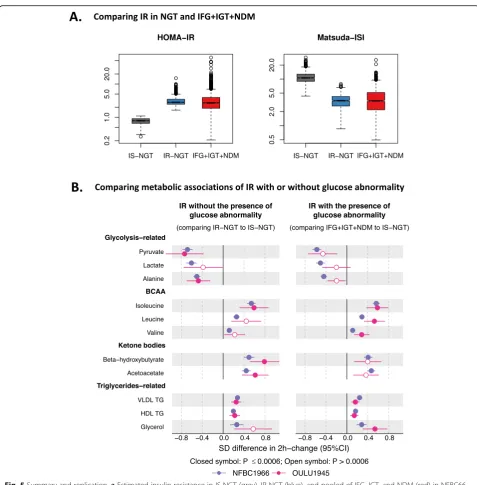
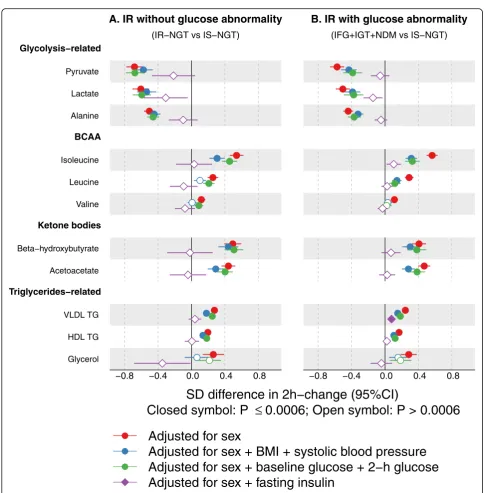
Figure 5a displays the distributions of insulin resistance measured by HOMA-IR and Matsuda index in individuals with IS-NGT, IR-NGT, and IFG + IGT + NDM. Despite the IFG + IGT + NDM group having impaired glucose metabol-ism by definition, these individuals together with the IR-NGT group showed comparable HOMA-IR and Matsuda indices. Interestingly, these two groups also showed similar differences in the 2-h metabolite responses when compared to the IS-NGT group (Fig. 5b). This was consistently ob-served in the two independent cohorts. The metabolic dif-ferences associated with IR-NGT and IFG + IGT + IGT remained the same or became slightly attenuated after adjusting for BMI, systolic blood pressure, baseline glucose, and 2-h glucose (Fig.6). By contrast, the associations were
substantially attenuated to almost null after adjusting for fasting insulin. Similar results were observed when IFG, IGT, and NDM were individually compared to IS-NGT with the adjustments (Additional file1: Figure S9).
Lastly, we observed distinctive patterns in fasting metabolic concentrations and the 2-h metabolite responses (Additional file 1: Figures S7 and S10).
Branched-chain amino acids and triglycerides in IR individuals were higher at baseline and exhibited less decrease at 2 h, compared to the IS-NGT group. Glycolysis-related measures were higher in IR individuals at baseline, but increased less at 2 h, whereas ketone bodies seemed to be lower at baseline, but decreased less at 2 h compared to the IS-NGT group.
Fig. 5Summary and replication.aEstimated insulin resistance in IS-NGT (grey), IR-NGT (blue), and pooled of IFG, IGT, and NDM (red) in NFBC66.
bTwo-hour metabolic responses associated with IR with or without glucose abnormality in NFBC66 (purple) and replicated in Oulu45 (red). Groups were compared by linear regression models with the 2-h concentration change as the response variable. Baseline and 2-h metabolite concentrations were log-transformed, and the changes between 2-h and baseline metabolite concentrations were scaled to baseline SD. Group sizes within NFBC66:n= 708 in IS-NGT,n= 713 in IR-NGT, andn= 1898 in combined IFG, IGT, and NDM. Group sizes within Oulu1945:n= 62 in IS-NGT,n= 64 in IR-NGT, andn= 343 in combined IFG, IGT, and NDM
Discussion
We profiled four time points of OGTT data for in total 5340 Finnish individuals from 2 independent co-horts to obtain new large-scale population-based in-formation on how insulin resistance is associated with a systemic post-load metabolic dysregulation. These changes include adverse modifications in multiple
cardiometabolic biomarkers suggesting that insulin re-sistance may underlie the shared susceptibility to dia-betes and CVD also in the post-load milieu. Our study is important because most people spend a significant amount of their daily lives in a postprandial state—this aspect of insulin resistance has not been captured in previous metabolomics studies of fasting samples. The
Fig. 6Group comparison adjusted for baseline factors in the NFBC66 cohort.aDifferences in 2-h changes between the IR-NGT (n= 713) and the IS-NGT group (n= 708).bDifferences in 2-h changes in the combined IFG, IGT, and NDM (n= 1898) and the IS-NGT group (n= 708). Groups were compared by linear regression models with the 2-h concentration change as the response variable. Baseline and 2-h metabolite concentrations were log-transformed, and the changes between 2-h and baseline metabolite concentrations were scaled to baseline SD. Insulin
results also carry practical significance: we found that IR-associated metabolic aberrations exist already in participants with normal glucose tolerance (with im-plications for CVD risk) and are similar in extent to those observed in type 2 diabetes.
The large sample size and multiple metabolomics time points allowed us to obtain accurate and systemic under-standing of the expected metabolic changes in response to glucose ingestion in people with normal glucose tolerance. Our temporal data on the 2-h changes were consistent with previous small studies with pre- and post-OGTT measures and support the known action of insulin in promoting gly-colysis metabolism (pyruvate and lactate) and suppression of ketogenesis (ketone bodies), proteolysis (amino acids), and lipolysis (glycerol) [4, 7, 18, 20]. Additionally, our results showed that glucose ingestion also reduces the circulating concentration of triglycerides in VLDL particles after the ini-tial increase during the first 60 min. This may reflect a com-plex balance of hepatic triglyceride production between increased conversion from excess glucose and reduced re-esterification from free fatty acids (as a result of reduced lip-olysis) [4]. A general observation is that different metabolic pathways were differentially affected. For example, concen-trations of glycolysis-related measures peaked within 2 h, whilst most other measures (e.g. amino acids, ketone bodies, and triglycerides) continuously decreased during the 2 h and had an evident trend afterwards.
The extensive metabolic data demonstrate that insulin-resistant individuals had systematically smaller relative meta-bolic responses in comparison to the insulin-sensitive ones. Some of these blunted changes have been previously reported for insulin-resistant or obese individuals separately in small studies, e.g. for lactate [7,20], beta-hydroxybutyrate [7, 20], isoleucine [7, 20], glycerol [7], and VLDL-TG [16, 18]. Interestingly, the metabolic measures which showed blunted changes in insulin-resistant individuals in this study have been also associated with insulin resistance in the fast-ing state [28]. It has been suggested that insulin resistance is associated with higher fasting glycolysis-related measures and greater fasting concentrations of branched-chain amino acids, glycerol, and triglycerides [28]. Prospective studies have suggested that the associated metabolic dysregulations at fasting state are predictive of future cardiometabolic risk [10, 11, 29, 32]. Further, recent Mendelian randomisation analyses have indicated a causal link from insulin resistance to higher branched-chain amino acids and triglycerides in the fasting state [3]. Our results here underline the possibil-ity that fasting concentrations may also reflect the insuffi-cient suppression of branched-chain amino acids and triglycerides in the postprandial state in the insulin-resistant individuals. Regardless of the exact sequence of events, this study provides new evidence that insulin-resistant individ-uals are at greater cardiometabolic risk both in the fasting and post-load settings.
The comparison between IR-NGT and IS-NGT addressed the differences in IR whilst having normal glucose metabol-ism. We also performed a mirror experiment where we compared the metabolic trajectories of IFG, IGT, and NDM to IR-NGT (varying glucose levels but minimising the differ-ences in IR). Interestingly, we found similar metabolic dysre-gulations in individuals with prediabetes and diabetes to those of insulin-resistant individuals with normal glucose metabolism. These findings suggest limited impact of glu-cose on these metabolic associations. This interpretation is reinforced by our adjusted analyses: the metabolic dysregula-tions appear to be exclusively driven by insulin resistance but not fasting or 2-h glucose. Type 2 diabetes, characterised by increased circulating glucose concentrations, is a known risk factor for CVD. However, a meta-analysis of prospective studies found only a marginal association between circulat-ing glucose and CVD outcomes [2]. Consistently, a meta-analysis of over 300 trials found limited evidence to support glucose-lowering drugs would reduce the risk of cardiovas-cular disease and all-cause mortality in patients of estab-lished type 2 diabetes [33]. By contrast, individuals at the stage of IR-NGT or prediabetes are reported to have higher risk of CVD [6, 34]. Taking these together, it seems that long-term exposure for the metabolic consequences of insu-lin resistance across multiple tissues would account for the concerting development of type 2 diabetes and cardiometa-bolic complications [5,6]. Our study revealed that glucose-independent postprandial dysfunction might be a novel component of this exposure that is hitherto poorly recog-nised as a potential interventional target.
Large-scale population studies and multiple time points of metabolomics data gave us a unique opportunity to study the systemic metabolic trajectories across multiple clinical glucose categories. Analyses with multiple testing, multivariate adjustments, and replication in an independ-ent cohort all point towards the robustness of the currindepend-ent findings. The associations of insulin resistance with the metabolic changes were consistent when assessed across three different surrogate markers of insulin resistance. However, we acknowledge that insulin resistance markers may reflect a composite state of insulin sensitivity levels of multiple tissues. In order to understand the metabolic sig-natures of specific tissues, further experiments are re-quired. In addition, the results were coherent whether the metabolic changes were assessed via relative or absolute concentration changes. The associations remained similar between men and women, between middle-aged and older individuals, and also between those with or without the presence of glucose abnormality. However, ethnic and so-cioeconomic context should be taken into account when extending these results to other populations. The OGTT corresponds to the ingestion of sugary drinks, but not mixed meals, and thus, these results should not be gener-alised to post-meal metabolic responses.
Conclusions
In conclusion, our results highlight the detrimental ef-fects of insulin resistance on systemic metabolism after glucose ingestion. The population health impact of these metabolic consequences is likely substantial given the spurious and energy-dense eating patterns in the mod-ern world, i.e. people are mostly living in a non-fasting state and consume high amounts of added sugar and re-fined carbohydrates. The observed metabolic effects manifest very early on, and these findings suggest new avenues to understand the increased CVD risk in insulin resistance and diabetes. It might therefore be beneficial if diabetes diagnostics and clinical care would be ex-tended beyond glucose management. We call for better recognition of postprandial dysfunction beyond glucose tolerance categories as an important cardiometabolic risk factor, and new preventive efforts and strategies to reverse all aspects of metabolic dysregulation. We main-tain that this is particularly important at the early stages of insulin resistance, and may also hold untapped thera-peutic opportunities.
Supplementary information
Supplementary informationaccompanies this paper athttps://doi.org/10. 1186/s12916-019-1440-4.
Additional file 1: Table S1.Characteristics of the Oulu1945 cohort.
Figure S1.A. Changes in 78 metabolic measures in response to an oral glucose tolerance test. B. Corresponding significance levels for A.Figure S2.A. Difference in metabolic changes between IR-NGT and IS-NGT. B. Corresponding significance level for A.Figure S3.Differences in meta-bolic changes associated with insulin resistance stratified by sex.Figure S4.Differences in metabolic changes associated with fasting insulin, HOMA-IR and Matsuda-index.Figure S5.Metabolic trajectories compared between insulin resistant individuals of normal glucose tolerance group to those with impaired fasting glucose.Figure S6.Metabolic trajectories for individuals with IS-NGT, IR-NGT, IFG, IGT, and NDM.Figure S7. Abso-lute metabolic concentrations at 0 ,30 ,60 and 120 minute for IS-NGT, IRNGT, IFG, IGT and NDM.Figure S8.Replication in Oulu1945.Figure S9.
Group comparisons adjusted with different factors.Figure S10. Differ-ence in baseline metabolite concentration (left) and 2-h metabolic change (right) comparing the groups to the reference group (IS-NGT). Additional file 2: Table S2.Interaction test of time groups and glucose groups for 78 metabolic measrues, adjusted for sex.Table S3.Change (%) in relative to baseline at 30, 60, 120 minute for five individual groups across 78 metabolic measures.Table S4.Differences in metabolite changes (%) between IR-NGT and IS-NGT.Table S5.Differences in me-tabolite changes (%) between IR-NGT and those with IGT or NDM.
Abbreviations
BMI:Body mass index; CVD: Cardiovascular disease; HDL: High-density lipoprotein; HOMA-IR: Homeostasis model assessment of insulin resistance; IDL: Intermediate-density lipoprotein; IFG: Impaired fasting glucose; IGT: Impaired glucose tolerance; IR: Insulin resistance; IR-NGT: Insulin resistance subgroup of normal glucose tolerance; ISI-Matsuda: Insulin sensitivity index-Matsuda; IS-NGT: Insulin-sensitive subgroup of normal glucose tolerance; LDL: Low-density lipoprotein; NDM: New onset of type 2 diabetes; NFBC66: The Northern Finland Birth Cohort 1966; NMR: Nuclear magnetic resonance; OGTT: Oral glucose tolerance test; VLDL: Very-low-density lipoproteins
Acknowledgements
Not applicable.
Authors’contributions
All listed authors meet the requirements for authorship. JJ, JA, KP, SKK, MRJ, and MAK contributed to the clinical data and study design. MAK contributed to the metabolomics. QW, JK, VPM, and MAK contributed to the analysis plan and interpretations. QW contributed to the statistical analyses. QW, VPM, and MAK drafted the manuscript. All authors commented the manuscript and agreed to its content.
Funding
This work is supported by grants from the National Health and Medical Research Council of Australia (APP1158958); the UK Medical Research Council (MC_UU_12013/1); the Academy of Finland (grant numbers 297338 and 307247); the Novo Nordisk foundation (NNF17OC0027034 and
NNF17OC0026062); the Health and Wellfare Center, City of Oulu, Finland; the Sigrid Juselius Foundation; the ERDF European Regional Development Fund (grant no. 539/2010 A31592); and the European Union’s Horizon 2020 research and innovation programme (grant agreement no. 633595; DynaHEALTH). The Baker Institute is supported in part by the Victorian Government’s Operational Infrastructure Support Program.
Availability of data and materials
Data are available for researchers who meet the criteria for access to confidential data according to the rules of each individual cohort and can be requested from the Institutional Data Access Committees of the Northern Finland Birth Cohort Study and the Oulu1945 study (University of Oulu, Finland).
Ethics approval and consent to participate
Ethical approval was obtained from the Ethics Committee of the Northern Ostrobothnia Hospital District. All participants gave written informed consent.
Consent for publication
Not applicable.
Competing interests
The authors declare that they have no competing interests.
Author details
1
Received: 8 April 2019 Accepted: 2 October 2019
References
1. Chatterjee S, Khunti K, Davies MJ. Type 2 diabetes. Lancet. 2017;389:2239–51. 2. Emerging Risk Factors Collaboration, Sarwar N, Gao P, Seshasai SRK, Gobin R,
Kaptoge S, et al. Diabetes mellitus, fasting blood glucose concentration, and risk of vascular disease: a collaborative meta-analysis of 102 prospective studies. Lancet. 2010;375:2215–22.
3. Wang Q, Holmes MV, Davey Smith G, Ala-Korpela M. Genetic support for a causal role of insulin resistance on circulating branched-chain amino acids and inflammation. Diabetes Care. 2017;40:1779–86.
4. Samuel VT, Shulman GI. The pathogenesis of insulin resistance: integrating signaling pathways and substrate flux. J Clin Invest. 2016;126:12–22. 5. Laakso M, Kuusisto J. Insulin resistance and hyperglycaemia in
cardiovascular disease development. Nat Rev Endocrinol. 2014;10:293–302. 6. Authors/Task Force Members, Rydén L, Grant PJ, Anker SD, Berne C,
Cosentino F, et al. ESC guidelines on diabetes, pre-diabetes, and cardiovascular diseases developed in collaboration with the EASD: the task force on diabetes, pre-diabetes, and cardiovascular diseases of the European Society of Cardiology (ESC) and developed in collaboration with the European Association for the Study of Diabetes (EASD). Eur Heart J. 2013;34:3035–87.
7. Shaham O, Wei R, Wang TJ, Ricciardi C, Lewis GD, Vasan RS, et al. Metabolic profiling of the human response to a glucose challenge reveals distinct axes of insulin sensitivity. Mol Syst Biol. 2008;4:214.
8. Nathan DM, Davidson MB, DeFronzo RA, Heine RJ, Henry RR, Pratley R, et al. Impaired fasting glucose and impaired glucose tolerance: implications for care. Diabetes Care. 2007;30:753–9.
9. Abdul-Ghani MA, Tripathy D, DeFronzo RA. Contributions of beta-cell dysfunction and insulin resistance to the pathogenesis of impaired glucose tolerance and impaired fasting glucose. Diabetes Care. 2006;29:1130–9. 10. Guasch-Ferré M, Hruby A, Toledo E, Clish CB, Martínez-González MA,
Salas-Salvadó J, et al. Metabolomics in prediabetes and diabetes: a systematic review and meta-analysis. Diabetes Care. 2016;39:833–46.
11. Ruiz-Canela M, Hruby A, Clish CB, Liang L, Martínez-González MA, Hu FB. Comprehensive metabolomic profiling and incident cardiovascular disease: a systematic review. J Am Heart Assoc. 2017;6:e005705.
12. Mahendran Y, Vangipurapu J, Cederberg H, Stancáková A, Pihlajamäki J, Soininen P, et al. Association of ketone body levels with hyperglycemia and type 2 diabetes in 9,398 Finnish men. Diabetes. 2013;62:3618–26. 13. Do R, Willer CJ, Schmidt EM, Sengupta S, Gao C, Peloso GM, et al. Common
variants associated with plasma triglycerides and risk for coronary artery disease. Nat Genet. 2013;45:1345–52.
14. Holmes MV, Ala-Korpela M, Smith GD. Mendelian randomization in cardiometabolic disease: challenges in evaluating causality. Nat Rev Cardiol. 2017;14:577–90.
15. Kathiresan S. Putative medicines that mimic mutations. Nature. 2017;548:530–1. 16. Vossen M, Tödter K, Altenburg C, Beisiegel U, Scheja L. Plasma triglycerides
after oral glucose load specifically associate with metabolic risk markers in healthy type 2 diabetes offspring. Atherosclerosis. 2011;217:214–9. 17. Li Q, Gu W, Ma X, Liu Y, Jiang L, Feng R, et al. Amino acid and biogenic
amine profile deviations in an oral glucose tolerance test: a comparison between healthy and hyperlipidaemia individuals based on targeted metabolomics. Nutrients. 2016;8:379.
18. Rämö JT, Kaye SM, Jukarainen S, Bogl LH, Hakkarainen A, Lundbom J, et al. Liver fat and insulin sensitivity define metabolite profiles during a glucose tolerance test in young adult twins. J Clin Endocrinol Metab. 2017;102:220–31. 19. Molnos S, Wahl S, Haid M, Eekhoff EMW, Pool R, Floegel A, et al. Metabolite
ratios as potential biomarkers for type 2 diabetes: a DIRECT study. Diabetologia. 2017;64:718–3.
20. Ho JE, Larson MG, Vasan RS, Ghorbani A, Cheng S, Rhee EP, et al. Metabolite profiles during oral glucose challenge. Diabetes. 2013;62:2689–98. 21. Geidenstam N, Spégel P, Mulder H, Filipsson K, Ridderstråle M, Danielsson
APH. Metabolite profile deviations in an oral glucose tolerance test—a comparison between lean and obese individuals. Obesity (Silver Spring). 2014;22:2388–95.
22. Järvelin M-R, Sovio U, King V, Lauren L, Xu B, McCarthy MI, et al. Early life factors and blood pressure at age 31 years in the 1966 northern Finland birth cohort. Hypertension. 2004;44:838–46.
23. Psychogios N, Hau DD, Peng J, Guo AC, Mandal R, Bouatra S, et al. The human serum metabolome. Flower D, editor. PLoS One. 2011;6:e16957. 24. Soininen P, Kangas AJ, Würtz P, Tukiainen T, Tynkkynen T, Laatikainen R,
et al. High-throughput serum NMR metabonomics for cost-effective holistic studies on systemic metabolism. Analyst. 2009;134:1781–5.
25. Soininen P, Kangas AJ, Würtz P, Suna T, Ala-Korpela M. Quantitative serum nuclear magnetic resonance metabolomics in cardiovascular epidemiology and genetics. Circ Cardiovasc Genet. 2015;8:192–206.
26. Würtz P, Kangas AJ, Soininen P, Lawlor DA, Davey Smith G, Ala-Korpela M. Quantitative serum nuclear magnetic resonance metabolomics in large-scale epidemiology: a primer on -omic technologies. Am J Epidemiol. 2017; 186:1084–96.
27. Inouye M, Kettunen J, Soininen P, Silander K, Ripatti S, Kumpula LS, et al. Metabonomic, transcriptomic, and genomic variation of a population cohort. Mol Syst Biol. 2010;6:441.
28. Würtz P, Mäkinen V-P, Soininen P, Kangas AJ, Tukiainen T, Kettunen J, et al. Metabolic signatures of insulin resistance in 7,098 young adults. Diabetes. 2012;61:1372–80.
29. Würtz P, Havulinna AS, Soininen P, Tynkkynen T, Prieto-Merino D, Tillin T, et al. Metabolite profiling and cardiovascular event risk: a prospective study of three population-based cohorts. Circulation. 2015;131:774–85. 30. Kujala UM, Mäkinen V-P, Heinonen I, Soininen P, Kangas AJ, Leskinen TH,
et al. Long-term leisure-time physical activity and serum metabolome. Circulation. 2013;127:340–8.
31. Wang Q, Kangas AJ, Soininen P, Tiainen M, Tynkkynen T, Puukka K, et al. Sex hormone-binding globulin associations with circulating lipids and metabolites and the risk for type 2 diabetes: observational and causal effect estimates. Int J Epidemiol. 2015;44:623–37.
32. Wang TJ, Larson MG, Vasan RS, Cheng S, Rhee EP, McCabe E, et al. Metabolite profiles and the risk of developing diabetes. Nat Med. 2011;17:448–53. 33. Palmer SC, Mavridis D, Nicolucci A, Johnson DW, Tonelli M, Craig JC,
et al. Comparison of clinical outcomes and adverse events associated with glucose-lowering drugs in patients with type 2 diabetes. JAMA. 2016;316:313–2.
34. Huang Y, Cai X, Mai W, Li M, Hu Y. Association between prediabetes and risk of cardiovascular disease and all cause mortality: systematic review and meta-analysis. BMJ. 2016;355:i5953–11.
Publisher’s Note
Springer Nature remains neutral with regard to jurisdictional claims in published maps and institutional affiliations.