R E S E A R C H A R T I C L E
Open Access
Development and validation of three
machine-learning models for predicting
multiple organ failure in moderately severe
and severe acute pancreatitis
Qiu Qiu
1,2, Yong-jian Nian
3, Yan Guo
1, Liang Tang
1, Nan Lu
3, Liang-zhi Wen
1, Bin Wang
1, Dong-feng Chen
1*and
Kai-jun Liu
1*Abstract
Background:Multiple organ failure (MOF) is a serious complication of moderately severe (MASP) and severe acute pancreatitis (SAP). This study aimed to develop and assess three machine-learning models to predict MOF. Methods:Patients with MSAP and SAP who were admitted from July 2014 to June 2017 were included. Firstly, parameters with significant differences between patients with MOF and without MOF were screened out by univariate analysis. Then, support vector machine (SVM), logistic regression analysis (LRA) and artificial neural networks (ANN) models were constructed based on these factors, and five-fold cross-validation was used to train each model. Results:A total of 263 patients were enrolled. Univariate analysis screened out sixteen parameters referring to blood volume, inflammatory, coagulation and renal function to construct machine-learning models. The predictive efficiency of the optimal combinations of features by SVM, LRA, and ANN was almost equal (AUC = 0.840, 0.832, and 0.834, respectively), as well as the Acute Physiology and Chronic Health Evaluation II score (AUC = 0.814,P> 0.05). The common important predictive factors were HCT, K-time, IL-6 and creatinine in three models.
Conclusions:Three machine-learning models can be efficient prognostic tools for predicting MOF in MSAP and SAP. ANN is recommended, which only needs four common parameters.
Keywords:Multiple organ failure, Pancreatitis, Machine learning
Background
Acute pancreatitis (AP) is a common and serious inflam-matory disorder that may result in severe complications such as systemic inflammatory response syndrome (SIRS), organ failure, etc. The 2012 revised Atlanta classification stratified AP into mild acute pancreatitis (MAP), moder-ately severe acute pancreatitis (MSAP), and severe acute pancreatitis (SAP) based on the presence of persistent organ failure and complications [1]. If organ failure cannot be resolved within 48 h, SAP will develop. Single organ failure may persist to the late phase in AP, even affecting other organs [1]. The lung is the most commonly affected
extrapancreatic organ in AP and this is frequently followed by acute kidney injury and cardiovascular system injury [2]. The main factor determining clinical outcome is the presence and duration of multiple organ failure (MOF) [1, 3], and the mortality of AP complicated by MOF is higher than 20% [4]. Since no specific drug is available to prevent AP developing into MOF, which is an extremely serious complication, it is pivotal to identify pa-tients at high risk of MOF in an early phase, so intensive care and appropriate intervention can be provided to pre-vent disease progression.
Several single parameters such as C-reactive protein (CRP) and complex scores, including the Acute Physi-ology and Chronic Health Evaluation (APACHE) II score and Ranson score, are available to assess the severity of AP. However, their practical application for predicting
© The Author(s). 2019Open AccessThis article is distributed under the terms of the Creative Commons Attribution 4.0 International License (http://creativecommons.org/licenses/by/4.0/), which permits unrestricted use, distribution, and reproduction in any medium, provided you give appropriate credit to the original author(s) and the source, provide a link to the Creative Commons license, and indicate if changes were made. The Creative Commons Public Domain Dedication waiver (http://creativecommons.org/publicdomain/zero/1.0/) applies to the data made available in this article, unless otherwise stated.
* Correspondence:[email protected];[email protected]
1Department of Gastroenterology, Daping Hospital, Army Medical University
the risk of MOF in an early phase is limited, since the CRP value can only indicate the inflammation state 72 h after the onset of symptoms; in addition, these scoring systems are cumbersome and require that some indexes are recorded dynamically [1]. At present, no single par-ameter or system is capable of predicting MOF in AP accurately. Therefore, it is essential to develop and valid-ate a prognostic tool that can reliably predict MOF in the early phase.
MOF in SAP is thought to be a consequence of many fac-tors, including uncontrolled systemic inflammation, micro-circulation disturbance, coagulation dysfunction, and so on. SAP is often accompanied by substantial changes in the coagulation system [5], and coagulation-inflammation inter-actions occur in SAP [6]. Therefore, we speculated that in-flammatory and coagulation markers could be helpful for predicting the risk of MOF. Moreover, blood urea nitrogen (BUN) is associated with mortality in AP [7] and creatinine is shown to be a marker of pancreatic necrosis [8], so they can probably predict MOF in AP as well.
It is well known that machine-learning techniques such as support vector machine (SVM), logistic regres-sion analysis (LRA) and artificial neural networks (ANN) provide new methods for predicting clinical outcomes and complications at an individual level, and these have already been applied to clinical studies [9]. The aim of this study was to develop a computational tool for pre-dicting the risk of MOF in MSAP and SAP from a larger set of parameters that include blood volume, inflamma-tory, coagulation and renal function markers, which have been shown to be different between patients with and without MOF. Five-fold cross-validation was used to test the predictive ability of SVM, LRA and ANN, and we compared the predictive efficiency of the three models and APACHE II score.
Methods
Patients and data collection
This retrospective cohort study was performed in three affiliated hospitals (Daping Hospital, Southwest Hospital and Xinqiao Hospital) of Army Medical University, Chongqing, China. Data of MSAP and SAP patients were collected from July 1st, 2014 to June 30th, 2017. Diagnostic criteria of MSAP and SAP followed the con-sensus revision of the Atlanta classification [1]. The pa-tients with conditions such as pregnancy, pancreatic cancer, liver cirrhosis, coagulation system disease and in-complete laboratory examinations and those who were transferred after initial treatment or the time from onset to hospital admission exceeded 24 h were excluded from this study. According to the guideline of management of AP [10], all patients underwent standard medical treat-ment such as early aggressive hydration, antibiotics for infection, enteral nutrition, and so on. The Modified
Marshall score was used to evaluate organ failure at 48 h after admission to determine whether they had delayed MOF including the pulmonary system, renal system and cardiovascular system failure. The study protocol was reviewed and approved by the Ethics Committee of Army Medical University and all methods were performed in ac-cordance with the relevant guidelines and regulations. As a retrospective observational study and all subjects were anonymized, informed consent was not required.
Demographic and clinical features, including gender, age, body mass index (BMI), history of hypertension, diabetes and etiology (biliary, hypertriglyceridemia, alco-holic, et al) were recorded. Laboratory data, a total of twenty-three parameters obtained on admission, are shown in Additional file1. Meanwhile, we calculated the admission APACHE II score.
Statistics
Descriptive data were presented as median and inter-quartile ranges for skewed distribution variables or mean ± standard deviation for variables with a normal distribution. Categorical data were presented as propor-tions. The Pearson chi-square test was used to compare categorical variables and multiple rates. A t-test and the nonparametric Mann-Whitney test were used to com-pare normal and skewed distribution variables, respect-ively. Statistical analyses were performed using SPSS 23.0 software. Comparison for multiple ROC curves of three models and APACHE II score were performed using MedCalc software.
Machine learning model
receiver operating characteristics (ROC) curve and aver-aged area under the curve (AUC) value of these three classifiers for the 10 trials were obtained to assess the classification algorithm.
With predicted the pseudo-probability from SVM, LRA and ANN, and obtained the cutoff value from ROC curve. Then, sensitivity (SEN), specificity (SPE), false positive rate (FPR), false negative rate (FNR), positive predictive value (PPV), negative predictive value (NPV) and accuracy were calculated from these three models. We compared these indexes of these models and APA-CHE II score.
Results
Baseline characteristics
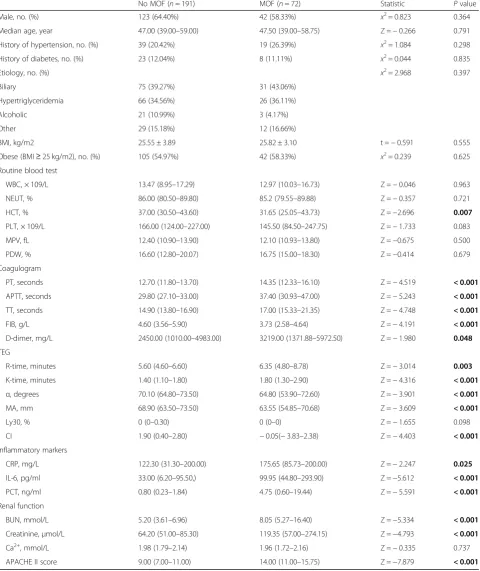
Two hundred and 63 patients suffering from MSAP and SAP were enrolled in this study. The characteristics of the included patients with and without MOF were summarized in Table 1. The characteristics of the whole cohort of pa-tients are shown in Additional file2. Seventy-two (27.38%) patients suffered from MOF. Consistent with previous re-ports [11, 12], biliary tract disease (40.30%) was the most common cause of AP, and hypertriglyceridemia came sec-ond (34.98%). One hundred and 47 of all the patients were obese (BMI≥25 kg/m2) [13].
Parameters including hematocrit (HCT), coagulogram, thrombelastogram (TEG), inflammatory markers, renal function and the APACHE II score differed significantly between patients with and without MOF (P< 0.05). Un-expectedly, no statistical differences were observed in the levels of white blood cell (WBC) count and calcium ion (Ca2+) between the two groups (P> 0.05). Mean-while, no differences were observed in gender, age, his-tory of hypertension and diabetes, etiology and BMI between the two groups (P > 0.05).
SVM prediction
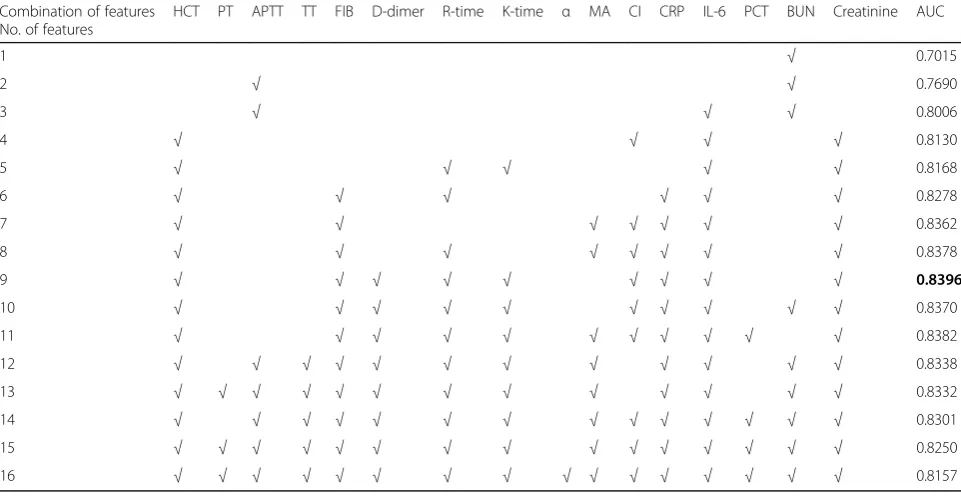
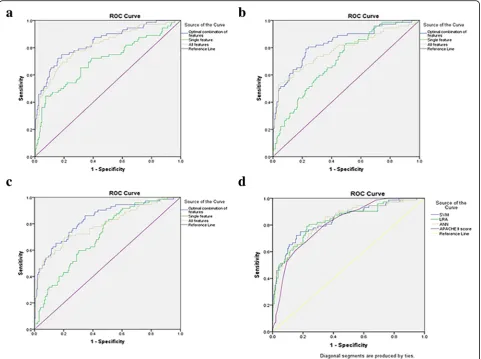
Sixteen parameters that differed significantly between the two groups (P < 0.05) were used for feature selection by SVM, to find an optimal combination of features for predicting MOF in MSAP and SAP. With the increase in the number of selected features, the acquired combin-ation of features became variable. After feature selection, the combination of nine features, namely HCT, fibrino-gen (FIB), D-dimer, reaction time (R-time), kinetic time (K-time), coagulation index (CI), CRP, interleukin-6 (IL-6) and creatinine, obtained the highest AUC value, mak-ing it the optimal combination. If other features were added to this basis, the AUC value was reduced (Table2) . The AUC values of the optimal combination, single fea-ture, namely BUN and all features were 0.840 (95% con-fidence interval (CI): 0.783–0.896), 0.702 (95% CI: 0.625–0.778) and 0.816 (95% CI: 0.755–0.876), respect-ively (Fig.1a).
LRA prediction
Similar to SVM, the sixteen features were entered into LRA. However, unlike SVM, the optimal combination of features for predicting MOF only needed six features, in-cluding HCT, activated partial thromboplastin time (APTT), FIB, K-time, IL-6 and creatinine. If other fea-tures were added to the basis of these six feafea-tures, AUC would again be reduced (Table 3). The AUC values of the optimal combination, single feature, namely IL-6 and all features were 0.832 (95% CI: 0.773–0.890), 0.709 (95% CI: 0.642–0.775) and 0.783 (95% CI: 0.714–0.853), respectively (Fig.1b).
ANN prediction
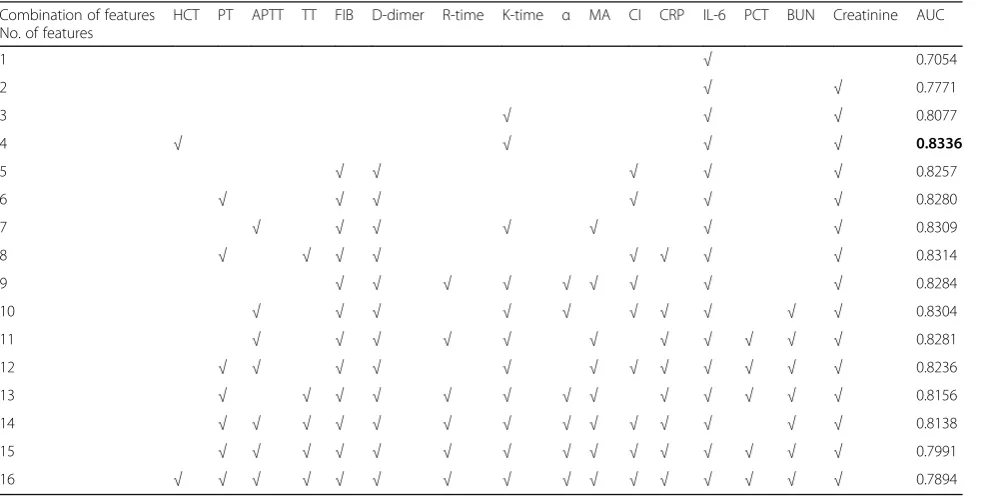
As for SVM and LRA, the same sixteen features were entered into ANN. The optimal combination of features for predicting MOF only required four features, namely HCT, K-time, IL-6 and creatinine. If features were added to the basis of these four features, AUC would be re-duced as well (Table4). The AUC values of the optimal combination, single feature, namely IL-6 and all features were 0.834 (95% CI: 0.777–0.890), 0.705 (95% CI: 0.639– 0.772) and 0.789 (95% CI: 0.723–0.856), respectively (Fig. 1c). Thus, HCT, K-time, IL-6 and creatinine were the common important predictive factors for MOF in these three optimal combinations of features obtained by SVM, LRA and ANN.
Comparisons of three models and APACHE II score
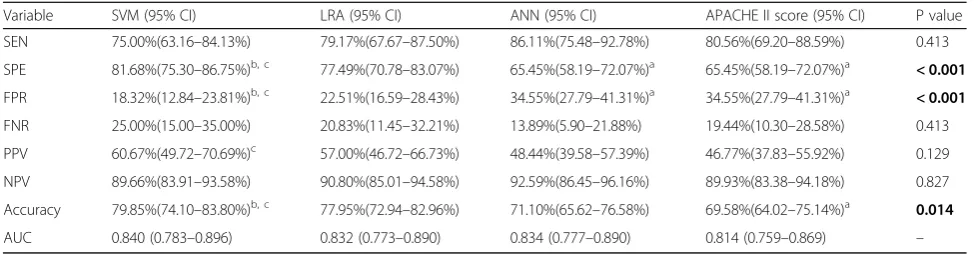
We compared the optimal combinations of features resulting from SVM, LRA and ANN and the APACHE II score. The evaluating indexes for these three models and APACHE II score for predicting MOF in MSAP and SAP are shown in Table 5. No significant differences were observed among these three models in SEN, FNR, PPV, NPV and AUC value (P> 0.05). The SPE, FPR and predictive accuracy of SVM was superior, but the overall predictive performance of these three models and APA-CHE II score was not different (P > 0.05) (Fig.1d).
Discussion
by AP [16]. Therefore, it is extremely important to pre-dict the risk of MOF early. Presently, investigation is still going on for a convenient and practical tool for MOF
prediction. Machine-learning techniques have extraor-dinary information analyzing capabilities and can select the most meaningful features to construct a model; they Table 1Characteristic of patients in group with MOF and without MOF
No MOF (n= 191) MOF (n= 72) Statistic Pvalue
Male, no. (%) 123 (64.40%) 42 (58.33%) x2= 0.823 0.364
Median age, year 47.00 (39.00–59.00) 47.50 (39.00–58.75) Z =−0.266 0.791
History of hypertension, no. (%) 39 (20.42%) 19 (26.39%) x2= 1.084 0.298
History of diabetes, no. (%) 23 (12.04%) 8 (11.11%) x2= 0.044 0.835
Etiology, no. (%) x2= 2.968 0.397
Biliary 75 (39.27%) 31 (43.06%)
Hypertriglyceridemia 66 (34.56%) 26 (36.11%)
Alcoholic 21 (10.99%) 3 (4.17%)
Other 29 (15.18%) 12 (16.66%)
BMI, kg/m2 25.55 ± 3.89 25.82 ± 3.10 t =−0.591 0.555
Obese (BMI≥25 kg/m2), no. (%) 105 (54.97%) 42 (58.33%) x2= 0.239 0.625
Routine blood test
WBC, × 109/L 13.47 (8.95–17.29) 12.97 (10.03–16.73) Z =−0.046 0.963
NEUT, % 86.00 (80.50–89.80) 85.2 (79.55–89.88) Z =−0.357 0.721
HCT, % 37.00 (30.50–43.60) 31.65 (25.05–43.73) Z =−2.696 0.007
PLT, × 109/L 166.00 (124.00–227.00) 145.50 (84.50–247.75) Z =−1.733 0.083
MPV, fL 12.40 (10.90–13.90) 12.10 (10.93–13.80) Z =−0.675 0.500
PDW, % 16.60 (12.80–20.07) 16.75 (15.00–18.30) Z =−0.414 0.679
Coagulogram
PT, seconds 12.70 (11.80–13.70) 14.35 (12.33–16.10) Z =−4.519 < 0.001
APTT, seconds 29.80 (27.10–33.00) 37.40 (30.93–47.00) Z =−5.243 < 0.001
TT, seconds 14.90 (13.80–16.90) 17.00 (15.33–21.35) Z =−4.748 < 0.001
FIB, g/L 4.60 (3.56–5.90) 3.73 (2.58–4.64) Z =−4.191 < 0.001
D-dimer, mg/L 2450.00 (1010.00–4983.00) 3219.00 (1371.88–5972.50) Z =−1.980 0.048
TEG
R-time, minutes 5.60 (4.60–6.60) 6.35 (4.80–8.78) Z =−3.014 0.003
K-time, minutes 1.40 (1.10–1.80) 1.80 (1.30–2.90) Z =−4.316 < 0.001
α, degrees 70.10 (64.80–73.50) 64.80 (53.90–72.60) Z =−3.901 < 0.001
MA, mm 68.90 (63.50–73.50) 63.55 (54.85–70.68) Z =−3.609 < 0.001
Ly30, % 0 (0–0.30) 0 (0–0) Z =−1.655 0.098
CI 1.90 (0.40–2.80) −0.05(−3.83–2.38) Z =−4.403 < 0.001
Inflammatory markers
CRP, mg/L 122.30 (31.30–200.00) 175.65 (85.73–200.00) Z =−2.247 0.025
IL-6, pg/ml 33.00 (6.20–95.50,) 99.95 (44.80–293.90) Z =−5.612 < 0.001
PCT, ng/ml 0.80 (0.23–1.84) 4.75 (0.60–19.44) Z =−5.591 < 0.001
Renal function
BUN, mmol/L 5.20 (3.61–6.96) 8.05 (5.27–16.40) Z =−5.334 < 0.001
Creatinine,μmol/L 64.20 (51.00–85.30) 119.35 (57.00–274.15) Z =−4.793 < 0.001
Ca2+
, mmol/L 1.98 (1.79–2.14) 1.96 (1.72–2.16) Z =−0.335 0.737
APACHE II score 9.00 (7.00–11.00) 14.00 (11.00–15.75) Z =−7.879 < 0.001
are novel tools in medical research and have become recognized as such by more and more medical profes-sionals recently [17]. Here, we applied three types of machine-learning algorithms (SVM, LRA and ANN) to the data for AP to develop a convenient tool for predict-ing the risk of MOF in the medium or late phase of pan-creatitis. Clinical data on routine blood test, coagulogram, TEG, inflammatory markers, and renal function were collected and used for machine-learning algorithms. Finally, these three models all yielded satis-factory predictive performance and each produced an optimal combination of features as predictive model.
HCT, K-time, IL-6 and creatinine were common im-portant predictive factors for MOF selected by SVM, LRA and ANN. An elevated HCT is associated with hypovolemia, while decreased HCT suggests hemodi-lution. It was reported that HCT≥44% could predict persistent organ failure [18], while our research showed that a decreased HCT is correlated with MOF. Therefore, we speculate that a significantly ele-vated or decreased HCT could indicate a poor prog-nosis. IL-6 is an effective indicators for the degree of inflammatory response in AP [19]. Plasma IL-6 levels are markedly increased in pancreatitis animals [20], and inhibition of IL-6 alleviates the formation of edema, inflammatory cell infiltration, and necrosis in cerulein-induced AP [21]. IL-6 is a pro-inflammatory cytokine and regulates leukocyte recruitment through the IL-6 trans-signaling-dependent STAT3 pathway in pancreatic acinar cells. It links local inflammation in
the pancreas to systemic inflammation, and even to lethal extrapancreatic organ damage [22]. IL-6 levels are significantly higher in patients with acute lung in-jury compared with MAP patients [22]. Our results show that patients with MOF had higher levels of IL-6 than those without MOF and demonstrate that IL-IL-6 plays an important role in predicting the risk of MOF.
AP patients with organ failure were reported to have higher prothrombin time (PT) and APTT levels than those without organ failure, but PT and APTT were not able to independently predict organ failure in a multi-variate analysis [23]. Here, patients with MOF had higher PT, APTT, thrombin time (TT), and D-dimer and lower FIB levels, suggesting that the coagulation dys-function was more serious in patients with MOF. How-ever, none of these coagulogram parameters were entered into the three predicted models for MOF in pancreatitis simultaneously.
K-time, a parameter in TEG which is a comprehen-sive examination reflecting coagulation state, like alpha (α) angle mainly indicates FIB level, but also can be influenced by platelet function to a small ex-tent. Other parameters in TEG included R-time, which indicates the role of clotting factors, maximum amplitude (MA), which indicates the number and function of platelet, and CI indicating the overall co-agulation status [24]. Prolonged R-time and K-time suggest a state of hypocoagulation in pancreatitis pa-tients with MOF, while α angle, MA and CI would Table 2Different combinations of features by SVM
Combination of features No. of features
HCT PT APTT TT FIB D-dimer R-time K-time α MA CI CRP IL-6 PCT BUN Creatinine AUC
1 √ 0.7015
2 √ √ 0.7690
3 √ √ √ 0.8006
4 √ √ √ √ 0.8130
5 √ √ √ √ √ 0.8168
6 √ √ √ √ √ √ 0.8278
7 √ √ √ √ √ √ √ 0.8362
8 √ √ √ √ √ √ √ √ 0.8378
9 √ √ √ √ √ √ √ √ √ 0.8396
10 √ √ √ √ √ √ √ √ √ √ 0.8370
11 √ √ √ √ √ √ √ √ √ √ √ 0.8382
12 √ √ √ √ √ √ √ √ √ √ √ √ 0.8338
13 √ √ √ √ √ √ √ √ √ √ √ √ √ 0.8332
14 √ √ √ √ √ √ √ √ √ √ √ √ √ √ 0.8301
15 √ √ √ √ √ √ √ √ √ √ √ √ √ √ √ 0.8250
16 √ √ √ √ √ √ √ √ √ √ √ √ √ √ √ √ 0.8157
be reduced. Here, K-time was demonstrated to be vital in these three models. The reasons that K-time can predict MOF are the following: firstly, one of the consequences of local inflammation is vascular injury within the pancreas, leading to endothelial cell acti-vation and damage, increased vascular permeability, leukocyte adhesion and migration, and activation of the coagulation system [25]. Secondly, some clotting factors concentrations alter due to activation of the coagulation system; for example, concentrations of serum tissue factor and von Willebrand factor in-crease in SAP [26, 27], and this could significantly predict acute lung injury [27]. This results in the hy-percoagulable state and thrombotic complications in-cluding thrombosis and gangrene observed in some
SAP patients [28]. Then, the consumption of large amounts of clotting factors leads to a hypocoagulable state. In turn, coagulation dysfunction aggravates inflammation because thrombin promotes the pro-duction and release of pro-inflammatory cytokines, particularly IL-6 [28]. Therefore, coagulation dys-function reflects the severity of AP, and the positive feedback relationship between coagulation and in-flammation is the reason that K-time could predict MOF in MSAP and SAP.
capable of predicting the risk of MOF in the medium or late phase of pancreatitis.
AP patients with hyperlipidemia had a higher mortality rate, worse prognosis and higher risk of local complica-tions [30], because elevated level of triglyceride and free fatty acids lead to toxic effects and are essential risk
factors for pancreatic acinar cell damage [31]. Diabetes and hypertension have been reported to increase the risk of AP [32] and could be predictors of SAP [33]. Age and BMI are recognized factors to assess the severity of AP initially [10]. However, AP’s etiology, such as hyperlipid-emia, diabetes or hypertension, age and BMI, were not Table 3Different combinations of features by LRA
Combination of features No. of features
HCT PT APTT TT FIB D-dimer R-time K-time α MA CI CRP IL-6 PCT BUN Creatinine AUC
1 √ 0.7088
2 √ √ 0.7803
3 √ √ √ 0.8101
4 √ √ √ √ 0.8226
5 √ √ √ √ √ 0.8294
6 √ √ √ √ √ √ 0.8319
7 √ √ √ √ √ √ √ 0.8275
8 √ √ √ √ √ √ √ √ 0.8269
9 √ √ √ √ √ √ √ √ √ 0.8285
10 √ √ √ √ √ √ √ √ √ √ 0.8240
11 √ √ √ √ √ √ √ √ √ √ √ 0.8221
12 √ √ √ √ √ √ √ √ √ √ √ √ 0.8147
13 √ √ √ √ √ √ √ √ √ √ √ √ √ 0.8149
14 √ √ √ √ √ √ √ √ √ √ √ √ √ √ 0.8054
15 √ √ √ √ √ √ √ √ √ √ √ √ √ √ √ 0.8040
16 √ √ √ √ √ √ √ √ √ √ √ √ √ √ √ √ 0.7833
Entry in boldface showed highest AUC
Table 4Different combinations of features by ANN
Combination of features No. of features
HCT PT APTT TT FIB D-dimer R-time K-time α MA CI CRP IL-6 PCT BUN Creatinine AUC
1 √ 0.7054
2 √ √ 0.7771
3 √ √ √ 0.8077
4 √ √ √ √ 0.8336
5 √ √ √ √ √ 0.8257
6 √ √ √ √ √ √ 0.8280
7 √ √ √ √ √ √ √ 0.8309
8 √ √ √ √ √ √ √ √ 0.8314
9 √ √ √ √ √ √ √ √ √ 0.8284
10 √ √ √ √ √ √ √ √ √ √ 0.8304
11 √ √ √ √ √ √ √ √ √ √ √ 0.8281
12 √ √ √ √ √ √ √ √ √ √ √ √ 0.8236
13 √ √ √ √ √ √ √ √ √ √ √ √ √ 0.8156
14 √ √ √ √ √ √ √ √ √ √ √ √ √ √ 0.8138
15 √ √ √ √ √ √ √ √ √ √ √ √ √ √ √ 0.7991
16 √ √ √ √ √ √ √ √ √ √ √ √ √ √ √ √ 0.7894
capable of predicting MOF in MSAP and SAP in this study, probably because these parameters are less related to MOF than inflammatory and coagulation parameters.
Here, we made use of machine learning to predict the risk of MOF induced by pancreatitis. In one study, ANN was able to predict the incidence of portosplenomesen-teric venous thrombosis in AP, with an AUC value of 0.849. However, that was a small-sample research ana-lyzing only 11 parameters [34]. We conducted a two-step feature selection strategy to develop a superior pre-diction model. The first step eliminated a great number of unrelated data. Then, five-fold cross-validation was used to test the predictive ability of the three models in-vestigated to achieve a reliable and stable predictive model.
As for our study, it is very convenient to get the predicted probability for MOF of an individual, which is superior to complicated score systems such as APACHE II score. Secondly, compared to traditional statistical methods, SVM, LRA and ANN are better at analyzing nonlinear relationships between various bio-chemical markers and MOF. In addition, these three models are practical, since the parameters used in the three models are well established in routine clinical work. We recommend the ANN model, which only needs four parameters to get satisfactory AUC values, as well as SVM, LRA and the APACHE II score. Moreover, we note that combining coagulation and inflammation parameters has great potential for pre-dicting the risk of MOF, confirming the effect of co-agulation dysfunction in the pathogenesis of MOF induced by AP.
Conclusions
Three convenient and practical models which can predict the risk of MOF of individual AP patients based on SVM, LRA and ANN were developed and
validated. HCT, K-time, IL-6 and creatinine play a significant role in these models. All of the parame-ters in the three models are well established in rou-tine clinical work, so SVM, LRA and ANN could be promising tools for predicting MOF in MSAP and SAP patients in the clinical practice.
Additional files
Additional file 1:Table S1.Laboratory data obtained on admission of all patients. (DOC 36 kb)
Additional file 2:Table S2.Baseline characteristics in the whole cohort of patients. APACHE II score, Acute Physiology and Chronic Health Evaluation II score; BMI, body mass index; MOF, multiple organ failure. (DOC 32 kb)
Abbreviations
ANN:Artificial neural networks; APACHE II score: Acute Physiology and Chronic Health Evaluation II score; APTT: Activated partial thromboplastin time; AUC: Area under the curve; BMI: Body mass index; BUN: Blood urea nitrogen; Ca2+: Calcium ion; CI: Coagulation index; CI: Confidence interval;
CRP: C-reactive protein; FIB: Fibrinogen; FNR: False negative rate; FPR: False positive rate; HCT: Hematocrit; IL-6: Interleukin-6; K-time: Kinetic time; LRA: Logistic regression analysis; LY30: Percent fibrinolysis at 30 min; MA: Maximum amplitude; MOF: Multiple organ failure; MPV: Mean platelet volume; NEUT: Percentage of neutrophils; NPV: Negative predictive value; PCT: Procalcitonin; PDW: Platelet distribution width; PLT: Platelet count; PPV: Positive predictive value; PT: Prothrombin time; R-time: Reaction time; SEN: Sensitivity; SPE: Specificity; SVM: Support vector machine;
TEG: Thrombelastogram; TT: Thrombin time; WBC: White blood cell;α angle: Alpha angle
Acknowledgements
We would like to thank the professor (Na-na Wu) in departments of medical images and statistical teaching and research in Army Medical University that participated in this study.
Authors’contributions
QQ designed and coordinated the study, made substantial contributions to the analysis, and drafted the manuscript. YN and NL performed machine-learning models. LT performed statistical analysis. YG participated in data col-lection and interpretation. LW and BW helped to draft the manuscript. KL and DC reviewed the manuscript and exerted a major impact on the inter-pretation of data and critical appraisal of the manuscript. All authors have read and approved the final manuscript.
Table 5Comparison of SVM, LRA, ANN and APACHE II score for predicting MOF
Variable SVM (95% CI) LRA (95% CI) ANN (95% CI) APACHE II score (95% CI) P value
SEN 75.00%(63.16–84.13%) 79.17%(67.67–87.50%) 86.11%(75.48–92.78%) 80.56%(69.20–88.59%) 0.413
SPE 81.68%(75.30–86.75%)b, c 77.49%(70.78–83.07%) 65.45%(58.19–72.07%)a 65.45%(58.19–72.07%)a < 0.001 FPR 18.32%(12.84–23.81%)b, c 22.51%(16.59–28.43%) 34.55%(27.79–41.31%)a 34.55%(27.79–41.31%)a < 0.001
FNR 25.00%(15.00–35.00%) 20.83%(11.45–32.21%) 13.89%(5.90–21.88%) 19.44%(10.30–28.58%) 0.413
PPV 60.67%(49.72–70.69%)c 57.00%(46.72–66.73%) 48.44%(39.58–57.39%) 46.77%(37.83–55.92%) 0.129
NPV 89.66%(83.91–93.58%) 90.80%(85.01–94.58%) 92.59%(86.45–96.16%) 89.93%(83.38–94.18%) 0.827
Accuracy 79.85%(74.10–83.80%)b, c 77.95%(72.94–82.96%) 71.10%(65.62–76.58%) 69.58%(64.02–75.14%)a 0.014
AUC 0.840 (0.783–0.896) 0.832 (0.773–0.890) 0.834 (0.777–0.890) 0.814 (0.759–0.869) –
a
Compared with LRA, P < 0.05
b
Compared with ANN, P < 0.05
c
Compared with APACHE II score, P < 0.05
Funding
This work was supported by the National Natural Science Foundation of China (Grant No. 81700483) and Chongqing Research Program of Basic Research and frontier technology (Grant No. cstc2017jcyjAX0302). The funding was used in the data collection, dada analysis and construction of the models.
Availability of data and materials
The datasets during and/or analysed during the current study are available from the corresponding author on reasonable request.
Ethics approval and consent to participate
The study protocol was reviewed and approved by the Ethics Committee of Army Medical University and all methods were performed in accordance with the relevant guidelines and regulations. As a retrospective observational study and all subjects were anonymized, informed consent was not required.
Consent for publication Not applicable.
Competing interests
The authors declare that they have no competing interests.
Author details
1Department of Gastroenterology, Daping Hospital, Army Medical University
(Third Military Medical University), Chongqing 400042, China.2Department of
Gastroenterology, People’s Hospital of Chongqing Hechuan, Chongqing 401520, China.3Department of Medical Images, College of Biomedical
Engineering and Imaging Medicine, Army Medical University (Third Military Medical University), Chongqing 400038, China.
Received: 22 September 2018 Accepted: 7 June 2019
References
1. Banks PA, Bollen TL, Dervenis C, Gooszen HG, Johnson CD, Sarr MG, et al. Classification of acute pancreatitis--2012: revision of the Atlanta classification and definitions by international consensus. Gut. 2013;62(1):102–11. 2. Mole DJ, Olabi B, Robinson V, Garden OJ, Parks RW. Incidence of individual
organ dysfunction in fatal acute pancreatitis: analysis of 1024 death records. HPB (Oxford). 2009;11(2):166–70.
3. Doctor N, Agarwal P, Gandhi V. Management of severe acute pancreatitis. Indian J Surg. 2012;74(1):40–6.
4. Mc Kay CJ, Buter A. Natural history of organ failure in acute pancreatitis. Pancreatology. 2003;3(2):111–4.
5. Lisman T, Porte RJ. Activation and regulation of hemostasis in acute liver failure and acute pancreatitis. Semin Thromb Hemost. 2010;36(4):437–43. 6. Dumnicka P, Maduzia D, Ceranowicz P, Olszanecki R, Drozdz R,
Kusnierz-Cabala B. The interplay between inflammation, coagulation and endothelial injury in the early phase of acute pancreatitis: clinical implications. Int J Mol Sci. 2017;18(2).
7. Wu BU, Bakker OJ, Papachristou GI, Besselink MG, Repas K, van Santvoort HC, et al. Blood urea nitrogen in the early assessment of acute pancreatitis: an international validation study. Arch Intern Med. 2011;171(7):669–76. 8. Muddana V, Whitcomb DC, Khalid A, Slivka A, Papachristou GI. Elevated
serum creatinine as a marker of pancreatic necrosis in acute pancreatitis. Am J Gastroenterol. 2009;104(1):164–70.
9. Librenza-Garcia D, Kotzian BJ, Yang J, Mwangi B, Cao B, Pereira Lima LN, et al. The impact of machine learning techniques in the study of bipolar disorder: a systematic review. Neurosci Biobehav Rev. 2017;80:538–54. 10. Tenner S, Baillie J, DeWitt J, Vege SS. American College of G. American
College of Gastroenterology guideline: management of acute pancreatitis. Am J Gastroenterol. 2013;108(9):1400–15; 16.
11. Yadav D, Lowenfels AB. The epidemiology of pancreatitis and pancreatic cancer. Gastroenterology. 2013;144(6):1252–61.
12. Wan J, He W, Zhu Y, Zhu Y, Zeng H, Liu P, et al. Stratified analysis and clinical significance of elevated serum triglyceride levels in early acute pancreatitis: a retrospective study. Lipids Health Dis. 2017;16(1):124. 13. Batty GD, Barzi F, Huxley R, Chang CY, Jee SH, Jamrozik K, et al. Obesity and
liver cancer mortality in Asia: the Asia Pacific cohort studies collaboration. Cancer Epidemiol. 2009;33(6):469–72.
14. Petrov MS, Shanbhag S, Chakraborty M, Phillips AR, Windsor JA. Organ failure and infection of pancreatic necrosis as determinants of mortality in patients with acute pancreatitis. Gastroenterology. 2010;139(3):813–20. 15. Afghani E, Pandol SJ, Shimosegawa T, Sutton R, Wu BU, Vege SS, et al. Acute pancreatitis-Progress and challenges: a report on an international symposium. Pancreas. 2015;44(8):1195–210.
16. Mole DJ, Webster SP, Uings I, Zheng X, Binnie M, Wilson K, et al. Kynurenine-3-monooxygenase inhibition prevents multiple organ failure in rodent models of acute pancreatitis. Nat Med. 2016;22(2):202–9. 17. Savage N. Machine learning: calculating disease. Nature. 2017;550(7676):
S115–S7.
18. Koutroumpakis E, Wu BU, Bakker OJ, Dudekula A, Singh VK, Besselink MG, et al. Admission hematocrit and rise in blood urea nitrogen at 24 h outperform other laboratory markers in predicting persistent organ failure and pancreatic necrosis in acute pancreatitis: a post hoc analysis of three large prospective databases. Am J Gastroenterol. 2015;110(12):1707–16. 19. Li N, Wang BM, Cai S, Liu PL. The role of serum high mobility group box 1
and Interleukin-6 levels in acute pancreatitis: a meta-analysis. J Cell Biochem. 2018;119(1):616–24.
20. Merza M, Hartman H, Rahman M, Hwaiz R, Zhang E, Renström E, et al. Neutrophil extracellular traps induce trypsin activation, inflammation, and tissue damage in mice with severe acute pancreatitis. Gastroenterology. 2015;149(7):1920–31 e8.
21. Hong SS, Choi JH, Lee SY, Park YH, Park KY, Lee JY, et al. A novel small-molecule inhibitor targeting the IL-6 receptor beta subunit, glycoprotein 130. J Immunol. 2015;195(1):237–45.
22. Zhang H, Neuhofer P, Song L, Rabe B, Lesina M, Kurkowski MU, et al. IL-6 trans-signaling promotes pancreatitis-associated lung injury and lethality. J Clin Invest. 2013;123(3):1019–31.
23. Radenkovic D, Bajec D, Ivancevic N, Milic N, Bumbasirevic V, Jeremic V, et al. D-dimer in acute pancreatitis: a new approach for an early assessment of organ failure. Pancreas. 2009;38(6):655–60.
24. Liu H, Li J, Yu J, Yuan T. Research into the predictive effect of TEG in the changes of coagulation functions of the patients with traumatic brain hemorrhage. Open Med (Wars). 2015;10(1):399–404.
25. Liao CY, Huang SC, Lin CH, Wang CC, Liu MY, Ben RJ, et al. Successful resolution of symmetrical peripheral gangrene after severe acute pancreatitis: a case report. J Med Case Rep. 2015;9:213.
26. Ou ZB, Miao CM, Ye MX, Xing DP, He K, Li PZ, et al. Investigation for role of tissue factor and blood coagulation system in severe acute pancreatitis and associated liver injury. Biomed Pharmacother. 2017;85:380–8.
27. Siemiatkowski A, Wereszczynska-Siemiatkowska U, Mroczko B, Galar M, Maziewski T. Circulating endothelial mediators in human pancreatitis-associated lung injury. Eur J Gastroenterol Hepatol. 2015;27(6):728–34. 28. Danckwardt S, Hentze MW, Kulozik AE. Pathologies at the nexus of blood
coagulation and inflammation: thrombin in hemostasis, cancer, and beyond. J Mol Med (Berl). 2013;91(11):1257–71.
29. Wang X, Xu Y, Qiao Y, Pang X, Hong L, Fu J, et al. An evidence-based proposal for predicting organ failure in severe acute pancreatitis. Pancreas. 2013;42(8):1255–61.
30. Deng L-H, Xue P, Xia Q, Yang X-N, Wan M-H. Effect of admission hypertriglyceridemia on the episodes of severe acute pancreatitis. World J Gastroenterol. 2008;14(28):4558.
31. Wang Y, Sternfeld L, Yang F, Rodriguez JA, Ross C, Hayden MR, et al. Enhanced susceptibility to pancreatitis in severe hypertriglyceridaemic lipoprotein lipase-deficient mice and agonist-like function of pancreatic lipase in pancreatic cells. Gut. 2009;58(3):422–30.
32. Bexelius TS, Ljung R, Garcia Rodriguez LA. Type 2 diabetes, high blood pressure and acute pancreatitis. Hepatobiliary Pancreat Dis Int. 2016;15(4): 443–5.
33. Mole DJ, Gungabissoon U, Johnston P, Cochrane L, Hopkins L, Wyper GM, et al. Identifying risk factors for progression to critical care admission and death among individuals with acute pancreatitis: a record linkage analysis of Scottish healthcare databases. BMJ Open. 2016;6(6):e011474.
34. Fei Y, Hu J, Li WQ, Wang W, Zong GQ. Artificial neural networks predict the incidence of portosplenomesenteric venous thrombosis in patients with acute pancreatitis. J Thromb Haemost. 2017;15(3):439–45.
Publisher’s Note