R E S E A R C H A R T I C L E
Open Access
Candidate single nucleotide
polymorphisms of irritable bowel
syndrome: a systemic review and
meta-analysis
Shiwei Zhu, Ben Wang, Qiong Jia and Liping Duan
*Abstract
Background:Genetic factors increase the risk of irritable bowel syndrome (IBS). Analysis of single nucleotide polymorphisms (SNPs) has been used in IBS patients, but the findings are inconsistent. The goal of this review was to synthesize all the published SNPs studies of IBS through meta-analysis to objectively evaluate the relevance of SNPs to IBS risks.
Methods:IBS - related polymorphisms studies from 2000 to 2018 were searched. Pooled odds ratios with a 95% confidence interval for each SNP were evaluated through five genetic models. Ethnicity, ROME criteria and IBS subtypes were defined for subgroup analyze.
Results:Ten relevant genes were evaluated. SNPs rs4263839 and rs6478108 ofTNFSF15associated with an increased risk of IBS;IL6rs1800795 increased the risk for Caucasian IBS patients which diagnosed by Rome III criteria; andIL23R rs11465804 increased the risk for IBS-C patients. IL10 rs1800896 GG genotype associated with a decreased risk of IBS. No evidence supported the association ofGNβ3rs5443,TNFαrs1800629, andIL10rs1800871 to IBS in this study. Conclusions:This meta-analysis presents an in-depth overview for IBS SNPs analysis. It was confirmed that polymorphisms ofTNFSF15associated with increased IBS risk, whileIL10rs1800896 associated with decreased IBS risk. It might offer some insights into polymorphisms of inflammation factors which might affect IBS susceptibility. Moreover, the analysis also emphasizes the importance of diagnostic criteria and phenotype homogeneity in IBS genetic studies.
Keywords:Genetic risk, Irritable bowel syndrome, Single nucleotide polymorphisms, TNFSF15 IL10
Background
Irritable bowel syndrome (IBS) is a predominant and common chronic gastrointestinal (GI) disorder present-ing with recurrent abdominal pain accompanied with altered bowel habits. IBS has been a continually increas-ing trend worldwide, especially in developincreas-ing countries. It leads to negative effects on the quality of life and the work efficiency of affected patients. According to the Rome IV criteria, IBS is categorized into four subtypes [1], diarrhea predominant IBS (IBS-D), constipation predominant IBS (IBS-C), mixture of diarrhea and con-stipation IBS (IBS-M) and un-subtyped IBS (IBS-U).
Genetic, environmental and psychological factors,
which may result in “brain-gut-axis” dysfunction [2],
increase the risk of IBS. In addition, the consequential pathophysiological mechanisms [3] such as changes in gastrointestinal motility, visceral hypersensitivity, in-creasing mucosal permeability, immune activation and gut microbiota dysbiosis, are evaluated in many re-searches. Due to the multifactorial origin and the elusive etiology of IBS, there is no consensus on diagnostic bio-markers/methods or curative therapy it.
In early 2000, twins [4] and family [5, 6] studies dem-onstrated a more heritable component to IBS. The associations of IBS and its risk gene polymorphisms have been ascertained by many researchers. Single nucleotide polymorphisms (SNPs) represent the most widespread type of sequence variations in genomes. It is known to
© The Author(s). 2019Open AccessThis article is distributed under the terms of the Creative Commons Attribution 4.0 International License (http://creativecommons.org/licenses/by/4.0/), which permits unrestricted use, distribution, and reproduction in any medium, provided you give appropriate credit to the original author(s) and the source, provide a link to the Creative Commons license, and indicate if changes were made. The Creative Commons Public Domain Dedication waiver (http://creativecommons.org/publicdomain/zero/1.0/) applies to the data made available in this article, unless otherwise stated. * Correspondence:[email protected]
be valuable genetic markers, because it may reveal the evolutionary history and common genetic polymor-phisms that explain the hereditary risks for common
dis-eases such as inflammation bowel disease (IBD) [7, 8].
Case-control studies have examined the possible role of different SNPs in patients with IBS, such as sero-tonin transporter protein (SERT) [9],
Catechol-O-methyltransferase (COMT) [10], β3 subunit of
G-protein (GNβ3) [11], voltage-gated mechanosensitive
Na(+) channel NaV1.5 (SCN5A) [12], and tumor
ne-crosis factor (TNF)-α [13]. Some meta-analysis
previ-ously were conducted and researchers attempted to extract commonalities as well. Owing to unclear or
mixed ethnicity, patients’ population changes,
updat-ing of Rome diagnostic criteria and usage of different genetic models, conclusion of association for SNPs and IBS have still been inconsistent over time.
Therefore, this systematic review aimed to synthesize and updated previous SNPs studies through meta-analysis, in order to produce an in-depth analysis of genetic SNPs with IBS from a more detailed perspective.
Methods
Search strategy and study selection
Studies of irritable bowel syndrome and its associated genetic polymorphisms were identified by systematically searching from the following databases: PubMed, Web of Science, EMBASE, Cochrane Clinical Trials Database, Medline and Chinese database Chinese National Know-ledge Infrastructure. Searching terms of medical subject
headings (MeSH) included ‘irritable bowel syndrome,
IBS’ combined with‘polymorphism, genetic
polymorph-ism, single nucleotide polymorphisms, SNPs’. Studies
were concerned in the period of 2000.01–2018.01 and
the search was not limited by language or publication status. Potentially relevant articles were screened by at least 2 independent reviewers, and disagreements were resolved by discussion or input from a third reviewer if required.
Inclusion criteria and quality assessment
All candidate studies were included if they met all the inclusion criteria as follow: (i) Case-control studies with subjects’ information, available allele frequency and no consanguinity between the case and control groups. (ii) Explicit ethnicity such as Caucasian or Mongolian. (iii) IBS diagnosis based on clinical examination and specific diagnostic criteria such as Rome I-III. (iv) Allele fre-quency meets Hardy-Weinberg equilibrium in healthy controls. (v) Largest sample size was included in reused data. Newcastle-Ottawa Quality Assessment Scale (NOS) scored as quality assessment in all studies. To confirm the test effect, SNPs that had been reported in less than 3 studies were excluded in this meta-analysis.
Data extraction
Two investigators independently extracted data from the identified publications, including the first author’s name, year of publication, source of publication, IBS diagnostic criteria, DNA extraction and genotyping method, numbers and source of patients and controls, genotype frequency, and allele frequency. Discrepan-cies in data extraction were resolved by repeating the study review and discussing the results. The corre-sponding author was contacted, and genotype fre-quencies were requested when missing from the studies.
Statistical analysis
Hardy-Weinberg equilibrium (HWE) analysis of the controls was performed using the Chi-square test. To determine the overall gene effect, five genetic models in-cluding allele (AM), dominant (DM), recessive (RM), homozygous (HoM) and heterozygous (HeM) models were used to evaluate the allele and genotype risks for IBS [14,15]. Relative risks of IBS were estimated accord-ing to odds ratios (ORs) with 95% confidence intervals (CIs). The heterogeneity among studies was assessed using the Cochran Q test [16]. The inconsistency index I2was also calculated to quantify heterogeneity. A fixed-effects model was used to pool the results if the result of the heterogeneity test was not significant (P> 0.05) or I2< 50%); otherwise, a random-effect model was selected. Sensitive test was conducted to determine the source of heterogeneity. Publication bias was examined by using the Begg’s test only if analyzed studies were more than five [17]. Subgroups of ethnicity, diagnostic criteria and IBS subtypes were conducted in each SNP. All statistical tests were two-tailed, and the level of significance was set at P< 0.05. STATA version 13 (Stata Corporation, College Station, TX, United States) was used for all analysis.
Results
Study selection and characteristics analysis
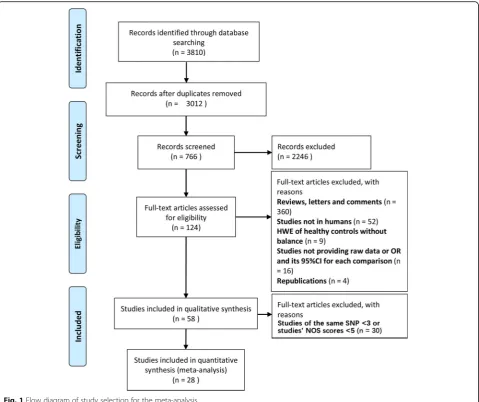
From the databases, 3810 potentially relevant publica-tions were identified. Figure1shows the flow diagram of this study. After screening and inclusion, 66 SNPs were identified in IBS patients (see Additional file 1: Table S1). Finally, 10 different SNPs from 28 studies were de-termined; references for these studies are provided in Additional file1: Table S1. The identified SNPs focus on
neurotransmitter system (SLC6A4 5-HTTLPR, COMT
sputum. SNPs were assayed through PCR. The charac-teristics of these studies are shown in Additional file 1: Table S2. Rome III criteria was used in half of the stud-ies (50% Rome III, 46.6% Rome II and 0.04% Rome I). Multiple comparisons of identified SNPs through five
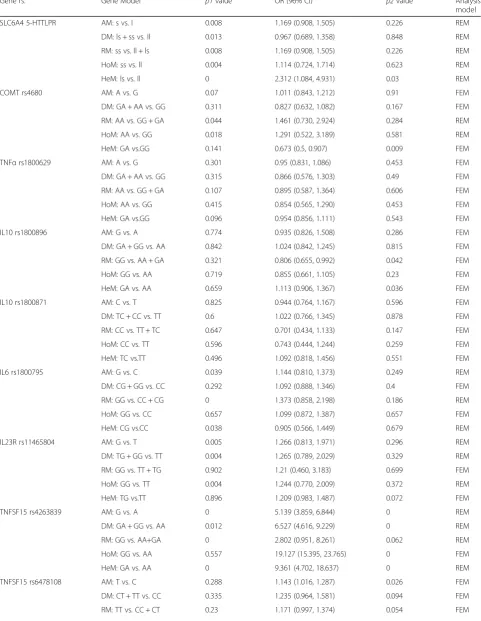
genetic models is summarized in Table1.
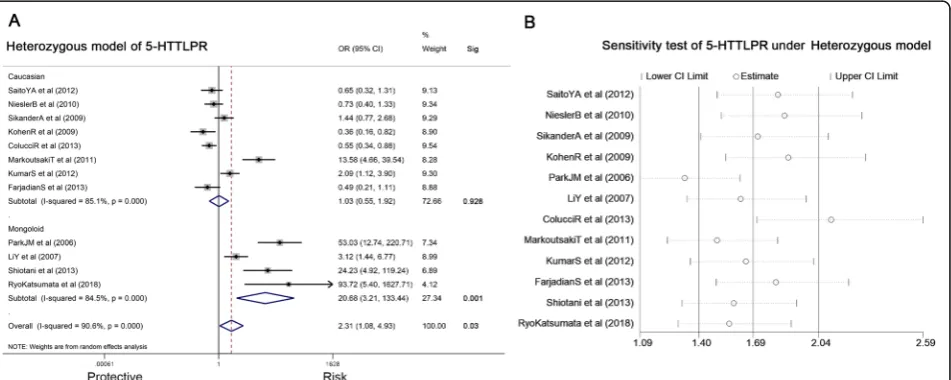
SLC6A4 5-HTTLPR and IBS risk
Twelve studies involving 1834 IBS subjects and 1941 con-trols were analyzed to determine the association of the SLC6A4 5-HTTLPR and IBS risk (Table 1). Genotype ls presented an increased risk for IBS development in HeM (ls vs. ll, OR = 2.312, 95% CI: 1.084–4.931, P = 0.03) (Fig.2a). Heterogeneity for included studies is significant (P <0.05). A sensitivity analysis, after excluding studies in turn, indicated that the associations remained (Fig. 2b). Begg’s test suggested no publication bias (P= 0.064). Thus,
subgroup analysis based on ethnicity or diagnostic criteria
was performed. Figure 2a shows that polymorphism was
significantly correlated with IBS risk in Mongoloid popu-lation (OR = 20.68, 95% CI: 3.21–133.44, P = 0.001), but there was no association in Caucasian populations. No sig-nificant association was found in diagnostic criteria sub-groups. Further, IBS subtypes (IBS-A, IBS-C and IBS-D) were analyzed but no association was found.
COMTrs4680 and IBS risk
Three studies involving 414 IBS patients and 1363
controls were analyzed for the association of COMT
rs4680 (G > A) and IBS risk (Table1). GA genotype pre-sented a decreased risk for IBS in the HeM (GA vs. GG,
OR = 0.673, 95% CI: 0.5–0.907, P = 0.009) (Fig. 3a).
Included studies were with a good homogeneity (I2=
Table 1Summary of results of all polymorphisms for five genetic models
Gene rs. Gene Model p1valuea OR (96% CI)b p2valuec Analysis model
SLC6A4 5-HTTLPR AM: s vs. l 0.008 1.169 (0.908, 1.505) 0.226 REM
DM: ls + ss vs. ll 0.013 0.967 (0.689, 1.358) 0.848 REM
RM: ss vs. ll + ls 0.008 1.169 (0.908, 1.505) 0.226 REM
HoM: ss vs. ll 0.004 1.114 (0.724, 1.714) 0.623 REM
HeM: ls vs. ll 0 2.312 (1.084, 4.931) 0.03 REM
COMT rs4680 AM: A vs. G 0.07 1.011 (0.843, 1.212) 0.91 FEM
DM: GA + AA vs. GG 0.311 0.827 (0.632, 1.082) 0.167 FEM
RM: AA vs. GG + GA 0.044 1.461 (0.730, 2.924) 0.284 REM
HoM: AA vs. GG 0.018 1.291 (0.522, 3.189) 0.581 REM
HeM: GA vs.GG 0.141 0.673 (0.5, 0.907) 0.009 FEM
TNFαrs1800629 AM: A vs. G 0.301 0.95 (0.831, 1.086) 0.453 FEM
DM: GA + AA vs. GG 0.315 0.866 (0.576, 1.303) 0.49 FEM
RM: AA vs. GG + GA 0.107 0.895 (0.587, 1.364) 0.606 FEM
HoM: AA vs. GG 0.415 0.854 (0.565, 1.290) 0.453 FEM
HeM: GA vs.GG 0.096 0.954 (0.856, 1.111) 0.543 FEM
IL10 rs1800896 AM: G vs. A 0.774 0.935 (0.826, 1.508) 0.286 FEM
DM: GA + GG vs. AA 0.842 1.024 (0.842, 1.245) 0.815 FEM
RM: GG vs. AA + GA 0.321 0.806 (0.655, 0.992) 0.042 FEM
HoM: GG vs. AA 0.719 0.855 (0.661, 1.105) 0.23 FEM
HeM: GA vs. AA 0.659 1.113 (0.906, 1.367) 0.036 FEM
IL10 rs1800871 AM: C vs. T 0.825 0.944 (0.764, 1.167) 0.596 FEM
DM: TC + CC vs. TT 0.6 1.022 (0.766, 1.345) 0.878 FEM
RM: CC vs. TT + TC 0.647 0.701 (0.434, 1.133) 0.147 FEM
HoM: CC vs. TT 0.596 0.743 (0.444, 1.244) 0.259 FEM
HeM: TC vs.TT 0.496 1.092 (0.818, 1.456) 0.551 FEM
IL6 rs1800795 AM: G vs. C 0.039 1.144 (0.810, 1.373) 0.249 REM
DM: CG + GG vs. CC 0.292 1.092 (0.888, 1.346) 0.4 FEM
RM: GG vs. CC + CG 0 1.373 (0.858, 2.198) 0.186 REM
HoM: GG vs. CC 0.657 1.099 (0.872, 1.387) 0.657 FEM
HeM: CG vs.CC 0.038 0.905 (0.566, 1.449) 0.679 REM
IL23R rs11465804 AM: G vs. T 0.005 1.266 (0.813, 1.971) 0.296 REM
DM: TG + GG vs. TT 0.004 1.265 (0.789, 2.029) 0.329 REM
RM: GG vs. TT + TG 0.902 1.21 (0.460, 3.183) 0.699 FEM
HoM: GG vs. TT 0.004 1.244 (0.770, 2.009) 0.372 REM
HeM: TG vs.TT 0.896 1.209 (0.983, 1.487) 0.072 FEM
TNFSF15 rs4263839 AM: G vs. A 0 5.139 (3.859, 6.844) 0 REM
DM: GA + GG vs. AA 0.012 6.527 (4.616, 9.229) 0 REM
RM: GG vs. AA+GA 0 2.802 (0.951, 8.261) 0.062 REM
HoM: GG vs. AA 0.557 19.127 (15.395, 23.765) 0 FEM
HeM: GA vs. AA 0 9.361 (4.702, 18.637) 0 REM
TNFSF15 rs6478108 AM: T vs. C 0.288 1.143 (1.016, 1.287) 0.026 FEM
DM: CT + TT vs. CC 0.335 1.235 (0.964, 1.581) 0.094 FEM
49%,P= 0.141). Subgroups analyses were conducted but no associations were found.
IL10rs1800896 and IBS risk
Seven studies involving 955 IBS patients and 779 con-trols were analyzed for the association ofIL10rs1800896 (A > G) and IBS risk (Table1). GG genotype presented a decreased risk of IBS in the RM (GG vs. GA+AA, OR = 0.806, 95% CI: 0.655–0.992,P =0.042) (Fig. 3b). No sig-nificant heterogeneity (I2= 14.3%, P= 0.321) was found. Further subgroup analysis was used for ethnicity and diagnostic criteria, but no additional associations were found.
IL6 rs1800795and IBS risk
There were four studies involving 1641 IBS patients and 1058 controls, which were analyzed for the association
of IL6 rs1800795 (C > G) and IBS risk (Table 1). The
data showed no association of allele or genotype with
IBS risk. The AM (G vs. C) was used for subgroup ana-lysis. This finding was interesting because there was no association of the G allele with IBS in the Caucasian subgroup, but in Caucasian subgroups with diagnostic
Rome III criteria (Fig. 3c), the IL6 rs1800795 G allele
significantly increased the risk for IBS (OR = 2.057, 95% CI: 1.313–3.225,P =0.002).
IL23R rs11465804 and IBS risk
There were four studies involving 2068 IBS patients and
1958 controls that analyzed the association of IL23R
rs11465804 (T > G) and IBS risk (Table 1). The data
showed no association of the polymorphism with IBS risk in any of the models. In subgroup analysis of IBS
subtype, IL23R rs11465804 increased the risk for IBS-C
both in AM (G vs. T, OR = 1.346, 95% CI: 1.025–1.767,
P = 0.032) and DM (TG + GG vs. TT, OR = 1.338, 95%
CI: 1.005–1.781,P =0.046) (Fig.3d). No association was found in IBS-D patients or other subgroup.
Table 1Summary of results of all polymorphisms for five genetic models(Continued)
Gene rs. Gene Model p1valuea OR (96% CI)b p2valuec Analysis model
HoM: TT vs. CC 0.287 1.306 (1.005, 1.697) 0.045 FEM
HeM: CT vs.CC 0.326 1.17 (0.902, 1.519) 0.237 FEM
GNβ3 rs5443 AM: T vs. C 0.013 1.167 (0.825, 1.651) 0.383 REM
DM: CT + TT vs. CC 0.025 1.196 (0.762, 1.877) 0.437 REM
RM: TT vs. CC + CT 0.227 1.273 (0.811, 1.998) 0.295 FEM
HoM: TT vs. CC 0.037 1.394 (0.701, 2.772) 0.344 REM
HeM: CT vs.CC 0.088 1.166 (0.776, 1.753) 0.459 FEM
a Cochran Q test;b Odds ratio (95% confidence interval); c Mante-Haenszel test;AMAllele models,DMDominant models,RMRecessive models,HoMHomozygous models,HeMHeterozygous models,REMRandom effect model,FEMFixed effect model
TNFSF15 rs4263839 and IBS risk
Four studies involving 2068 IBS patients and 1959
controls analyzed the association ofTNFSF15rs4263839
(A > G) and IBS risk (Table 1). A significantly positive
association betweenTNFSF15 rs4263839 polymorphism
and IBS development was found in AM (G vs. A, OR = 5.139, 95% CI: 3.859–6.844,P< 0.01), DM (GA + GG vs. AA, OR = 6.527, 95% CI: 4.616–9.229, P< 0.01), HoM (GG vs. AA, OR = 19.127, 95% CI: 15.395–23.765, P< 0.01) and HeM (GA vs. AA models, OR = 9.361, 95% CI:
4.702–18.637, P< 0.01). AM was used for subgroup
analysis. As for IBS subtype (Fig. 4a and b), the G allele increased the risks for both IBS-C (OR = 4.79, 95% CI:
4.16–5.51, P< 0.01) and IBS-D (OR = 4.24, 95% CI:
3.74–4.81, P< 0.01). Moreover, subgroup analysis of Caucasian (Fig.4a and b) also supported the results.
TNFSF15 rs6478108 and IBS risk
There were three studies involving 1527 IBS patients and 1008 controls that analyzed the association of
TNFSF15rs6478108 (C > T) and IBS risk (Table1). Poly-morphism increases the risk of IBS in AM (T vs. C,
OR = 1.043, 95% CI: 1.016–1.287, P = 0.026) and HoM
(TT vs. CC models, OR = 1.306, 95% CI: 1.005–1.697,
P = 0.045) (Fig.4c and d) accompany with good
homo-geneity (AM: I2= 20.3%, P= 0.288; HoM: I2= 20.5%,P= 0.287). Because all the subjects participating in these studies were Caucasian, only subgroup analysis of diag-nostic criteria was performed, but the results suggested no correlations.
SNPs had no association with IBS risk
Eight studies involving 1868 IBS patients and 1462
controls were analyzed for the association of TNFα
of the models. In addition, the AM was used for sub-group analysis, there was no association in the subsub-group analysis.
Discussion
As a multi-pathogenesis disease, the genetic risk [6, 18] of IBS have been demonstrated in many studies. More than 65 candidate genes have been reported for IBS. Many new IBS associated SNPs was found through different strategies, for example, the genome-wide
asso-ciation studies (GWAS) [19–21]. However, consensus of
the major IBS risk genes has been hard to reach. F. Bon-figlio et al. [22] carried out a GWAS meta-analysis of pa-tients with IBS, they found SNPs in regulation of ion
channel activity such as SCN5A and SI as the most
plausible pathway affecting IBS. However, GWAS origin risk genes have not been successfully replicated in inde-pendent studies. Those IBS risk SNPs are mainly located in introns or UTR regions, which complicating the explan-ation of the gene functions to IBS pathygenesis. Moreover, most of the IBS GWAS analysis are population-based
rather than identified as IBS cohort-based, which may cause variations. With the development of techniques, more newly detected SNPs were found related with the development of IBS in case-control studies. For example, SNPs of calcium-sensing receptor polymorphism (CaSR)
[23] rs1801725 and adrenergic receptor (ADR) [24–26].
Nevertheless, there is no overview of all IBS-associated polymorphisms. Thus, this systemic review synthesized all the published SNPs studies of IBS through a strict meta-analysis, with the goal of objectively determining the rele-vance of genetic SNPs with IBS.
used to give an exhaustive analysis of the association. Except for ethnicity subgroup, diagnostic criteria and IBS subtype were also defined as another two subgroups which might assist to further analysis.
Cytokine gene polymorphisms are important because they might be associated with changes in cytokine pro-files. It represent immune system dysregulation in IBS
development. Among all the SNPs, TNFSF15rs4263839
and TNFSF15 rs6478108 increased the risk of IBS. TNFSF15 encodes for TL1A, which is a tumor necrosis factor superfamily member expressed in different im-mune cells. It may trigger an imim-mune response through Th17 cell [27] and play an important role in the
devel-opment of many autoimmune and inflammatory
diseases. Studies have demonstrated a close association between TL1A and IBD. Genetic analysis also confirmed
that the TNFSF15 gene is a race-specific susceptibility
gene for IBD [28, 29] and TL1A was up-regulated both
in intestinal mucosal T-cells and peripheral blood mono-nuclear cells of IBD patients [30]. Animal experiments showed that anti-TL1A antibody could reduce intestinal inflammation in chronic colitis [28]. According to the
results of this study, TNFSF15 rs4263839 G allele
increasing the risk of IBS. It was found in IBS patients
and different IBS subtypes (IBS-C, IBS-D). TNFSF15
rs6478108 T allele increased IBS risk as well, but no association was found in subgroup analysis. This finding might provide a clue for the overlaps between IBD and IBS, and it might become a treatment target for IBS. For another Th17-associated pathway, IL23R interacts with IL23 to regulate the activity of immune cells and plays an important role in the inflammatory response against
infection by bacteria and viruses. IL23R rs11465804,
which associated with increasing risk of IBD [7], has also been reported in case-control studies and GWAS in
patients with IBS. It was hypothesized [31] that IL23R
gene variants increased the secretion of Th17 in patients,
leading to a protective effect. In this study, IL23R
rs11465804 G allele of IBS-C patients represented a
pro-tective effect. However, fewer studies focus on IL23R
rs11465804, and its function on intestinal motility is unclear which needs further analysis.
IL6 has been reported increasing in the plasma of IBS patients. IL6 rs1800795 mutation (C > G) is associated with higher plasma concentrations of IL6 during
immune activation [32]. Our finding is intriguing, IL6
rs1800795 G allele doubled the risk of Caucasian IBS patients which diagnosed by Rome III criteria but not Rome II criteria. It might because IBS diagnostic criteria changed greatly from Rome II to Rome III, the later defined different IBS subtypes based on Bristol scale, which purifying IBS patients from other
func-tional gastroenterology diseases. For IL10 rs1800896,
people with GG allele seem to have lower risks
developing to IBS. This result is consistent with previ-ous studies [13]. In addition, a few studies confirmed a decreased IL10 level in the serum and intestinal mucosa of IBS patients. Probiotics, such asBifidobacteriumand Lactococcus, can regulate IL10 level to reduce mucosal inflammation [32–34].
Serotonin is an important neurotransmitter both in the CNS and GI tract. It is reuptaken by SERT which
encoded by theSLC6A4gene to regulate serotonin
con-centration. Case–control studies on SLC6A4 5-HTTLPR
were conducted to verify this hypothesis. Some studies demonstrated a positive association while others failed
to confirm that [35]. Mohammed YA et al. reported s
allele of SLC6A4 5-HTTLPRreduced the risk of IBS in
Asian population, while another meta-analysis [9] found
l allele uniquely associated with increased IBS-C risk.
Data in this meta-analysis only represented thatls
geno-type of SLC6A4 5-HTTLPR associated with increased
risk of IBS in Mongoloid ethnicity. No association was found in other genetic models and further subgroup
analysis. SLC6A4 5-HTTLPR with a short variation (s)
has been shown to decrease the activity of SERT which may accelerate intestinal peristalsis. However, studies took for analysis have significant heterogeneity, further analyses are necessary to confirm the results. Though, serotonin plays a key role in intestinal motility, sensitiv-ity and endocrine systems, due to its wide distribution and nonspecific effect, serotonin can also be influenced by IBS subtype, ethnicity and many other factors. It is very difficult to support a strong relationship of serotonin-associated polymorphisms with IBS. Based on the studies above and our results, it is understandable that serotonin has been the earliest treatment target of
IBS but with a little application. GA genotype ofCOMT
rs4680 was associated with decreased IBS risk. COMT is an enzyme involved in the degradation of catecholamine neurotransmitters.COMTrs4680 leads to the substitution of valine (Val) by methionine (Met), which decreases the enzyme activity and is associated with a lower pain sensi-tivity threshold [24]. However, our result is not consistent
with previous studies [36, 37]. One reason might be the
limited studies with mixed ethnicity - only three studies were analyzed, but Mongoloid, Caucasian, and other ethnicities were all included. Another reason might be the different DNA sources. For example, Orand et al. [24] extracted DNA from saliva. No evidence for a contribution ofGNβ3rs5443, TNFαrs1800629, andIL10rs1800871 to IBS was found in this study, which is consistent with previ-ous researches [10,11,38].
also affect susceptibility to IBS, were not accounted for in the present study. Second, allele and genotype effect on IBS risk were both analyzed but no best genetic model was determined. Differ from those monogenous hereditary diseases, the pathogenesis of IBS is the result of the combination of both environmental and genetic factors. It’s hard to tell whether someone will develop IBS by having a specific allele mutation. Moreover, multiple comparisons through different genetic models can increase the probability of false-positive outcome as well.
Conclusions
In this review, it was confirmed thatTNFSF15rs4263839
and TNFSF15 rs6478108 associated with increased IBS
risk, while IL10 rs1800896 GG genotype associated with
decreased IBS risk. Diagnostic criteria changes had
influ-ence on the association between IL6 rs1800795 and IBS
risk. And IL23R rs11465804 might become a new target
for IBS-C developing. According to these findings, it might offer some insights into gene functions affecting IBS susceptibility and some clues in IBS genetic analysis.
Supplementary information
Supplementary informationaccompanies this paper athttps://doi.org/10. 1186/s12876-019-1084-z.
Additional file 1: Table S1.Summary of studied according to SNP: this table summarized all the SNPs which had been reported in IBS and shows its reference.Table S2.Study characteristics analysis: this table shows the most important information for the studies which take into analysis in this SMRA.
Abbreviations
CI:Confidence interval; COMT: Catechol-O-methyltransferase;
GI: Gastrointestinal; GNβ3:β3 subunit of G-protein; GWAS: Genome-wide association studies; HWE: Hardy-Weinberg equilibrium; IBD: Inflammation bowel disease; IBS: Irritable bowel syndrome; IBS-C: Constipation
predominant IBS; IBS-D: Diarrhea predominant IBS; IBS-M: Mixture of diarrhea and constipation IBS; IBS-U: Unsubtyped IBS; IL: Interleukin; MeSH: Medical subject headings; OR: Odds ratios; SERT: Serotonin transporter; SNPs: Single nucleotide polymorphisms; TNF: Tumor necrosis factor
Acknowledgements
We thank Dr. Yanyan Shi of the department of Epidemiology of Peking University Third Hospital for her help on statistical methods and literature retrieval.
Authors’contributions
Study concept, interpretation of data and critical revision: LD. Literatures review and data analysis: SZ, BW and QJ. Drafting of the manuscript: SZ. Obtained funding: LD. All authors read and approved the final manuscript.
Funding
The studies were supported by the“National Natural Science Foundation of China (81670491)”and“The Capital Health Research and Development of Special Found (2016-2-4093)”that does not have its role in the design of the study and collection, analysis, and interpretation of data and in writing the manuscript.
Availability of data and materials
The datasets used and/or analyzed during the current study are available from the corresponding author on reasonable request.
Ethics approval and consent to participate Not applicable.
Consent for publication Not applicable.
Competing interests
The authors declare that they have no competing interests.
Received: 1 April 2019 Accepted: 1 October 2019
References
1. Ford AC, Lacy BE, Talley NJ. Irritable bowel syndrome. New Engl J Med. 2017;376(26):2566–78.
2. Siah K, Gong X, Yang XJ, Whitehead WE, Chen M, Hou X, Pratap N, Ghoshal UC, Syam AF, Abdullah M, et al. Rome Foundation-Asian working team report: Asian functional gastrointestinal disorder symptom clusters. Gut. 2018;67(6):1071–7.
3. Holtmann GJ, Ford AC, Talley NJ. Pathophysiology of irritable bowel syndrome. Lancet Gastroenterol Hepatol. 2016;1(2):133–46.
4. Lembo A, Zaman M, Jones M, Talley NJ. Influence of genetics on irritable bowel syndrome, gastro-oesophageal reflux and dyspepsia: a twin study. Aliment Pharmacol Ther. 2007;25(11):1343–50.
5. Kalantar JS, Locke GR, Zinsmeister AR, Beighley CM, Talley NJ. Familial aggregation of irritable bowel syndrome: a prospective study. Gut. 2003; 52(12):1703–7.
6. Waehrens R, Li X, Sundquist J, Sundquist K, Zoller B. Perinatal and familial risk factors for irritable bowel syndrome in a Swedish national cohort. Scand J Gastroenterol. 2018;53(5):559–66.
7. Brant SR, Okou DT, Simpson CL, Cutler DJ, Haritunians T, Bradfield JP, Chopra P, Prince J, Begum F, Kumar A, et al. Genome-wide association study identifies African-specific susceptibility loci in African Americans with inflammatory bowel disease. Gastroenterology. 2017;152(1):206–17. 8. Lin Z, Wang Z, Hegarty JP, Lin TR, Wang Y, Deiling S, Wu R, Thomas NJ,
Floros J. Genetic association and epistatic interaction of the interleukin-10 signaling pathway in pediatric inflammatory bowel disease. World J Gastroenterol. 2017;23(27):4897–909.
9. Zhang ZF, Duan ZJ, Wang LX, Yang D, Zhao G, Zhang L. The serotonin transporter gene polymorphism (5-HTTLPR) and irritable bowel syndrome: a meta-analysis of 25 studies. BMC Gastroenterol. 2014;14:23.
10. Czogalla B, Schmitteckert S, Houghton LA, Sayuk GS, Camilleri M, Olivo-Diaz A, Spiller R, Wouters MM, Boeckxstaens G, Bermejo JL, et al. A meta-analysis of immunogenetic case-control association studies in irritable bowel syndrome. Neurogastroenterol Motil. 2015;27(5):717–27.
11. Pan ZG, Xiao C, Su DX. No association of G-protein beta polypeptide 3 polymorphism with irritable bowel syndrome: evidence from a meta-analysis. World J Gastroenterol. 2014;20(20):6345–52.
12. Beyder A, Mazzone A, Strege PR, Tester DJ, Saito YA, Bernard CE, Enders FT, Ek WE, Schmidt PT, Dlugosz A, et al. Loss-of-function of the voltage-gated Sodium Channel Na(V)1.5 (Channelopathies) in patients with irritable bowel syndrome. Gastroenterology. 2014;146(7):1659–68.
13. Bashashati M, Rezaei N, Bashashati H, Shafieyoun A, Daryani NE, Sharkey KA, Storr M. Cytokine gene polymorphisms are associated with irritable bowel syndrome: a systematic review and meta-analysis. Neurogastroenterol Motil. 2012;24(12):1102–566.
14. Gonzalez JR, Carrasco JL, Dudbridge F, Armengol L, Estivill X, Moreno V. Maximizing association statistics over genetic models. Genet Epidemiol. 2008;32(3):246–54.
15. Yamada R, Okada Y. An optimal dose-effect mode trend test for SNP genotype tables. Genet Epidemiol. 2009;33(2):114–27.
16. Ahn K, Haynes C, Kim W, Fleur RS, Gordon D, Finch SJ. The effects of SNP genotyping errors on the power of the Cochran-Armitage linear trend test for case/control association studies. Ann Hum Genet. 2007;71(Pt 2):249–61. 17. Xu T, Li X, Wang W, Hu P, Du F. Detection of publication bias in
18. Henstrom M, D’Amato M. Genetics of irritable bowel syndrome. Mol Cell Pediatr. 2016;3(1):7.
19. Ek WE, Reznichenko A, Ripke S, Niesler B, Zucchelli M, Rivera NV, Schmidt PT, Pedersen NL, Magnusson P, Talley NJ, et al. Exploring the genetics of irritable bowel syndrome: a GWA study in the general population and replication in multinational case-control cohorts. Gut. 2015;64(11):1774–82. 20. Holliday EG, Attia J, Hancock S, Koloski N, McEvoy M, Peel R, D'Amato M,
Agreus L, Nyhlin H, Andreasson A, et al. Genome-wide association study identifies two novel genomic regions in irritable bowel syndrome. Am J Gastroenterol. 2014;109(5):770–2.
21. Bonfiglio F, Zheng T, Garcia-Etxebarria K, Hadizadeh F, Bujanda L, Bresso F, Agreus L, Andreasson A, Dlugosz A, Lindberg G, et al. Female-specific association between variants on chromosome 9 and self-reported diagnosis of irritable bowel syndrome. Gastroenterology. 2018;155(1):168–79. 22. Strege PR, Mazzone A, Bernard CE, Neshatian L, Gibbons SJ, Saito YA, Tester
DJ, Calvert ML, Mayer EA, Chang L, et al. Irritable bowel syndrome patients have SCN5A channelopathies that lead to decreased NaV1.5 current and mechanosensitivity. Am J Physiol Gastrointest Liver Physiol. 2018;314(4): G494–503.
23. Romero P, Schmitteckert S, Wouters MM, Houghton LA, Czogalla B, Sayuk GS, Boeckxstaens GE, Guenther P, Holland-Cunz S, Niesler B. No association between the common calcium-sensing receptor polymorphism rs1801725 and irritable bowel syndrome. BMC Med Genet. 2015;16:110.
24. Orand A, Gupta A, Shih W, Presson AP, Hammer C, Niesler B, Heendeniya N, Mayer EA, Chang L. Catecholaminergic gene polymorphisms are associated with GI symptoms and morphological brain changes in irritable bowel syndrome. PLoS One. 2015;10(8):e135910.
25. Choi YJ, Hwang SW, Kim N, Park JH, Oh JC, Lee DH. Association between SLC6A4 serotonin transporter gene Lainked polymorphic region and ADRA2A -1291C>G and irritable bowel syndrome in Korea. J Neurogastroenterol Motil. 2014;20(3):388–99.
26. Kim HJ, Camilleri M, Carlson PJ, Cremonini F, Ferber I, Stephens D, McKinzie S, Zinsmeister AR, Urrutia R. Association of distinct alpha (2) adrenoceptor and serotonin transporter polymorphisms with constipation and somatic symptoms in functional gastrointestinal disorders. Gut. 2004;53(6):829–37. 27. Dand N, Mucha S, Tsoi LC, Mahil SK, Stuart PE, Arnold A, Baurecht H, Burden
AD, Callis DK, Chandran V, et al. Exome-wide association study reveals novel psoriasis susceptibility locus at TNFSF15 and rare protective alleles in genes contributing to type I IFN signalling. Hum Mol Genet. 2017;26(21):4301–13. 28. Li H, Song J, Niu G, Zhang H, Guo J, Shih DQ, Targan SR, Zhang X. TL1A
blocking ameliorates intestinal fibrosis in the T cell transfer model of chronic colitis in mice. Pathol Res Pract. 2018;214(2):217–27.
29. Liu JZ, van Sommeren S, Huang H, Ng SC, Alberts R, Takahashi A, Ripke S, Lee JC, Jostins L, Shah T, et al. Association analyses identify 38 susceptibility loci for inflammatory bowel disease and highlight shared genetic risk across populations. Nat Genet. 2015;47(9):979–86.
30. Slebioda TJ, Bojarska-Junak A, Cyman M, Landowski P, Kaminska B, Celinski K, Kmiec Z. Expression of death receptor 3 on peripheral blood mononuclear cells differes in adult IBD patients and children with newly diagnosed IBD. Cytometry B Clin Cytom. 2017;92(2):165–9.
31. Schmechel S, Konrad A, Diegelmann J, Glas J, Wetzke M, Paschos E, Lohse P, Goke B, Brand S. Linking genetic susceptibility to Crohn's disease with Th17 cell function: IL-22 serum levels are increased in Crohn's disease and correlate with disease activity and IL23R genotype status. Inflamm Bowel Dis. 2008;14(2):204–12.
32. Frydecka D, Pawlowski T, Pawlak D, Malyszczak K. Functional polymorphism in the interleukin 6 (IL6) gene with respect to depression induced in the course of interferon-alpha and ribavirin treatment in chronic hepatitis patients. Arch Immunol Ther Exp. 2016;64(Suppl 1):169–75. 33. Compare D, Rocco A, Coccoli P, Angrisani D, Sgamato C, Iovine B,
Salvatore U, Nardone G. Lactobacillus casei DG and its postbiotic reduce the inflammatory mucosal response: an ex-vivo organ culture model of post-infectious irritable bowel syndrome. BMC Gastroenterol. 2017;17(1):53.
34. O'Mahony L, McCarthy J, Kelly P, Hurley G, Luo F, Chen K, O'Sullivan GC, Kiely B, Collins JK, Shanahan F, et al. Lactobacillus and bifidobacterium in irritable bowel syndrome: symptom responses and relationship to cytokine profiles. Gastroenterology. 2005;128(3):541–51.
35. Katsumata R, Shiotani A, Matsumoto H, Fujita M, Haruma K. Tu1790 TPH1 and 5-HTT Gene Polymorphisms Affect Quality of Life of the Patients With
Diarrhea-Predominant Irritable Bowel Syndrome. Gastroenterology. 2016; 150(4, Supplement 1):S947–8.
36. Karling P, Danielsson A, Wikgren M, Soderstrom I, Del-Favero J, Adolfsson R, Norrback KF. The relationship between the val158met catechol-O-methyltransferase (COMT) polymorphism and irritable bowel syndrome. PLoS One. 2011;6(3):e18035.
37. Wang Y, Wu Z, Qiao H, Zhang Y. A genetic association study of single nucleotide polymorphisms in GNbeta3 and COMT in elderly patients with irritable bowel syndrome. Med Sci Monit. 2014;20:1246–54.
38. Qin SY, Jiang HX, Lu DH, Zhou Y. Association of interleukin-10
polymorphisms with risk of irritable bowel syndrome: a meta-analysis. World J Gastroenterol. 2013;19(48):9472–80.
Publisher’s Note