R E S E A R C H
Open Access
Comparison of field- and satellite-based
vegetation cover estimation methods
Dongwook W. Ko
1*, Dasom Kim
1, Amartuvshin Narantsetseg
2and Sinkyu Kang
3Abstract
Background:Monitoring terrestrial vegetation cover condition is important to evaluate its current condition and to identify potential vulnerabilities. Due to simplicity and low cost, point intercept method has been widely used in evaluating grassland surface and quantifying cover conditions. Field-based digital photography method is gaining popularity for the purpose of cover estimate, as it can reduce field time and enable additional analysis in the future. However, the caveats and uncertainty among field-based vegetation cover estimation methods is not well known, especially across a wide range of cover conditions. We compared cover estimates from point intercept and digital photography methods with varying sampling intensities (25, 49, and 100 points within an image), across 61 transects in typical steppe, forest steppe, and desert steppe in central Mongolia. We classified three photosynthetic groups of cover important to grassland ecosystem functioning: photosynthetic vegetation, non-photosynthetic vegetation, and bare soil. We also acquired normalized difference vegetation index from satellite image comparison with the field-based cover.
Results:Photosynthetic vegetation estimates by point intercept method were correlated with normalized
difference vegetation index, with improvement when non-photosynthetic vegetation was combined. For digital photography method, photosynthetic and non-photosynthetic vegetation estimates showed no correlation with normalized difference vegetation index, but combining of both showed moderate and significant correlation, which slightly increased with greater sampling intensity.
Conclusions:Results imply that varying greenness is playing an important role in classification accuracy confusion. We suggest adopting measures to reduce observer bias and better distinguishing greenness levels in combination with multispectral indices to improve estimates on dry matter.
Keywords:Point intercept, Digital photography, Land cover estimate, NDVI, Photosynthetic vegetation, Greenness
Background
Defined as“land covered with herbaceous plants with less than 10% trees and shrub cover”(White et al. 2000), grass-land is an important ecosystem which dominates much of the global terrestrial ecosystem. Grasslands provide a wide range of ecological services across the world, including critical resources for nomadic livelihood, biodiversity, car-bon storage, water and nutrient cycling, and soil erosion protection (Mosier et al. 1991, White et al. 2000).
Unfortunately, grassland has been subject to large-scale degradation, causing serious ecological and social problems in various geographical regions. In northeast
Asia, for example, serious social and ecological damages are caused by intensive yellow dust phenomena, which frequently originates from the degraded grassland in Mongolia (Phadnis and Carmichael 2000, In and Park 2002). In Mongolia, overgrazing and drought conditions have played a significant role in grassland degradation (McCarthy 2001). Such conditions make the grassland ecosystem more vulnerable to dzud, which occurs in the severe winter following a suboptimal growing season, resulting in high level of livestock mortality and social instability (Fernández-Giménez et al. 2015).
Considering the importance of grassland ecosystem to a wide range of human societies and ecological systems, accurate monitoring of vegetation status in grasslands is important. In representing grassland condition, quantify-ing land cover type is one of the most widely used * Correspondence:[email protected]
1Department of Forest Environmental System, Kookmin University, Seoul, Republic of Korea
Full list of author information is available at the end of the article
indicators, through classifying and proportioning the land cover in several categories such as vegetation, bare ground, and water (Meyer and Turner 1994). One of the most popular field methods to quantify land cover type is the point interception method, due to its simplicity, unbiasedness, and low cost (Canfield 1941, Ramsey 1979, Sutherland 2006). Point interception method is an extremely efficient method, but the method is known to underestimate cover types with uneven or patchy distri-bution (Buckland et al. 2007). Another alternative is the quadrats method, which estimates percent ground cover within a quadrat divided into several cover classes, or cover abundance scores, such as a Braun-Blanquet method (Daubenmire 1959). However, the estimated land cover is often known to be dependent upon the method utilized, because of their sensitivity to plant size, growth form, and crown density (Floyd and Anderson 1987).
Analyzing digital images acquired from the field can be advantageous since the production of permanent im-ages enables the researcher to reanalyze the data later on with more advanced methods and softwares (Boyd and Svejcar 2005). This method can be particularly helpful since it can drastically reduce time spent in the field and control surveyor-bias (Booth et al. 2005). A study based on turf-grass dominated sites indicated that compared with line intersect, digital photography analysis was able to generate accurate results in much less time (Richardson et al. 2001). Another study which compared digital photo analysis and point intercept method also suggested that the results between the two methods were simi-lar when sufficient number of plots were combined together (Booth et al. 2005).
Remote sensing technology is highly useful for system-atic and long-term vegetation cover monitoring (Iverson et al. 1989, Gemmell 1999, Turner et al. 2007, Yim et al. 2010). Through the use of various vegetation indices (e.g., normalized difference vegetation index (NDVI)), it can represent vegetation condition based on analyzing the spectral characteristics of the grassland (Cui et al. 2011). However, the method still requires ground truth data to validate its results. Moreover, studies have shown that establishing consistent guidelines and understand-ing the properties of field survey methods is critical in improving proper integration of remotely sensed and field-based data (Reinke et al. 2006). Considering sam-pling density for the spatial scale of interest, and spatial heterogeneity of the target vegetation type are some of the important aspects to consider in deciding which survey method to use.
Meanwhile, greenness (photosynthetically active com-ponent) is not the only important factor in grassland ecosystems. Due to the wide range of seasonal condi-tions of temperature, precipitation, wind, fire, grazing, and human management of rangeland, the amount of
dry matter on grasslands can provide valuable information (Bradley and Mustard 2005, Guerschman et al. 2009). For example, carbon and nutrient cycling, surface reflection, soil erosion, land degradation, and phonology assessment can all benefit from information on non-photosynthetic biomass, which makes dry matter estimation a very im-portant factor in evaluating the condition of grassland ecosystem (Byambakhuu et al. 2010, Stoner et al. 2016).
In light of the information above, what should researchers expect from a variety of field methods and survey target components in grasslands under various conditions? To answer this question, we compared per-formances of three different grassland cover estimation methods: field point intercept, digital photography analysis with varying sampling densities, and NDVI acquired from a remote sensing platform (MODIS) were compared. We compared results for three ecosystem functional components in grassland: photosynthetic vegetation, non-photosynthetic vegetation, and bare soil. We also explored the effect of various grassland conditions, by comparing results across typical steppe, desert steppe, and forest steppe in central Mongolia.
Methods
Study area
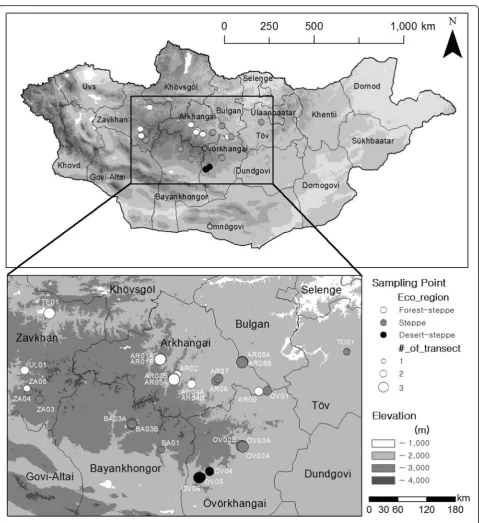
In this study, sites are distributed across the central part of Mongolia, between the latitude of 48° 48′0.72″to 45° 41′3.12″N and longitude of 96° 50′56.88″to 105° 50′ 45.06″E, within Tov, Arkhangai, Zavkhan, Bayankhon-gor, and Ovorkhangai aimag (Fig. 1, Table 1). Central Mongolian steppe zone can be roughly grouped into typical steppe, forest steppe, desertified steppe, and des-ert steppe based on the botanico-geographical groups (Karamysheva and Khramtsov 1995). In this study, based on the location and environment of the sites, three dif-ferent steppe types were covered by the site locations: forest steppe, typical steppe, and desert steppe. Central Mongolian steppe is characterized by high elevation (1043–1350 m) and sandy loam with abundant gravels, with higher number of livestock compared to the eastern Mongolian steppe (Hirobe and Kondo 2012). The central Mongolian steppe covers a range of vegetation character-istics and environmental conditions, dominated by various grass and sedges (Stipaspp. andAchnatherumspp.), pea-shrubs (Caraganaspp.), and sages (Artemisiaspp.).
Field survey
photography. For both field surveys, one to three 30-m parallel line transects were established, at least 30 m away from each other. Five survey crew carried out the survey, who were ecologists and botanists who had at least graduate-level training.
For point intercept cover estimate, cover type was re-corded at points at 1-m interval (30 points per transect whenever terrain allows). For digital photography estimate,
digital photos of the surface was taken at 3-m intervals (Samsung ES95, 16.1MP), total of ten photographs per transect. Photos were taken at 1.2 m height, with the photograph plane parallel to ground surface. Later, digital images were cropped to cover approximately 2 m2(164 × 123 cm) of the surface area with the final resolution of 2304 × 1728 pixels. A total of 1529 points and 549 digital photographs were collected.
For both point intercept cover estimate, six major cat-egories were initially used in the field to record plant functional types as cover types at each point: grass, forb, shrub, litter, bare soil, and rock. For the final analysis, cover types were reclassified into functional groups based on photosynthetic properties considering their im-portance in representing a wide range of grassland con-ditions (sensu Guerschmann et al. 2009). For comparing cover estimates among field-based methods, photosyn-thetic vegetation (PV) cover was estimated by combining grass, forb, and half of shrub, and non-photosynthetic vegetation (NPV) was estimated by combining litter and half of shrub. Shrub cover was equally assigned to PV and NPV, considering that it is a mix of photosynthetic leaf part and non-photosynthetic woody part. Bare soil and rock were combined to bare soil (BS). Potential photosynthetic vegetation (PPV) was also calculated as the sum of PV and NPV. Since remainder of PPV is BS,
we only estimated and analyzed the cover of PV, NPV, and PPV based on the total point frequency assigned to the corresponding cover types.
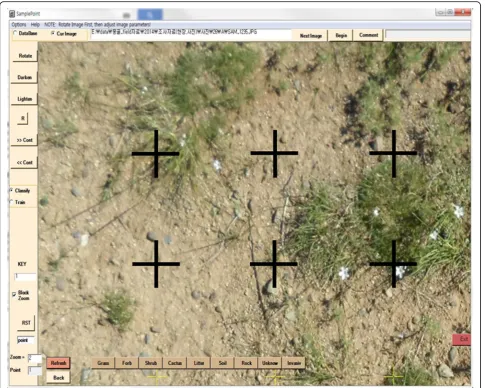
For the digital photography cover estimate, photo-graphs were analyzed using the “SamplePoint” software, which assists classifying individual pixels within a photo-graph (Booth et al. 2006). We generated regularly distributed crosshairs over each photographs to classify the overlapping single pixels (Fig. 2). To consider the ef-fects of sampling intensity in digital photograph method, we used a variety of sampling intensities, by generating 25, 49, and 100 regularly spaced crosshairs in each photography (5 × 5, 7 × 7, and 10 × 10 sampling points, hereafter mentioned as SP25, SP49, and SP100, respect-ively). Each pixel under the crosshair was classified into six cover types following the same classification scheme used for the field point intercept method and then was reclassified into PV, NPV, and BS. PPV was also Table 1Site description and location of plots
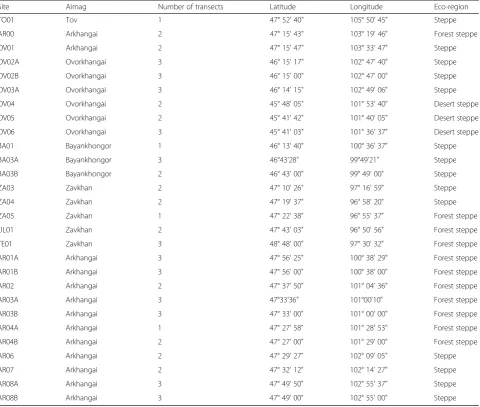
Site Aimag Number of transects Latitude Longitude Eco-region
TO01 Tov 1 47° 52' 40" 105° 50' 45" Steppe
AR00 Arkhangai 2 47° 15' 43" 103° 19' 46" Forest steppe
OV01 Arkhangai 2 47° 15' 47" 103° 33' 47" Steppe
OV02A Ovorkhangai 3 46° 15' 17" 102° 47' 40" Steppe
OV02B Ovorkhangai 3 46° 15' 00" 102° 47' 00" Steppe
OV03A Ovorkhangai 3 46° 14' 15" 102° 49' 06" Steppe
OV04 Ovorkhangai 2 45° 48' 05" 101° 53' 40" Desert steppe
OV05 Ovorkhangai 2 45° 41' 42" 101° 40' 05" Desert steppe
OV06 Ovorkhangai 3 45° 41' 03" 101° 36' 37" Desert steppe
BA01 Bayankhongor 1 46° 13' 40" 100° 36' 37" Steppe
BA03A Bayankhongor 3 46°43'28" 99°49'21" Steppe
BA03B Bayankhongor 2 46° 43' 00" 99° 49' 00" Steppe
ZA03 Zavkhan 2 47° 10' 26" 97° 16' 59" Steppe
ZA04 Zavkhan 2 47° 19' 37" 96° 58' 20" Steppe
ZA05 Zavkhan 1 47° 22' 38" 96° 55' 37" Forest steppe
UL01 Zavkhan 2 47° 43' 03" 96° 50' 56" Forest steppe
TE01 Zavkhan 3 48° 48' 00" 97° 30' 32" Forest steppe
AR01A Arkhangai 3 47° 56' 25" 100° 38' 29" Forest steppe
AR01B Arkhangai 3 47° 56' 00" 100° 38' 00" Forest steppe
AR02 Arkhangai 2 47° 37' 50" 101° 04' 36" Forest steppe
AR03A Arkhangai 3 47°33'36" 101°00'10" Forest steppe
AR03B Arkhangai 3 47° 33' 00" 101° 00' 00" Forest steppe
AR04A Arkhangai 1 47° 27' 58" 101° 28' 53" Forest steppe
AR04B Arkhangai 2 47° 27' 00" 101° 29' 00" Forest steppe
AR06 Arkhangai 2 47° 29' 27" 102° 09' 05" Steppe
AR07 Arkhangai 2 47° 32' 12" 102° 14' 27" Steppe
AR08A Arkhangai 3 47° 49' 50" 102° 55' 37" Steppe
calculated as the sum of PV and NPV. To ensure consistency in classification, we adopted the following measures: (1) all classifications were made on the same computer-monitor set to maintain the visual characteris-tics of the images and (2) before actual classification, ob-servers spent 2 h together training on the same images.
Satellite imagery and NDVI estimates
In arid or semi-arid region, normalized difference vegetation index (NDVI) is often used for the estima-tion of green vegetaestima-tion cover (Pickup et al. 1993, Chen et al. 2006) and productivity (Chen et al. 2004, Wang et al. 2004). NDVI is based on the spectral properties generated by photosynthetic process: it compares the ratio between visible red light, which is strongly absorbed, and near-infrared, which is strongly reflected by green vegetation. A variety of satellite platforms provides spectral information to calculate
NDVI. In this study, we used MODIS (moderate reso-lution imaging spectroradiometer) products for its reliability of image acquirement in Mongolia espe-cially considering the non-optimal sky conditions that frequents the growing season (Jang et al. 2010). Spe-cifically, the 16-day composite products (MOD13Q1, 250 m resolution) based on MODIS Level-2G (daily) surface reflectance data with the acquisition date of July 12–27 (2013) were acquired for the NDVI value. NDVI from the corresponding pixel(s) for the study sites was extracted from the images and then was compared with point intercept and digital photog-raphy cover estimates. For comparing NDVI and field-based surveys, the field cover estimates of PV, NPV, and PPV were used to evaluate how different surface components, especially the dry matter, influ-enced the fit against the spectral properties of NDVI (Asner 1998, Booth et al. 2006).
Statistical analysis
Cover estimates from point intercept and digital photog-raphy method with varying intensity (SP25, SP49, and SP100) were compared by calculating summary statistics (mean, median, minimum, maximum, range, standard deviation (SD), and coefficient of variation (CV)) and conducting correlation analysis. Analysis of variance and Tukey’s HSD test was also conducted to analyze differ-ences between cover estimates of each method. For fur-ther insight, field estimates were grouped by steppe types for comparisons as well. NDVI estimates were compared among steppe types by calculating summary statistics, analysis of variance, and Tukey’s HSD test. For comparison of field-based estimates against
MODIS-NDVI, correlation analysis was conducted. All statistical analyses were conducted with R (version 3.2.1).
Results and discussion
Comparison of field-based cover estimates—point intercept and digital photography
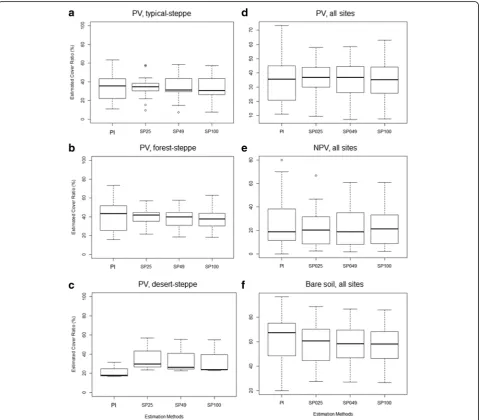
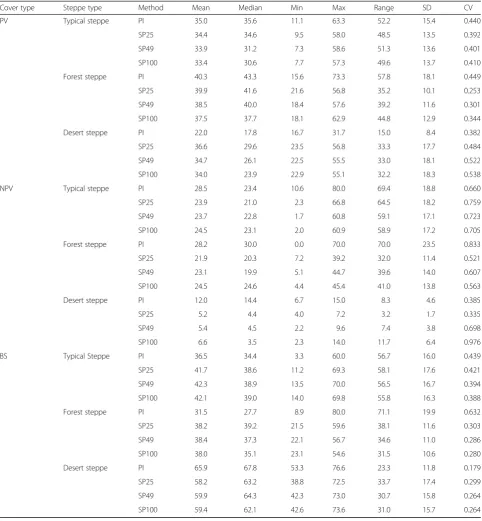
Both field-based mean and median estimates of PV, NPV, and BS did not differ among field-based methods, even when steppe types were considered (α= 0.01, Fig. 3, Table 2). Considering PV estimates, differences were only noticeable in desert steppe, but not significant (α= 0.01, Table 2, Fig. 3a). Median of PV cover estimate in desert steppe was 17.8, 29.6, 26.1, and 23.9% for point intercept, SP25, SP49, and SP100, respectively, and range
was smaller in point intercept method (15.0%) compared to digital photograph methods (32.2–33.3%) (Table 2). This difference likely resulted from the sparse vegetation conditions in desert steppe, which can penalize cover esti-mates based on smaller sampling density (Milberg et al. 2008). This is a common issue, particularly for estimating abundance of rare components in environments with high level of spatial variability (Bergstedt et al. 2009, Burg et al. 2015). Overall, digital photography method seems to
retain its consistency regardless of sampling density across most statistics in PV cover estimates.
Mean NPV cover estimates did not differ significantly among field-based methods (α= 0.01, Table 2, Fig. 3b). While most statistics were similar to each other in typical steppe and forest steppe of NPV, the wider range of point intercept method in forest-steppe sites with extremely patchy or heterogeneous patterns of cover conditions is noticeable. For example, site UL01 had very Table 2Summary statistics of PV, NPV, and BS cover estimates of steppe types and field-based methods
Cover type Steppe type Method Mean Median Min Max Range SD CV
PV Typical steppe PI 35.0 35.6 11.1 63.3 52.2 15.4 0.440
SP25 34.4 34.6 9.5 58.0 48.5 13.5 0.392
SP49 33.9 31.2 7.3 58.6 51.3 13.6 0.401
SP100 33.4 30.6 7.7 57.3 49.6 13.7 0.410
Forest steppe PI 40.3 43.3 15.6 73.3 57.8 18.1 0.449
SP25 39.9 41.6 21.6 56.8 35.2 10.1 0.253
SP49 38.5 40.0 18.4 57.6 39.2 11.6 0.301
SP100 37.5 37.7 18.1 62.9 44.8 12.9 0.344
Desert steppe PI 22.0 17.8 16.7 31.7 15.0 8.4 0.382
SP25 36.6 29.6 23.5 56.8 33.3 17.7 0.484
SP49 34.7 26.1 22.5 55.5 33.0 18.1 0.522
SP100 34.0 23.9 22.9 55.1 32.2 18.3 0.538
NPV Typical steppe PI 28.5 23.4 10.6 80.0 69.4 18.8 0.660
SP25 23.9 21.0 2.3 66.8 64.5 18.2 0.759
SP49 23.7 22.8 1.7 60.8 59.1 17.1 0.723
SP100 24.5 23.1 2.0 60.9 58.9 17.2 0.705
Forest steppe PI 28.2 30.0 0.0 70.0 70.0 23.5 0.833
SP25 21.9 20.3 7.2 39.2 32.0 11.4 0.521
SP49 23.1 19.9 5.1 44.7 39.6 14.0 0.607
SP100 24.5 24.6 4.4 45.4 41.0 13.8 0.563
Desert steppe PI 12.0 14.4 6.7 15.0 8.3 4.6 0.385
SP25 5.2 4.4 4.0 7.2 3.2 1.7 0.335
SP49 5.4 4.5 2.2 9.6 7.4 3.8 0.698
SP100 6.6 3.5 2.3 14.0 11.7 6.4 0.976
BS Typical Steppe PI 36.5 34.4 3.3 60.0 56.7 16.0 0.439
SP25 41.7 38.6 11.2 69.3 58.1 17.6 0.421
SP49 42.3 38.9 13.5 70.0 56.5 16.7 0.394
SP100 42.1 39.0 14.0 69.8 55.8 16.3 0.388
Forest steppe PI 31.5 27.7 8.9 80.0 71.1 19.9 0.632
SP25 38.2 39.2 21.5 59.6 38.1 11.6 0.303
SP49 38.4 37.3 22.1 56.7 34.6 11.0 0.286
SP100 38.0 35.1 23.1 54.6 31.5 10.6 0.280
Desert steppe PI 65.9 67.8 53.3 76.6 23.3 11.8 0.179
SP25 58.2 63.2 38.8 72.5 33.7 17.4 0.299
SP49 59.9 64.3 42.3 73.0 30.7 15.8 0.264
high bare soil cover but moderate PV cover, and none of the points was able to capture the NPV present at site. Meanwhile, in site AR04B, dominated by Alium spp. with extremely fine leaves in both green and desiccated state, field observations performed poorly in capturing the fine-textured green cover and classified most of them as NPV (70%), while detailed observation of digital photograph method was capable of capturing the nu-anced greenness and classifying them as PV (57–63%) rather than NPV (4–14%).
In classifying BS, most estimates showed high agree-ment, and mean cover estimates were not significantly different from each other (α= 0.01, Table 2, Fig. 3c). It seems that point intercept method had a relatively high level of confusion in forest-steppe types as suggested by its large range (71%), which occurred in sites with very low or high level of NPV with finely textured vegetation (UL01 and AR01A).
When all sites were combined and compared, mean cover estimates of PV, NPV, and BS did not show signifi-cant differences among methods (Fig. 3d–f ). Ranges from point intercept method was relatively larger compared to digital photography methods, suggesting that digital pho-tography methods may ensure better consistency in cover estimates. A number of studies pointed out the issue of over- or underestimation of grassland cover from field methods (Dethier et al. 1993, Fensholt et al. 2004). Dethier et al. (1993) pointed out that point intercept method is subject to over-estimating cover compared to photo analysis, which is inherently constrained by the smaller number of sample points at field. However, this did not consistently apply to PV or NPV estimates in our study in any of the steppe types. Moreover, PV esti-mates from point intercept method in desert-steppe sites was slightly higher than estimates from digital photography method (Fig. 3).
Correlation analysis of PV, NPV, and PPV cover estimates showed that digital photography methods were highly and significantly correlated with each other (Fig. 4a–c). How-ever, PV estimates of point intercept method were not cor-related with estimates of any of the digital photography methods (Fig. 4a). Interestingly, NPV estimates of point intercept method were significantly correlated, although moderately, with estimates of all digital photography methods (Fig. 4b). These suggest that compared to NPV classification, there is a higher level of disagreement in PV classification between point intercept and digital photog-raphy methods. This mismatch was dramatically reduced
Fig. 4Scatterplot matrix and correlation coefficients of estimated covers between cover types (a-cPV, NPV, and PPV) and field-based methods.Lower left panelsshow scatterplots, andupper right panels
when correlation of PPV among field methods are consid-ered, since estimates of PPV cover from all field methods showed significantly high level of correlation (Fig. 4c). Such confusion of grassland classification may be due to the leaf angle distribution of dominant grass and sedge species, ac-cumulating dry matter, or the overwhelming bare soil in the background (Beck et al. 1990, Guerschman et al. 2009).
Comparison of field-based cover estimates and NDVI
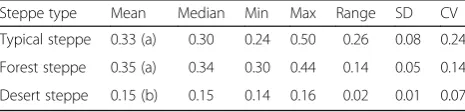
NDVI estimates ranged from 0.14 to 0.50, with most sites showing NDVI values between 0.2 and 0.4 (Table 3). Forest- and typical-steppe NDVI estimates were signifi-cantly higher than the desert-steppe NDVI (p< 0.01, Table 3). Correlation analysis results indicate that PV estimates of point intercept method had moderate and significant correlation with NDVI (Fig. 4a). However, none of the PV estimates from digital photography methods were correlated with NDVI, and none of the field-based NPV estimates were correlated with NDVI (Fig. 4b).
When cover estimates of PPV (combination of PV and NPV) were considered, all methods had moderate and significant correlation with NDVI (p< 0.01, Fig. 4c). In addition, for the point intercept method, correlation of PPV estimates with NDVI slightly improved, compared to the correlation of PV estimate with NDVI (Fig. 4a, c). Results suggest that part of the NDVI-related spectral signal can be traced back to PPV component identified in the field-based methods.
Correlation between field methods and NDVI suggest some important insights. General consensus among ob-servers was that classifications of point intercept method in the field were subject to greater confusion, because of various field conditions experienced, such as time of day, weather, livestock trampling and droppings, and obser-ver conditions. Howeobser-ver, results show that detailed classification of digital photography method may have underestimated PV component by limiting it to distinct-ively green vegetation, while excluding partly green vege-tation, and NPV included vegetation with a wide range of greenness, from slightly desiccated plant materials to very dry materials. In contrast, it is possible that point intercept method included widely varying green compo-nents, which was likely the reason why PV estimate alone had significant and moderately high level of correl-ation with NDVI. Theoretically, NDVI is intended to
represent the photosynthetically active component in the image by considering its characteristics in differential absorption of red and near-infrared spectrum (Beck et al. 1990). However, grassland ecosystems are subject to a widely varying condition of greenness as influenced by phenology and inter- and intra-annual variability (Bradley and Mustard 2005). Therefore, identifying the varying condition and abundance of green and dry mat-ter is very important for evaluating the functional condi-tion of grasslands which often cannot be decisively classified as green or dry. For this reason, researchers suggest that the use of cellulose absorption index (CAI) in addition to vegetation indices (e.g., NDVI) for improv-ing and enrichimprov-ing how surface vegetation components is represented (Guerschman et al. 2009). Our study con-firms that point intercept method at field alone can be prone to errors since PV and NPV could not be easily distinguished, and varying levels of greenness were likely classified as PV. Therefore, evaluating how accurately any of the field methods can distinguish dry matter is subject to further studies by utilizing multispectral im-ages to compare with the estimated CAI and ideally with field method that can differentiate a more detailed grade of greenness.
Moreover, scale and resolution of the data can be im-portant factors when characterizing surface properties (Turner et al. 1989). Although we carefully considered homogeneity of surface properties as site selection criteria, a single pixel from MODIS imagery (250 m resolution) covered a spatial extent that is significantly larger compared to field survey samples, including greater heterogeneity to be represented in the NDVI than we expected. This probably contributed to weaker fit with the field-based cover estimates (Moody and Woodcock 1995). Time scale can also be important, considering the short growing season and the rapidly shifting phenology of Mongolian grasslands (Boone et al. 2005). Since the 16-day composite NDVI was selected for this study, such a time frame may include time-driven phonological difference that may have influenced the results.
Another important factor that may have confounded the results is the observer’s bias. Two types of observer’s bias are acknowledged: (1) bias caused by less-trained ob-server, which can amplify within-observer variation and (2) bias caused by inter-observer differences (Dethier et al. 1993, Bergstedt et al. 2009). For the field-based point intercept method, in particular, we noted that mis-recognition could be a significant factor, even with train-ing sessions before each survey. This is especially true for spatially heterogeneous surface or sites with very sparse green vegetation against extensive bare soil background during mid-day. Ultimately, bias-control is another factor that a researcher must carefully examine as trade-offs Table 3Summary statistics and comparisons of NDVI of each
steppe types (α= 0.01)
Steppe type Mean Median Min Max Range SD CV
Typical steppe 0.33 (a) 0.30 0.24 0.50 0.26 0.08 0.24
Forest steppe 0.35 (a) 0.34 0.30 0.44 0.14 0.05 0.14
among survey methods, in terms of time and labor cost, scale-dependency, and vegetation characteristics. We sug-gest a variety of measures to control the bias of observers such as field training and consistency check among ob-servers before the actual survey begins and for digital pho-tography methods, ensuring the quality and consistency of color and texture representation of visual devices (use identical graphic card and monitor, with color specifica-tions and resolution matched), co-training session for ob-servers to ensure classification consistency, and diversified greenness-levels for classification.
In our study, we suspect that the mismatch between point intercept and digital photography method is a re-sult of how varying range of greenness was treated, as PPV of both methods showed meaningful relationship with NDVI. Aside from this issue, it is notable that greater sampling density in digital photography methods of PPV estimates showed a slightly better fit against NDVI (Fig. 4c). Fit of SP100 and SP49 was slightly better compared to SP25, and there was no difference between SP100 and SP49. Considering the trade-offs between effort and performance, we propose that SP49 has the potential advantage among all methods, given that the confusion of greenness is alleviated, because of the additional virtues of digital photography method: quicker application in the field compared to point intercept method, possibility of re-analysis in the fu-ture when the need arises, and control over observers’ bias (Floyd and Anderson 1987, Boyd and Svejcar 2005, Booth et al. 2006).
Our study suggests the potential of digital photography method to estimate vegetation cover. Digital photog-raphy method showed potential for application to other terrestrial ecosystems, such as forest or wetlands, and to evaluate rapid changes due to disturbances such as drought, grazing, or fire. This is especially relevant with the advent of unmanned aerial vehicle (UAV)-based digital photography for surveying and monitoring terres-trial ecosystems that can further reduce field cost and time (Rango et al. 2009, Cunliffe et al. 2016). While there are numerous sophisticated methods to analyze massive amount of images acquired from UAVs (Hervouet et al. 2011, Bollard-Breen et al. 2015), simple analysis of UAV-acquired images that share common grounds with trad-itional field survey methods, such as point intercept method, proves to be useful in reconstructing and evaluat-ing landscape change in the past and future.
Conclusions
Our study showed that when both PV and NPV were combined, estimates from point intercept method (simul-taneous field data and classification) and digital photog-raphy method (photo taken from field and classification later in the lab) showed moderate agreement against the
satellite-derived NDVI (R2= 0.43 to 0.48,p= <0.01). Point intercept method was more inclusive for a wider range of greenness compared to digital photography method. Greater sampling intensity of digital photography method slightly increased its agreement with NDVI; therefore, considering the efforts required, we suggest 49 points over 2 m2is sufficient. Our study confirms the merits of point intercept method, the simplicity and low cost, but also suggests the potential of the digital photography method because of the possibility of future re-analysis. We suggest that incorporating a more explicit classifi-cation scheme to differentiate greenness may improve cover estimation results for both point intercept and digital photography methods.
Abbreviations
BS:Bare soil; CAI: Cellulose absorption index; MODIS: Moderate resolution imaging spectroradiometer; NDVI: Normalized difference vegetation index; NPV: Non-photosynthetic vegetation; PPV: Potential photosynthetic vegetation; PV: Photosynthetic vegetation; UAV: Unmanned aerial vehicle
Acknowledgements
This work was supported by the research grants from the Korea Forest Service (S121414L090110) and the National Research Foundation of Korea (NRF-201100009423). The authors wish to thank Dowon Lee, Reverend Sungil, Jaebum Kim, and Wanhyuk Park for their assistance in field survey and laboratory work. The field survey was completed under the permission of the Mongolian Academy of Sciences.
Funding
This work was supported by the research grants from the Korea Forest Service (S121414L090110) and the National Research Foundation of Korea (NRF-201100009423). The role of the fund from Korea Forest Service was in remote sensing data analysis and manuscript preparation. The role of the fund from the National Research Foundation of Korea was in the field data collection and initial analysis.
Availability of data materials
The data that support the findings of this study are available from the corresponding author (DWK) upon reasonable request. The data are not publicly available due to sensitive information regarding surface information of the study area.
Authors’contributions
DWK conceived of the study, led its design and coordination, drafted the manuscript, collected and analyzed data and prepared results. DK participated in data collection, classification and remote sensing analysis. AN designed and guided the field survey and analysis methods. SK took part in the analysis and drafting the discussions. All authors read and approved the final manuscript.
Competing interests
The authors declare that they have no competing interests.
Consent for publication
Not applicable.
Ethics approval and consent to participate
Not applicable.
Author details
1Department of Forest Environmental System, Kookmin University, Seoul, Republic of Korea.2Institute of General and Experimental Biology, Mongolian Academy of Sciences, Ulaanbaatar, Mongolia.3Department of Environmental Science, Kangwon National University, Kangwon, Republic of Korea.
References
Asner, G. P. (1998). Biophysical and biochemical sources of variability in canopy reflectance.Remote Sensing of Environment, 64, 234–253.
Beck, L. R., Hutchinson, C. F., & Zauderer, J. (1990). A comparison of greenness measures in two semi-arid grasslands.Climatic Change, 17, 287–303. Bergstedt, J., Westerberg, L., & Milberg, P. (2009). In the eye of the beholder: bias
and stochastic variation in cover estimates.Plant Ecology, 204, 271–283. Bollard-Breen, B., Brooks, J. D., Jones, M. R. L., Robertson, J., Betschart, S., Kung, O.,
Craig Cary, S., Lee, C. K., & Pointing, S. B. (2015). Application of an unmanned aerial vehicle in spatial mapping of terrestrial biology and human disturbance in the McMurdo Dry Valleys, East Antarctica.Polar Biology, 38, 573–578.
Boone, R. B., BurnSilver, S. B., Thornton, P. K., Worden, J. S., & Galvin, K. A. (2005). Quantifying declines in livestock due to land subdivision.Rangeland Ecology & Management, 58, 523–532.
Booth, D. T., Cox, S. E., Fifield, C., Phillips, M., & Williamson, N. (2005). Image analysis compared with other methods for measuring ground cover.Arid Land Research Management, 19, 91–100.
Booth, D. T., Cox, S. E., & Berryman, R. D. (2006). Point sampling digital imagery with“Samplepoint.”.Environmental Monitoring and Assessment, 123, 97–108. Boyd, C. S., & Svejcar, T. J. (2005). A visual obstruction technique for photo
monitoring of willow clumps.Rangeland Ecology & Management, 58, 434–438. Bradley, B. A., & Mustard, J. F. (2005). Identifying land cover variability distinct
from land cover change: cheatgrass in the Great Basin.Remote Sensing of Environment, 94, 204–213.
Buckland, S. T., Borchers, D. L., Johnston, A., Henrys, P. A., & Marques, T. A. (2007). Line transect methods for plant surveys.Biometrics, 63, 989–998.
Burg, S., Rixen, C., Stöckli, V., & Wipf, S. (2015). Observation bias and its causes in botanical surveys on high-alpine summits.Journal of Vegetation Science, 26, 191–200.
Byambakhuu, I., Sugita, M., & Matsushima, D. (2010). Remote sensing of environment spectral unmixing model to assess land cover fractions in Mongolian steppe regions.Remote Sensing of Environment, 114, 2361–2372. Canfield, R. H. (1941). Application of the line interception method in sampling
range vegetation.Journal of Forestry, 39, 388–394.
Chen, Z. M., Babiker, I. S., Chen, Z. X., Komaki, K., Mohamed, M. A. A., & Kato, K. (2004). Estimation of interannual variation in productivity of global vegetation using NDVI data.International Journal of Remote Sensing, 25, 3139–3159.
Chen, X.-L., Zhao, H.-M., Li, P.-X., & Yin, Z.-Y. (2006). Remote sensing image-based analysis of the relationship between urban heat island and land use/cover changes.Remote Sensing of Environment, 104, 133–146.
Cui, G., Lee, W.-K., Kwak, D.-A., Choi, S., Park, T., & Lee, J. (2011). Desertification monitoring by LANDSAT TM satellite imagery.Forest Science and Technology, 7, 110–116.
Cunliffe, A. M., Brazier, R. E., & Anderson, K. (2016). Ultra-fine grain landscape-scale quantification of dryland vegetation structure with drone-acquired structure-from-motion photogrammetry.Remote Sensing of Environment, 183, 129–143. Daubenmire, R. (1959). A canopy-coverage method of vegetational analysis.
Northwest Science, 33, 43–64.
Dethier, M. N., Graham, E. S., Cohen, S., & Tear, L. M. (1993). Visual versus random-point percent cover estimations:“objective”is not always better.Marine Ecology Progress Series, 96, 93–100.
Fensholt, R., Sandholt, I., & Rasmussen, M. S. (2004). Evaluation of MODIS LAI, fAPAR and the relation between fAPAR and NDVI in a semi-arid environment using in situ measurements.Remote Sensing of Environment, 91, 490–507.
Fernández-Giménez, M. E., Batkhishig, B., Batbuyan, B., & Ulambayar, T. (2015). Lessons from the dzud: community-based rangeland management increases the adaptive capacity of Mongolian herders to winter disasters.World Development, 68, 48–65.
Floyd, D. A., & Anderson, J. E. (1987). A comparison of three methods for estimating plant cover.Journal of Ecology, 75, 221–228.
Gemmell, F. (1999). Estimating conifer forest cover with Thematic Mapper data using reflectance model inversion and two spectral indices in a site with variable background characteristics.Remote Sensing of Environment, 69, 105–121. Guerschman, J. P., Hill, M. J., Renzullo, L. J., Barrett, D. J., Marks, A. S., & Botha, E. J.
(2009). Estimating fractional cover of photosynthetic vegetation, non-photosynthetic vegetation and bare soil in the Australian tropical savanna region upscaling the EO-1 Hyperion and MODIS sensors.Remote Sensing of Environment, 113, 928–945.
Hervouet, A., Dunford, R., Piégay, H., Belletti, B., & Trémélo, M.-L. (2011). Analysis of post-flood recruitment patterns in braided-channel rivers at multiple scales
based on an image series collected by unmanned aerial vehicles, ultra-light aerial vehicles, and satellites.GIScience & Remote Sensing, 48, 50–73. Hirobe, M., & Kondo, J. (2012). Effects of climate and grazing on surface soil in
grassland. In N. Yamamura, N. Fujita, & A. Maekawa (Eds.),The Mongolian Ecosystem Network: Environmental Issues Under Climate and Social Changes
(pp. 105–114). Japan: Springer.
In, H.-J., & Park, S.-U. (2002). A simulation of long-range transport of Yellow Sand observed in April 1998 in Korea.Atmospheric Environment, 36, 4173–4187. Iverson, L. R., Cook, E. A., & Graham, R. L. (1989). A technique for extrapolating and validating forest cover across large regions calibrating AVHRR data with TM data.International Journal of Remote Sensing, 10, 1805–1812.
Jang, K., Kang, S., Kim, J., Lee, C. B., Kim, T., Kim, J., Hirata, R., & Saigusa, N. (2010). Mapping evapotranspiration using MODIS and MM5 four-dimensional data assimilation.Remote Sensing of Environment, 114, 657–673.
Karamysheva, Z. V., & Khramtsov, V. N. (1995). The steppes of Mongolia. Braun-Blanquetia, 17, 5–79.
McCarthy, J. J. (2001). Climate change 2001: impacts, adaptation, and vulnerability: contribution of working group II to the Third Assessment Report of the Intergovernmental Panel on Climate Change. Cambridge: Cambridge University Press.
Meyer, W. B., Turner II, B. L. (1994). Changes in land use and land cover: a global perspective. Cambridge: Cambridge University Press.
Milberg, P., Bergstedt, J., Fridman, J., Odell, G., & Westerberg, L. (2008). Observer bias and random variation in vegetation monitoring data.Journal of Vegetation Science, 19, 633–644.
Moody, A., & Woodcock, C. E. (1995). The influence of scale and the spatial characteristics of landscapes on land-cover mapping using remote sensing.
Landscape Ecology, 10, 363–379.
Mosier, A., Schimel, D., Valentine, D., Bronson, K., & Parton, W. (1991). Methane and nitrous oxide fluxes in native, fertilized and cultivated grasslands.Nature, 350, 330–332.
Phadnis, M. J., & Carmichael, G. R. (2000). Numerical investigation of the influence of mineral dust on the tropospheric chemistry of East Asia.Journal of Atmospheric Chemistry, 36, 285–323.
Pickup, G., Chewings, V. H., & Nelson, D. J. (1993). Estimating changes in vegetation cover over time in arid rangelands using Landsat MSS data.
Remote Sensing of Environment, 43, 243–263.
Ramsey, F. L. (1979). Parametric models for line transect surveys.Biometrika, 66, 505–512.
Rango, A., Laliberte, A., Herrick, J. E., Winters, C., Havstad, K., Steele, C., & Browning, D. (2009). Unmanned aerial vehicle-based remote sensing for rangeland assessment, monitoring, and management.Journal of Applied Remote Sensing, 3, 33542.
Reinke, K., Reinke, K., Jones, S., & Jones, S. (2006). Integrating vegetation field surveys with remotely sensed data.Ecological Management and Restoration, 7, S18–S23.
Richardson, M. D., Karcher, D. E., & Purcell, L. C. (2001). Quantifying turfgrass cover using digital image analysis.Crop Science, 41, 1884–1888.
Stoner, D. C., Sexton, J. O., Nagol, J., Bernales, H. H., & Edwards, T. C. (2016). Ungulate reproductive parameters track satellite observations of plant phenology across latitude and climatological regimes.PloS One, 11, e0148780.
Sutherland, W. J. (2006). Ecological census techniques: a handbook. Cambridge: Cambridge University Press.
Turner, M. G., Dale, V. H., & Gardner, R. H. (1989). Predicitng across scales: theory development and testing.Landscape Ecology, 3, 245–252.
Turner, B. L., Lambin, E. F., & Reenberg, A. (2007). The emergence of land change science for global environmental change and sustainability.Proceedings of the National Academy of Sciences, 104, 20666–20671.
Wang, J., Rich, P. M., Price, K. P., & Kettle, W. D. (2004). Relations between NDVI and tree productivity in the central Great Plains.International Journal of Remote Sensing, 25, 3127–3138.
White, R. P., Murray, S., Rohweder, M., Prince, S. D., & Thompson, K. M. (2000).
Grassland ecosystems. Washington DC: World Resources Institute. Yim, J., Kleinn, C., Cho, H., & Shin, M. (2010). Integration of digital satellite data