R E S E A R C H
Open Access
Effects of a novel bacterial phytase expressed in
Aspergillus Oryzae
on digestibility of calcium and
phosphorus in diets fed to weanling or growing
pigs
Ferdinando Nielsen Almeida, Rommel Casilda Sulabo and Hans Henrik Stein
*Abstract
In 2 experiments, 48 weanling (initial BW: 13.5 ± 2.4 kg, Exp. 1) and 24 growing pigs (initial BW: 36.2 ± 4.0 kg, Exp. 2) were used to determine effects of a novel bacterial 6-phytase expressed inAspergillus oryzaeon the apparent total tract digestibility (ATTD) of phosphorus and calcium in corn-soybean meal diets fed to weanling and growing pigs. In Exp. 1 and 2, pigs were randomly allotted to 6 dietary treatments using a randomized complete block design and a balanced 2 period changeover design, respectively. In both experiments, 6 diets were formulated. The positive control diet was a corn-soybean meal diet with added inorganic phosphorus (Exp. 1: 0.42 and 0.86% standardized total tract digestible phosphorus and total calcium, respectively; Exp. 2: 0.32 and 0.79% standardized total tract digestible phosphorus and total calcium, respectively). A negative control diet and 4 diets with the novel phytase (Ronozyme HiPhos, DSM Nutritional Products Inc., Parsippany, NJ) added to the negative control diet at levels of 500, 1,000, 2,000, and 4,000 phytase units (FYT)/kg were also formulated. In Exp. 1, the ATTD of phosphorus was greater (P< 0.01) for the positive control diet (60.5%) than for the negative control diet (40.5%), but increased (linear and quadratic,P< 0.01) as phytase was added to the negative control diet (40.5% vs. 61.6%, 65.1%, 68.7%, and 68.0%). The breakpoint for the ATTD of phosphorus (68.4%) was reached at a phytase inclusion level of 1,016 FYT/kg. In Exp. 2, the ATTD of phosphorus was greater (P< 0.01) for the positive control diet (59.4%) than for the negative control diet (39.8%) and increased (linear and quadratic,P< 0.01) as phytase was added to the negative control diet (39.8% vs. 58.1%, 65.4%, 69.1%, and 72.8%). The breakpoint for the ATTD of phosphorus (69.1%) was reached at a phytase inclusion level of 801 FYT/kg. In conclusion, the novel bacterial 6-phytase improved the ATTD of phosphorus and calcium in both weanling and growing pigs. The optimum level of inclusion for this phytase is 800 to 1,000 FYT/kg of complete feed to maximize ATTD of phosphorus and calcium in weanling and growing pigs.
Keywords:Calcium, Digestibility, Phosphorus, Phytase, Pigs
Background
In feedstuffs of plant origin, phosphorus is present in both organic and inorganic forms. Most of the organic phos-phorus in plant ingredients is bound to complex struc-tures called phytate (myo-inositol hexakisphosphate), which is the mixed salt of phytate [1]. Phytases hydrolyze phosphomonoester bonds of phytate, which releases bound phosphorus and produces lower forms of myo -in-ositol phosphates [2]. However, digestion of phytate is
limited in pigs due to insufficient production of en-dogenous gastric or intestinal phytases [3,4]. Phytate also has the ability to form calcium-phytate complexes, which renders calcium unavailable for absorption [5,6]. However, adding exogenous phytases to swine and poultry diets improves phosphorus and calcium digest-ibility and reduces phosphorus excretion [7-9]; and thus, phytase use has become a routine practice. Conse-quently, exogenous phytases are being developed through genetic engineering based on the gene se-quences and protein structures of phytase. The three commonly used phytase feed enzymes are derived from * Correspondence:hstein@illinois.edu
Department of Animal Sciences, University of Illinois, Urbana, IL 61801, USA
A number of studies compared different sources of exogenous phytase in pigs and observed differences in physico-chemical characteristics [10,11] and efficacy [12,13]. Recently, a novel bacterial 6-phytase (Ronozyme HiPhos, DSM Nutritional Products, Parsippany, NJ) expressed in Aspergillus oryzaewas developed, but there is no information on the effectiveness of this phytase when fed to pigs. Therefore, 2 experiments were conducted to determine the efficacy of this novel bacterial 6-phytase expressed in Aspergillus oryzae on phosphorus and cal-cium digestibility in corn-soybean meal diets fed to wean-ling or growing pigs.
Materials and methods
All experimental protocols used in this study were ap-proved by the University of Illinois Institutional Animal Care and Use Committee. Pigs used in both experiments were the offspring of Landrace boars mated to Large White × Duroc sows (PIC, Hendersonville, TN).
Animals, diets, and experimental design
For Exp. 1, a total of 48 weanling pigs (initial BW: 13.5 ± 2.45 kg) were blocked by initial BW and randomly al-lotted to 6 dietary treatments using a randomized complete block design. There were 8 blocks for each col-lection period. For Exp. 2, 24 growing barrows were used in a 2 period changeover design [14]. In period 1 (initial BW: 36.2 ± 4.0 kg), pigs were blocked by initial BW and
BW: 47.3 ± 5.3 kg), the same pigs used in period 1 were allotted in a way that potential residual effects were bal-anced (i.e., one pig did not receive the same dietary treatment as in period 1, and one dietary treatment did not follow another dietary treatments more than once; [14]). Individual pigs were placed in metabolism cages that allowed for total collection of feces. Each metabol-ism cage was equipped with a feeder and a nipple drinker.
In each experiment, 6 diets were formulated (Tables 1, 2, 3, and 4). The positive control diet for Exp. 1 and 2 were corn-soybean meal diets formulated to contain cal-cium and phosphorus levels that meet NRC [15] require-ments for weanling (10 to 20 kg) and growing (20 to 50 kg) pigs, respectively. Dicalcium phosphate and limestone were added to the diet to achieve 0.42, and 0.86% stan-dardized total tract digestible phosphorus, and total cal-cium, respectively, for Exp. 1 and 0.32, and 0.79% standardized total tract digestible phosphorus, and cal-cium, respectively, for Exp. 2. The second diet was the negative control diet formulated to be similar to the positive control diet except that dicalcium phosphate was excluded and replaced with cornstarch. The negative control diet contained 0.16, and 0.48% standardized total tract digestible phosphorus, and total calcium, respect-ively, for Exp. 1 and 0.16, and 0.58% standardized total tract digestible phosphorus, and total calcium, respect-ively, for Exp. 2. In both experiments, 4 additional diets
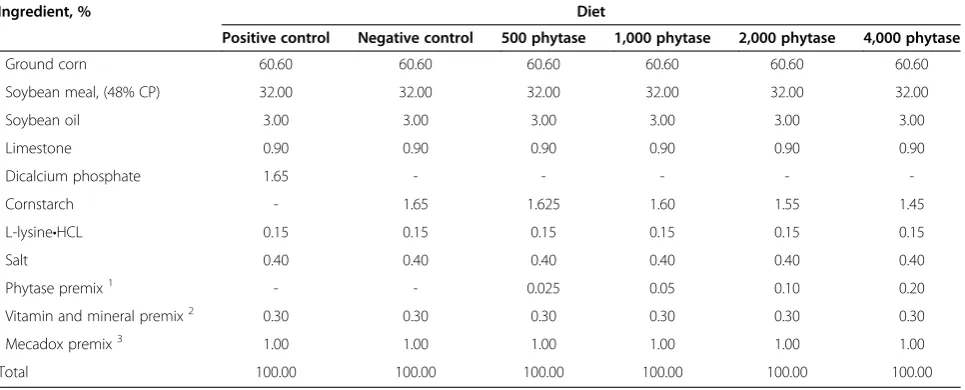
Table 1 Composition (as-is basis) of experimental diets, Exp. 1
Ingredient, % Diet
Positive control Negative control 500 phytase 1,000 phytase 2,000 phytase 4,000 phytase
Ground corn 60.60 60.60 60.60 60.60 60.60 60.60
Soybean meal, (48% CP) 32.00 32.00 32.00 32.00 32.00 32.00
Soybean oil 3.00 3.00 3.00 3.00 3.00 3.00
Limestone 0.90 0.90 0.90 0.90 0.90 0.90
Dicalcium phosphate 1.65 - - - -
-Cornstarch - 1.65 1.625 1.60 1.55 1.45
L-lysine•HCL 0.15 0.15 0.15 0.15 0.15 0.15
Salt 0.40 0.40 0.40 0.40 0.40 0.40
Phytase premix1 - - 0.025 0.05 0.10 0.20
Vitamin and mineral premix2 0.30 0.30 0.30 0.30 0.30 0.30
Mecadox premix3 1.00 1.00 1.00 1.00 1.00 1.00
Total 100.00 100.00 100.00 100.00 100.00 100.00
1
Ronozyme HiPhos, DSM Nutritional Products, Parsippany, NJ. Produced by mixing 3.4% of concentrated phytase (58,700 units/g) and 96.6% cornstarch. 2
The vitamin-micromineral premix provided the following quantities of vitamins and micro minerals per kilogram of complete diet: Vitamin A as retinyl acetate,
11,128 IU; vitamin D3as cholecalciferol, 2,204 IU; vitamin E as DL-alphatocopheryl acetate, 66 IU; vitamin K as menadione nicotinamide bisulfate, 1.42 mg; thiamin
as thiamine mononitrate, 0.24 mg; riboflavin, 6.58 mg; pyridoxine as pyridoxine hydrochloride, 0.24 mg; vitamin B12, 0.03 mg; D-pantothenic acid as D-calcium
pantothenate, 23.5 mg; niacin as nicotinamide, 1.0 mg, and nicotinic acid, 43.0 mg; folic acid, 1.58 mg; biotin, 0.44 mg; Cu, 10 mg as copper sulfate; Fe, 125 mg as iron sulfate; I, 1.26 mg as potassium iodate; Mn, 60 mg as manganese sulfate; Se, 0.3 mg as sodium selenite; and Zn, 100 mg as zinc oxide.
3
were formulated similar to the negative control diet with the addition of 500, 1,000, 2,000, or 4,000 phytase units (FYT)/kg of the bacterial phytase (Ronozyme HiPhos, DSM Nutritional Products, Parsippany, NJ). One FYT was defined as the amount of enzyme required to release 1
μmol of inorganic phosphorus per minute from sodium phytate at 37°C. Phytase was added to the phytase-supplemented diets as a premix, which was prepared by mixing 3.4% of concentrated phytase (58,700 phytase units/g) with 96.6% cornstarch. All experimental diets were fed in meal form.
Feeding and sample collection
All pigs were fed at a level of 3 times their estimated maintenance energy requirement (i.e., 106 kcal ME per
kg0.75; NRC, [15]) and water was available at all times throughout the experiment. The amount of feed pro-vided daily was dipro-vided into 2 equal meals. The initial 5 d were considered an adaptation period to the diet. From d 6 to 11, feces were collected according to the marker to marker approach [16]. Chromic oxide and fer-ric oxide were used to determine the beginning and the conclusion of collections, respectively. Fecal samples were stored at−20°C immediately after collection.
Sample analysis and calculations
At the conclusion of each experiment, fecal samples were dried in a forced air oven and ground to pass a 2 mm screen. Fecal samples and diets were analyzed for calcium and phosphorus by inductively coupled plasma
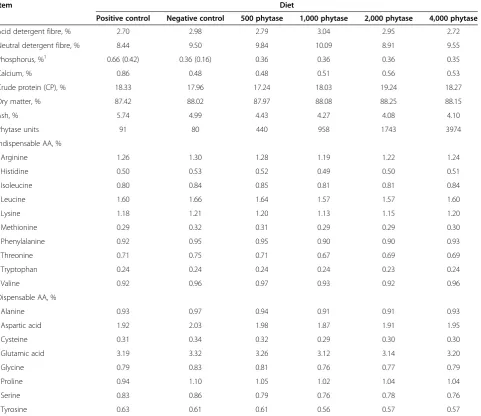
Table 2 Analyzed nutrient composition of diets (as-fed basis), Exp. 1
Item Diet
Positive control Negative control 500 phytase 1,000 phytase 2,000 phytase 4,000 phytase
Acid detergent fibre, % 2.70 2.98 2.79 3.04 2.95 2.72
Neutral detergent fibre, % 8.44 9.50 9.84 10.09 8.91 9.55
Phosphorus, %1 0.66 (0.42) 0.36 (0.16) 0.36 0.36 0.36 0.35
Calcium, % 0.86 0.48 0.48 0.51 0.56 0.53
Crude protein (CP), % 18.33 17.96 17.24 18.03 19.24 18.27
Dry matter, % 87.42 88.02 87.97 88.08 88.25 88.15
Ash, % 5.74 4.99 4.43 4.27 4.08 4.10
Phytase units 91 80 440 958 1743 3974
Indispensable AA, %
Arginine 1.26 1.30 1.28 1.19 1.22 1.24
Histidine 0.50 0.53 0.52 0.49 0.50 0.51
Isoleucine 0.80 0.84 0.85 0.81 0.81 0.84
Leucine 1.60 1.66 1.64 1.57 1.57 1.60
Lysine 1.18 1.21 1.20 1.13 1.15 1.20
Methionine 0.29 0.32 0.31 0.29 0.29 0.30
Phenylalanine 0.92 0.95 0.95 0.90 0.90 0.93
Threonine 0.71 0.75 0.71 0.67 0.69 0.69
Tryptophan 0.24 0.24 0.24 0.24 0.23 0.24
Valine 0.92 0.96 0.97 0.93 0.92 0.96
Dispensable AA, %
Alanine 0.93 0.97 0.94 0.91 0.91 0.93
Aspartic acid 1.92 2.03 1.98 1.87 1.91 1.95
Cysteine 0.31 0.34 0.32 0.29 0.30 0.30
Glutamic acid 3.19 3.32 3.26 3.12 3.14 3.20
Glycine 0.79 0.83 0.81 0.76 0.77 0.79
Proline 0.94 1.10 1.05 1.02 1.04 1.04
Serine 0.83 0.86 0.79 0.76 0.78 0.76
Tyrosine 0.63 0.61 0.61 0.56 0.57 0.57
1
Values in parenthesis represent the standardized total tract digestible (STTD) phosphorus, which was calculated from the STTD phosphorus values for corn,
(ICP) spectroscopy (method 985.01 [17]) after wet ash sample preparation (method 975.03 [17]). Diets were also analyzed for AA (method 982.30 E (a, b, c) [17]), ADF (method 973.18[17]), NDF [18], DM (method 930.15 [17]), ash (method 942.05 [17]), and CP (method 990.03 [17]). Samples of the diets were sent to DSM Nu-tritional Products laboratory (Belvidere, NJ) for phytase analysis using the AOAC official method 2000.12 [17].
The apparent total tract digestibility (ATTD) of phos-phorus in each diet was calculated according to the fol-lowing equation:
ATTDð Þ ¼% ½ðPiPfÞ=Pi 100;
where Pi = total phosphorus intake (g) from d 6 to 11 and Pf = total fecal phosphorus output (g) originating from the feed that was provided from d 6 to 11 [19]. The same equation was used to calculate for the ATTD of calcium in each diet.
Statistical analysis
In Exp. 1 and 2, data were analyzed as a randomized complete block design and as a changeover design [14], respectively, using the MIXED procedure of SAS (SAS Inst. Inc., Cary, NC). In Exp. 1, the model included diet as the fixed effect and block as the random effect. In Exp. 2, the model included diet as the fixed effect and block and period as random effects. Pig was the experi-mental unit for all analyses. The UNIVARIATE proced-ure was used to test the normality of the data and to identify outliers. In Exp. 1, there were no outliers. How-ever, 1 outlier was identified in Exp. 2 and was removed from the data set.
For both experiments, contrasts were performed be-tween the positive control and the negative control and the negative control vs. diets with phytase. Orthogonal polynomial contrasts were also conducted to test linear and quadratic responses to the inclusion of increasing levels of phytase to the diets. Appropriate coefficients for unequally spaced concentrations of supplemental phytase were obtained using the interactive matrix lan-guage procedure (PROC IML) of SAS. Treatment means were subjected to a least squares broken-line analysis performed using the procedures of Robbins et al. [20] to determine the phytase level needed to maximize ATTD of phosphorus and calcium in weanling and growing pigs. For all statistical tests, an α level of 0.05 was used to assess significance among means.
Results
Exp. 1, weanling pigs
There was no difference in feed intake and fecal output among treatments (Table 5). Phosphorus intake was greater (P< 0.01) for pigs fed the positive control diet than for pigs fed the negative control diet, but fecal phosphorus concentration was less (P< 0.05) for pigs fed the negative control diet than those fed the positive con-trol diet. Likewise, pigs fed the phytase-containing diets had less (linear and quadratic,P< 0.01) fecal phosphorus concentration than pigs fed the negative control diet. The daily phosphorus output was also less (P< 0.01) for pigs fed the negative control diet than for pigs fed the positive control diet, and the inclusion of increasing levels of phytase to the negative control diet reduced (linear and quadratic, P< 0.01) phosphorus output. The ATTD of phosphorus was greater (P< 0.01) for pigs fed the positive control diet than for pigs fed the negative Positive control Negative control 500 phytase 1,000 phytase 2,000 phytase 4,000 phytase
Ground corn 65.80 65.80 65.80 65.80 65.80 65.80
Soybean meal, (48% CP) 29.50 29.50 29.50 29.50 29.50 29.50
Soybean oil 2.00 2.00 2.00 2.00 2.00 2.00
Ground limestone 0.95 0.95 0.95 0.95 0.95 0.95
Dicalcium phosphate 1.05 - - - -
-Cornstarch - 1.05 1.025 1.00 0.975 0.95
Salt 0.40 0.40 0.40 0.40 0.40 0.40
Phytase premix1 - - 0.025 0.05 0.075 0.10
Vitamin and mineral premix2 0.30 0.30 0.30 0.30 0.30 0.30
Total 100.00 100.00 100.00 100.00 100.00 100.00
1
Ronozyme HiPhos, DSM Nutritional Products, Parsippany, NJ. Produced by mixing 3.4% of concentrated phytase (58,700 units/g) and 96.6% cornstarch. 2
The vitamin-micromineral premix provided the following quantities of vitamins and micro minerals per kilogram of complete diet: Vitamin A as retinyl acetate,
11,128 IU; vitamin D3as cholecalciferol, 2,204 IU; vitamin E as DL-alphatocopheryl acetate, 66 IU; vitamin K as menadione nicotinamide bisulfate, 1.42 mg; thiamin
as thiamine mononitrate, 0.24 mg; riboflavin, 6.58 mg; pyridoxine as pyridoxine hydrochloride, 0.24 mg; vitamin B12, 0.03 mg; D-pantothenic acid as D-calcium
control diet (60.5% vs. 40.5%); however, ATTD of phos-phorus increased (linear and quadratic, P< 0.01) as phytase was added to the negative control diet (61.6%, 65.1%, 68.7%, and 68.0% for pigs fed diets containing 500, 1,000, 2,000, or 4,000 FYT/kg of phytase, respect-ively). The amount of phosphorus absorbed was greater (P< 0.01) for pigs fed the positive control diet than for pigs fed the negative control diet (2.6 vs. 0.9 g/d). Like-wise, the addition of increasing levels of phytase to the negative control diet increased (linear and quadratic, P< 0.01) the amount of phosphorus absorbed. The ATTD of phosphorus plateaued at 68.4% which was reached when 1,016 FYT/kg of phytase was added to the diet (Figure 1).
Calcium intake was greater (P< 0.01) for pigs fed the positive control diet than for pigs fed the negative con-trol diet (5.6 vs. 3.0 g/d). Pigs that were fed phytase containing diets tended (P= 0.06) to have a greater cal-cium intake than pigs fed the negative control diet. Con-centration of calcium in feces was greater (P< 0.05) for pigs fed the positive control diet compared with pigs fed the negative control diet (2.29% vs. 1.86%); however, pigs fed phytase containing diets had less (linear and quad-ratic, P< 0.01) calcium concentration in feces than pigs fed the negative control diet. The daily calcium output was also greater (P< 0.01) for pigs fed the positive con-trol diet than for pigs fed the negative concon-trol diet (1.5 vs. 1.1 g/d), but the addition of 500, 1,000, 2,000, or
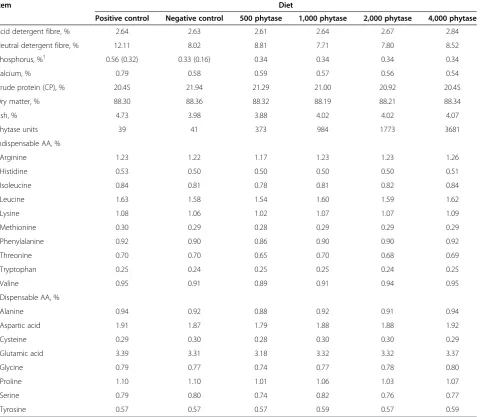
Table 4 Analyzed nutrient composition of diets (as-fed basis), Exp. 2
Item Diet
Positive control Negative control 500 phytase 1,000 phytase 2,000 phytase 4,000 phytase
Acid detergent fibre, % 2.64 2.63 2.61 2.64 2.67 2.84
Neutral detergent fibre, % 12.11 8.02 8.81 7.71 7.80 8.52
Phosphorus, %1 0.56 (0.32) 0.33 (0.16) 0.34 0.34 0.34 0.34
Calcium, % 0.79 0.58 0.59 0.57 0.56 0.54
Crude protein (CP), % 20.45 21.94 21.29 21.00 20.92 20.45
Dry matter, % 88.30 88.36 88.32 88.19 88.21 88.34
Ash, % 4.73 3.98 3.88 4.02 4.02 4.07
Phytase units 39 41 373 984 1773 3681
Indispensable AA, %
Arginine 1.23 1.22 1.17 1.23 1.23 1.26
Histidine 0.53 0.50 0.50 0.50 0.50 0.51
Isoleucine 0.84 0.81 0.78 0.81 0.82 0.84
Leucine 1.63 1.58 1.54 1.60 1.59 1.62
Lysine 1.08 1.06 1.02 1.07 1.07 1.09
Methionine 0.30 0.29 0.28 0.29 0.29 0.29
Phenylalanine 0.92 0.90 0.86 0.90 0.90 0.92
Threonine 0.70 0.70 0.65 0.70 0.68 0.69
Tryptophan 0.25 0.24 0.25 0.25 0.24 0.25
Valine 0.95 0.91 0.89 0.91 0.94 0.95
Dispensable AA, %
Alanine 0.94 0.92 0.88 0.92 0.91 0.94
Aspartic acid 1.91 1.87 1.79 1.88 1.88 1.92
Cysteine 0.29 0.30 0.28 0.30 0.30 0.29
Glutamic acid 3.39 3.31 3.18 3.32 3.32 3.37
Glycine 0.79 0.77 0.74 0.77 0.78 0.80
Proline 1.10 1.10 1.01 1.06 1.03 1.07
Serine 0.79 0.80 0.74 0.82 0.76 0.77
Tyrosine 0.57 0.57 0.57 0.59 0.57 0.59
1
Values in parenthesis represent the standardized total tract digestible (STTD) phosphorus, which was calculated from the STTD phosphorus values for corn,
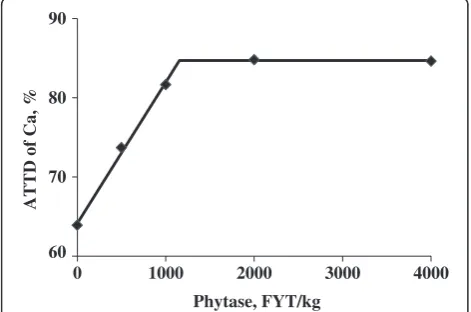
4,000 FYT/kg of phytase to the negative control diet re-duced (quadratic, P< 0.01) calcium output to 0.80%, 0.60%, 0.52%, and 0.50%, respectively. The ATTD of cal-cium was greater (P< 0.05) for pigs fed the positive con-trol diet than for pigs fed the negative concon-trol diet (72.5% vs. 63.9%), but pigs fed diets containing 500, 1,000, 2,000, or 4,000 FYT/kg of phytase had greater (linear and
quadratic, P< 0.01) ATTD of calcium than pigs fed the negative control diet (73.7%, 81.7%, 84.8%, and 84.6%). The amount of calcium absorbed was reduced (P< 0.01) from 4.0 to 2.0 g/d for pigs fed the negative control diet rather than the positive control diet, but calcium absorp-tion was increased (linear and quadratic,P< 0.01) for pigs fed phytase containing diets compared with pigs fed the negative control diet (2.0 vs. 2.2, 2.7, 3.0, and 2.7 g/d). The breakpoint for phytase concentration was reached at 1,155 FYT/kg of phytase, which resulted in an optimal ATTD of calcium of 84.7% (Figure 2).
Exp. 2, growing pigs
No differences in feed intake were observed among treatments (Table 6). Phosphorus intake was greater (P< 0.01) for pigs fed the positive control diet than for pigs fed the negative control diet (8.5 vs. 4.8 g/d) and fecal phosphorus output tended (P =0.08) to be greater for pigs fed the positive control diet than for pigs fed the negative control diet. The phosphorus concentration in feces was less (linear and quadratic,P< 0.01) for pigs fed phytase containing diets than for pigs fed the negative control diet. The daily phosphorus output was less (P< 0.01) for pigs fed the negative control diet than for pigs fed the positive control diet (2.9 vs. 3.4 g/d). Addition of phytase to the negative control diet reduced (linear and quadratic, P< 0.01) daily phosphorus output (2.1, 1.8, 1.5, and 1.4 g/d). The ATTD of phosphorus
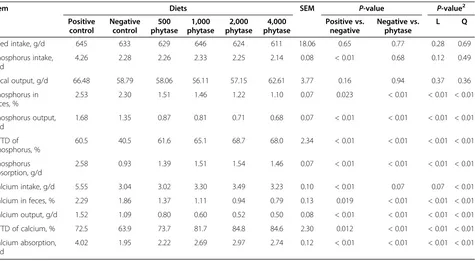
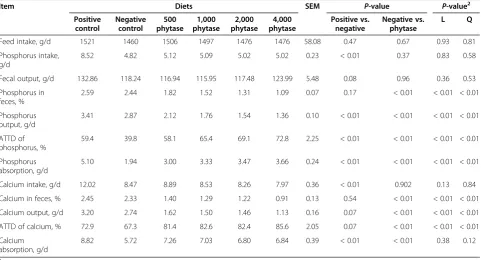
Item Diets SEM P-value P-value
Positive control
Negative control
500 phytase
1,000 phytase
2,000 phytase
4,000 phytase
Positive vs. negative
Negative vs. phytase
L Q
Feed intake, g/d 645 633 629 646 624 611 18.06 0.65 0.77 0.28 0.69
Phosphorus intake, g/d
4.26 2.28 2.26 2.33 2.25 2.14 0.08 < 0.01 0.68 0.12 0.49
Fecal output, g/d 66.48 58.79 58.06 56.11 57.15 62.61 3.77 0.16 0.94 0.37 0.36
Phosphorus in feces, %
2.53 2.30 1.51 1.46 1.22 1.10 0.07 0.023 < 0.01 < 0.01 < 0.01
Phosphorus output, g/d
1.68 1.35 0.87 0.81 0.71 0.68 0.07 < 0.01 < 0.01 < 0.01 < 0.01
ATTD of phosphorus, %
60.5 40.5 61.6 65.1 68.7 68.0 2.34 < 0.01 < 0.01 < 0.01 < 0.01
Phosphorus absorption, g/d
2.58 0.93 1.39 1.51 1.54 1.46 0.07 < 0.01 < 0.01 < 0.01 < 0.01
Calcium intake, g/d 5.55 3.04 3.02 3.30 3.49 3.23 0.10 < 0.01 0.07 0.07 < 0.01
Calcium in feces, % 2.29 1.86 1.37 1.11 0.94 0.79 0.13 0.019 < 0.01 < 0.01 < 0.01
Calcium output, g/d 1.52 1.09 0.80 0.60 0.52 0.50 0.08 < 0.01 < 0.01 < 0.01 < 0.01
ATTD of calcium, % 72.5 63.9 73.7 81.7 84.8 84.6 2.30 0.012 < 0.01 < 0.01 < 0.01
Calcium absorption, g/d
4.02 1.95 2.22 2.69 2.97 2.74 0.12 < 0.01 < 0.01 < 0.01 < 0.01
1
Data are means of 8 observations per treatment. 2
L = linear contrast; Q = quadratic contrast.
was greater (P< 0.01) for pigs fed the positive control diet than for pigs fed the negative control diet (59.4% vs. 39.8%). Pigs fed phytase containing diets also had grea-ter (linear and quadratic, P< 0.01) ATTD of phospho-rus than pigs fed the negative control diet (58.1%, 65.4%, 69.1%, and 72.8%). Phosphorus absorption was greater (P< 0.01) for pigs fed the positive control diet than for
pigs fed the negative control diet (5.1 vs. 1.9 g/d); how-ever, addition of phytase to the negative control diet in-creased (linear and quadratic, P< 0.01) absorption of phosphorus to 3.0, 3.3, 3.5, and 3.7 g/d. The breakpoint for phytase concentration resulted in an ATTD of phos-phorus of 69.1%, which was reached when 801 FYT/kg of phytase was added to the diet (Figure 3).
Calcium intake was greater (P< 0.01) for pigs fed the positive control diet than for pigs fed the negative con-trol diet (12.0 vs. 8.5 g/d). Concentration of calcium in feces was reduced (linear and quadratic, P< 0.01) as phytase was added to the negative control diet (2.33% vs. 1.40%, 1.29%, 1.22%, and 0.91%). The daily calcium output tended (P= 0.07) to be greater for pigs fed the positive control diet compared with pigs fed the negative control diet (3.2 vs. 2.7 g/d). Addition of phytase to the negative control diet reduced (linear and quadratic, P< 0.01) the daily calcium output to 1.6, 1.5, 1.5, and 1.1 g/d. There was also a tendency (P= 0.07) for pigs fed the positive control diet to have greater ATTD of calcium than pigs fed the negative control diet (72.9% vs. 67.3%). As phytase was added to the negative control diet, the ATTD of cal-cium increased (linear and quadratic, P< 0.01) to 81.4%, 82.6%, 82.4%, and 85.6%. Calcium absorption was greater (P< 0.01) for pigs fed the positive control diet than for pigs fed the negative control diet (8.8 vs. 5.7 g/d). Like-wise, pigs fed phytase containing diets had greater (P< 0.01) absorption of calcium than pigs fed the negative
60 70 80 90
0 1000 2000 3000 4000
ATTD of Ca, %
Phytase, FYT/kg
Figure 2Fitted broken-line plot of ATTD of calcium as a function of dietary phytase level in weanling pigs (Exp. 1) with observed treatment mean values (n = 8 observations per treatment mean).The minimal dietary phytase level determined by broken-line analysis using least squares methodology was 1,155 FYT/kg (Y plateau = 84.7; slope below breakpoint =−0.0178; Adjusted R2= 0.997).
Table 6 Effects of phytase on apparent total tract digestibility (ATTD) of phosphorus and calcium in growing pigs1, Exp. 2
Item Diets SEM P-value P-value2
Positive control
Negative control
500 phytase
1,000 phytase
2,000 phytase
4,000 phytase
Positive vs. negative
Negative vs. phytase
L Q
Feed intake, g/d 1521 1460 1506 1497 1476 1476 58.08 0.47 0.67 0.93 0.81
Phosphorus intake, g/d
8.52 4.82 5.12 5.09 5.02 5.02 0.23 < 0.01 0.37 0.83 0.58
Fecal output, g/d 132.86 118.24 116.94 115.95 117.48 123.99 5.48 0.08 0.96 0.36 0.53
Phosphorus in feces, %
2.59 2.44 1.82 1.52 1.31 1.09 0.07 0.17 < 0.01 < 0.01 < 0.01
Phosphorus output, g/d
3.41 2.87 2.12 1.76 1.54 1.36 0.10 < 0.01 < 0.01 < 0.01 < 0.01
ATTD of phosphorus, %
59.4 39.8 58.1 65.4 69.1 72.8 2.25 < 0.01 < 0.01 < 0.01 < 0.01
Phosphorus absorption, g/d
5.10 1.94 3.00 3.33 3.47 3.66 0.24 < 0.01 < 0.01 < 0.01 < 0.01
Calcium intake, g/d 12.02 8.47 8.89 8.53 8.26 7.97 0.36 < 0.01 0.902 0.13 0.84
Calcium in feces, % 2.45 2.33 1.40 1.29 1.22 0.91 0.13 0.54 < 0.01 < 0.01 < 0.01
Calcium output, g/d 3.20 2.74 1.62 1.50 1.46 1.13 0.16 0.07 < 0.01 < 0.01 < 0.01
ATTD of calcium, % 72.9 67.3 81.4 82.6 82.4 85.6 2.05 0.07 < 0.01 < 0.01 < 0.01
Calcium absorption, g/d
8.82 5.72 7.26 7.03 6.80 6.84 0.39 < 0.01 < 0.01 0.38 0.12
1
Data are means of 8 observations per treatment. 2
control diet. For the ATTD of calcium, the breakpoint for phytase concentration was reached when 574 FYT/kg of phytase was added to the diet, which resulted in an ATTD of calcium of 83.5% (Figure 4).
Discussion
Effects on phosphorus digestibility
Exogenous phytases are either 3-phytases (EC 3.1.3.8) or 6-phytases (EC 3.1.3.26), which is grouped according to the specific position of the phosphomonoester group on the phytate molecule at which hydrolysis is initiated [21]. Traditionally, phytases of microbial origin are
from E. coli, P. lycii, and the bacterial phytase used in this study are clear exceptions. Thus, previous assump-tions regarding the evolutionary distribution of 3- and 6-phytases may be of limited relevance [2]. Exogenous phytases have also been isolated from a variety of sources, expressed in a wide range of hosts, puri-fied, and refolded using various biochemical methods [23]. Depending on the source and expression host, commercially-available phytases have distinct physical and biochemical properties [10,11,24,25] and as a result, they exhibit varying efficacies in pigs and poultry [13,23,26,27]. It is, therefore, important to evaluate the efficacy of new sources of phytase in improving phos-phorus utilization for effective use in commercial prac-tice. The phytase used in this study is a 6-phytase from a proprietary strain of bacteria and expressed in a strain ofA. oryzae. Currently, there are no data on the effects of this novel bacterial 6-phytase on phosphorus uti-lization by pigs.
In the present study, phosphorus digestibility of the negative control diet was 40.5% and 39.8% for weanling and growing pigs, respectively. These values were within the range determined in previous studies using low-phosphorus, corn-soybean meal-based diets fed to wean-ling (17.4% to 46.4%; [28-30]) and growing pigs (16.6% to 39.7%; [13,27]). The relatively wide range in phos-phorus digestibility of the negative control diets across these studies may be related to the inherent variability of phosphorus digestibility in corn and soybean meal. Pre-vious studies have reported that ATTD of phosphorus in corn ranged from 16.1% [31] to 28.8% [32], whereas in soybean meal, values from 27.6% [33] to 46.5% [34] have been reported. As expected, the phosphorus digestibility values of the negative control diets were less than in the positive control diets. Thus, the amounts of phosphorus absorbed from the negative control diets were reduced compared with the positive control diets, which is mainly an indication of the reduced digestibility of phytate-bound phosphorus in corn and soybean meal compared with inorganic phosphates. Even with the addition of 4,000 FYT to the negative control diet, ab-sorption of phosphorus was not at levels that were simi-lar to the positive control diet. Thus, if one assumes that the positive control diet was at the requirement for phosphorus, this indicates that inorganic phosphorus must be also included in corn-soybean meal diets in combination with phytase.
Values for the ATTD of phosphorus that were ob-served for weanling pigs fed the diets containing phytase are similar to values reported from previous nurse-ry pig studies in which A. niger phytase [28,35] or E.coli phytases [9,29,36] were used. Likewise, values for Figure 3Fitted broken-line plot of ATTD of phosphorus as a
function of dietary phytase level in growing pigs (Exp. 2) with observed treatment mean values (n = 8 observations per treatment mean).The minimal dietary phytase level determined by broken-line analysis using least squares methodology was 801 FYT/ kg (Y plateau = 69.1; slope below breakpoint =−0.036; Adjusted R2= 0.947).
60 70 80 90
0 1000 2000 3000 4000
ATTD of Ca, %
Phytase, FYT/kg
the ATTD of phosphorus obtained in growing pigs fed the phytase containing diets are close to or slightly greater than values reported for pigs fed corn-soybean meal diets containingE. coli,A. niger, orP. lyciiphytases [13,37,38]. Thus, the responses observed in this experi-ment for this phytase, is similar to what has been reported for other commercially-available phytases.
As a result of greater phytate hydrolysis, fecal phos-phorus excretion was markedly reduced in weanling and growing pigs fed low-phosphorus diets containing the bacterial 6-phytase compared with pigs fed the positive or the negative control diets. This observation is also in agreement with results of previous experiments [9,28,30,35,38,39]. Thus, the novel 6-phytase used in this experiment is expected to reduce fecal phosphorus ex-cretion to the same degree as other phytases that are currently marketed to the swine industry. Likewise, the increase in the digestibility of phosphorus that was ob-served by including the novel 6-phytase to the diets is in agreement with results from previous experiments using weanling [9,29,30,36,37] or growing-finishing pigs [13,27].
The use of a broken line model in this experiment may have underestimated the phytase levels that maxi-mises the ATTD of phosphorus and calcium, and a quadratic regression curve could have been a more ac-curate fit to this data [20]. However, it has been sug-gested that fitting a quadratic regression curve is preferable when the data consists of at least 4 data points below the breakpoint, which was not the case in this experiment [20]. Results of dose–response experi-ments usingA. nigerphytase have indicated a curvilinear relationship between phytase level and phosphorus di-gestibility [40-43], and the maximum response is usually achieved at approximately 1,000 FYT/kg. However, Dungelhoef and Rodehutscord [44] reported that if a fungal phytase is used, improvements in phosphorus di-gestibility may be minimal if doses greater than 750 FYT/kg of phytase are used. Braña et al. [27] also ob-served that when using G:F as the response criteria, the maximum response to anE. coliphytase was achieved at 738 FYT/kg. Thus, the observation that the response to increasing levels of the bacterial 6-phytase that was used in the present experiments is dose-dependent is in agreement with results obtained with other commercially-available phytases.
Effects on calcium digestibility
The improvement in calcium digestibility that was ob-served as phytase was added to the diets is in agreement with previous data [27-29,38] and is likely a result of in-creased release of calcium during the breakdown of calcium-phytate complexes in the gut. The negative ef-fects of phytate on calcium digestibility may be a result
of direct binding of calcium to phytate [8], but phytate may also compromise Na-dependent active transport systems [45]; which may result in reduced calcium di-gestibility. However, when exogenous phytase is added to the diet and some of the phytates are hydrolized, these negative effects are reduced and calcium absorp-tion is improved.
The linear and quadratic relationship between the level of bacterial 6-phytase in the diet and the improvements in calcium digestibility and fecal calcium output in both weanling and growing pigs is in agreement with data from Jendza et al. [29] and Veum et al. [30]. The current results also indicated that the maximum calcium digest-ibility was 83.5 to 84.7%, which was obtained with 1,155 and 574 FYT/kg in weanling and growing pigs, respectively.
Conclusions
Results from the present experiments demonstrate that the novel bacterial 6-phytase expressed in Aspergillus oryzae may be used in phosphorus-deficient, corn-soybean meal diets to improve the ATTD of phosphorus and calcium and reduce fecal phosphorus excretion in pigs. Responses of this phytase is similar to or slightly greater than what has been reported for other sources of microbial phytase. The optimum level of inclusion for this phytase is 800 to 1,000 FYT/kg of complete feed to maximize ATTD of phosphorus and calcium in weanling and growing pigs.
Abbreviations
AA: Amino acids; ADF: Acid detergent fibre; aP: Available phosphorus; ATTD: Apparent total tract digestibility; BW: Body weight; CP: Crude protein; DM: Dry matter; FYT: Phytase units; ICP: Inductively coupled plasma; NDF: Neutral detergent fibre.
Competing interests
Authors have no competing interests.
Authors’contributions
All authors equally contributed to this research. All authors read and approved the final manuscript.
Acknowledgements
Financial support from DSM Nutritional Products, Parsippany, NJ, is appreciated.
Received: 3 October 2012 Accepted: 31 December 2012 Published: 5 March 2013
References
1. Jongbloed AW:Phosphorus in the feeding of pigs. Effect of diet in the absorption and retention of phosphorus by growing pigs.Netherlands: PhD thesis. University of Wageningen; 1987.
2. Lassen SF, Breinholt J, Ostergaard PR, Brugger R, Bischoff A, Wyss M, Fuglsang CC:Expression, gene cloning, and characterization of five novel phytases from four Basidiomycete fungi: Peniophora lycii, Agrocybe pediades, a Ceriporia sp., and Trametes pubescens.Appl Environ Microb 2001,67:4701–4707.
young pigs.Anim Feed Sci Technol1996,61:361–368.
5. Sandberg AS, Larsen T, Sandström B:High dietary calcium level decrease colonic phytate degradation in pigs fed a rapeseed diet.J Nutr1993,
123:559–566.
6. Saha PR, Weaver CM, Mason AC:Mineral bioavailability in rats from intrinsically labeled whole wheat flour of various phytate levels.J Agri Food Chem1994,42:2531–2535.
7. Selle PH, Ravindran V:Microbial phytase in poultry nutrition.Anim Feed Sci Technol2007,135:1–41.
8. Selle PH, Cowieson AJ, Ravindran V:Consequences of calcium interactions with phytate and phytase for poultry and pigs.Livest Sci2009,
124:126–141.
9. Almeida FN, Stein HH:Performance and phosphorus balance of pigs fed diets formulated on the basis of values for standardized total tract digestibility of phosphorus.J Anim Sci2010,88:2968–2977.
10. Lei XG, Stahl CH:Biotechnological development of effective phytases for mineral nutrition and environmental protection.Appl Microbiol Biotechnol 2001,57:474–481.
11. Boyce A, Walsh G:Comparison of selected physicochemical
characteristics of commercial phytases relevant to their application in phosphate pollution abatement.J Environ Sci Heal A2006,41:789–798. 12. Jones CK, Tokach MD, Dritz SS, Ratliff BW, Horn NL, Goodband RD,
DeRouchey JM, Sulabo RC, Nelssen JL:Efficacy of different commercial phytase enzymes and development of an available phosphorus release curve for Escherichia coli-derived phytases in nursery pigs.J Anim Sci 2010,88:3631–3644.
13. Kerr BJ, Weber TE, Miller PS, Southern LL:Effect of phytase on apparent total tract digestibility of phosphorus in corn-soybean meal diets fed to finishing pigs.J Anim Sci2010,88:238–247.
14. Gill JL, Magee WT:Balanced two-period changeover designs for several treatments.J Anim Sci1976,42:775–777.
15. NRC:Nutrient requirements of swine.Washington, DC: Natl Acad Press; 1998:10.
16. Adeola O:Digestion and balance techniques in pigs.InSwine nutrition. 2nd edition. Edited by Lewis AJ, Southern LL. Washington, DC: CRC Press; 2001:903–916.
17. AOAC:Official methods of analysis.18th edition. Gaithersburg, MD: Association of Official Analytical Chemists; 2007.
18. Holst DO:Holst filtration apparatus for Van Soest detergent fiber analysis.J AOAC1973,56:1352–1356.
19. Petersen GI, Stein HH:Novel procedure for estimating endogenous losses and measurement of apparent and true digestibility of phosphorus by growing pigs.J Anim Sci2006,84:2126–2132.
20. Robbins KR, Saxton AM, Southern LL:Estimation of nutrient requirements using broken-line regression analysis.J Anim Sci2006,
84(E.Suppl):E155–E165.
21. Angel R, Tamim NM, Applegate TJ, Dhandu AS, Ellestad LE:Phytic acid chemistry: Influence on phytin-phosphorus availability and phytase efficacy.J Appl Poult Res2002,11:471–480.
22. Kornegay ET:Digestion of phosphorus and other nutrients: The role of phytases and factors influencing their activity.InEnzymes in farm animal nutrition.2nd edition. Edited by Bedford MR, Partridge GG. Wallingford, UK: CAB International; 2001:237–272.
23. Rao DECS, Rao KV, Reddy TP, Reddy VD:Molecular characterization, physicochemical properties, known and potential applications of phytases: An overview.Crit Rev Biotechnol2009,29:182–198. 24. Rodriguez E, Han Y, Lei XG:Cloning, sequencing, and expression of an
Escherichia coli acid phosphatase/phytase gene (app A2) isolated from pig colon.Biochem Biophys Res Commun1999,257:117–123.
25. Rodriguez E, Porres JM, Han Y, Lei XG:Different sensitivity of recombinant Aspergillus niger phytase (r-PhyA) and Escherichia coli pH 2.5 acid phosphatase (r-AppA) to trypsin and pepsin in Vitro.Arch Bioch Biophys 1999,365:262–267.
26. Augspurger NR, Webel DM, Lei XG, Baker DH:Efficacy of an E. coli phytase expressed in yeast for releasing phytate-bound phosphorus in young chicks and pigs.J Anim Sci2003,81:474–483.
28. Lei XG, Ku PK, Miller ER, Yokoyama MT:Supplementing corn-soybean meal diets with microbial phytase linearly improves phytate phosphorus utilization by weanling pigs.J Anim Sci1993,71:3359–3367.
29. Jendza JA, Dilger RN, Sands JS, Adeola O:Efficacy and equivalency of an
Escherichia coli-derived phytase for replacing inorganic phosphorus in the diets of broiler chickens and young pigs.J Anim Sci2006,
84:3364–3374.
30. Veum TL, Bollinger DW, Buff CE, Bedford MR:A genetically engineered Escherichia coli phytase improves nutrient utilization, growth performance, and bone strength of young swine fed diets deficient in available phosphorus.J Anim Sci2006,84:1147–1158.
31. Spencer JD, Allee GL, Sauber TE:Phosphorus bioavailability and digestibility of normal and genetically modified low-phytate corn for pigs.J Anim Sci2000,78:675–681.
32. Bohlke RA, Thaler RC, Stein HH:Calcium, phosphorus, and amino acid digestibility in low-phytate corn, normal corn, and soybean meal by growing pigs.J Anim Sci2005,83:2396–2403.
33. Wu X, Ruan Z, Zhang YG, Hou YQ, Yin YL, Li TJ, Huang RL, Chu WY, Kong XF, Gao B, Chen LX:True digestibility of phosphorus in different resources of feed ingredients in growing pigs.Asian-Aust J Anim Sci2008,
21:107–119.
34. Dilger RN, Adeola O:Estimation of true phosphorus digestibility and endogenous phosphorus loss in growing pigs fed conventional and low-phytate soybean meals.J Anim Sci2006,84:627–634.
35. Lei XG, Ku PK, Miller ER, Yokoyama MT, Ullrey DE:Supplementing corn-soybean meal diets with microbial phytase maximizes phytate phosphorus utilization by weanling pigs.J Anim Sci1993,71:3368–3375. 36. Olukosi OA, Sands JS, Adeola O:Supplementation of carbohydrases or
phytase individually or in combination to diets for weanling and growing-finishing pigs.J Anim Sci2007,85:1702–1711.
37. Kies AK, Kemme PA, Sebek LBJ, van Diepen JTM, Jongbloed AW:Effect of graded doses and a high dose of microbial phytase on the digestibility of various minerals in weaner pigs.J Anim Sci2006,84:1169–1175. 38. Guggenbuhl P, Quintana P, Nunes CS:Comparative effects of three
phytases on phosphorus and calcium digestibility in the growing pig.
Livest Sci2007,109:258–260.
39. Augspurger NR, Spencer JD, Webel DM, Wolter BF, Torrance TS:An Escherichia coli-derived phytase can fully replace inorganic phosphorus in maize–soybean meal diets for growing-finishing pigs.Anim Feed Sci Technol2009,154:254–259.
40. Beers S, Jongbloed AW:Effect of supplementary Aspergillus niger phytase in diets for piglets on their performance and apparent digestibility of phosphorus.Anim Prod1992,55:425–430.
41. Kornegay ET, Qian H:Replacement of inorganic phosphorus by microbial phytase for young pigs fed on a maize-soyabean-meal diet.Br J Nutr 1996,76:563–578.
42. Yi Z, Kornegay ET, Ravindran V, Lindemann MD, Wilson JH:Effectiveness of Natuphos phytase in improving the bioavailabilities of phosphorus and other nutrients in soybean meal based semipurified diets for young pigs.J Anim Sci1996,74:1601–1611.
43. Almeida FN, Stein HH:Effects of grade levels of microbial phytase on the standardized total tract digestibility of phosphorus in corn and corn coproducts fed to pigs.J Anim Sci2012,90:1262–1269.
44. Dungelhoef M, Rodehutscord M:Wirkung von Phytase auf die Verdaulichkeit des Phosphors beim Schwein.U bers Tierernarg1995,
23:133–157.
45. Favus MJ:Factors that influence absorption and secretion of calcium in the small intestine and colon.Am J Physiol1985,248:G147–G157. 46. NRC:Nutrient requirements of swine.Washington, DC: Natl Acad Press;
2012:10.
doi:10.1186/2049-1891-4-8