R E S E A R C H
Open Access
Structural influence of gene networks on their
inference: analysis of C3NET
Gökmen Altay
1,2and Frank Emmert-Streib
1,2*Abstract
Background:The availability of large-scale high-throughput data possesses considerable challenges toward their functional analysis. For this reason gene network inference methods gained considerable interest. However, our current knowledge, especially about the influence of the structure of a gene network on its inference, is limited.
Results:In this paper we present a comprehensive investigation of the structural influence of gene networks on the inferential characteristics of C3NET - a recently introduced gene network inference algorithm. We employ local as well as global performance metrics in combination with an ensemble approach. The results from our numerical study for various biological and synthetic network structures and simulation conditions, also comparing C3NET with other inference algorithms, lead a multitude of theoretical and practical insights into the working behavior of C3NET. In addition, in order to facilitate the practical usage of C3NET we provide an user-friendly R package, called
c3net, and describe its functionality. It is available from https://r-forge.r-project.org/projects/c3net and from the CRAN package repository.
Conclusions:The availability of gene network inference algorithms with known inferential properties opens a new era of large-scale screening experiments that could be equally beneficial for basic biological and biomedical research with auspicious prospects. The availability of our easy to use software packagec3netmay contribute to the popularization of such methods.
Reviewers:This article was reviewed by Lev Klebanov, Joel Bader and Yuriy Gusev.
Background
A systematic understanding of biological and biomedical problems can only be achieved if the working mechan-isms of molecules in cells of an organism are sufficiently
understood. Since the postulation of the one gene-one
enzyme hypothesisin the early 1940 s by BEADLE and TATUM[1], which sparked molecular biological studies for decades, the current focus of research has shifted toward systems properties of interacting genes [2-7]. With the advent of high-throughput data, we are nowa-days in a position to study the behavior of such systems quantitatively. For instance, microarray experiments pro-vide powerful data sets containing a wealth of informa-tion about the expression of genes that can be exploited
by statistical analysis methods in order to interrogate data systematically [8-14].
One aspect in the context of the analysis of microar-ray data that gained recently widespread interest is the inference of causal interactions among hundreds or
thousands of genes [15-22]. Here by causal we mean
the direct interactions among genes that correspond to experimentally verifiable biochemical interactions. It has been recognized that gene regulatory network inference (GRNI) algorithms are an important means to obtain genome-scale causal interaction networks which seem more amenable for a functional interpretation than other types of data representations [2]. Among the best GRNI methods are information theory based approaches [23-28]. A special subclass of such approaches are infer-ence methods based on estimates of mutual information (MI) values [23,29,30]. In contrast to, e.g., the Pearson correlation coefficient, MI values are capable of detect-ing linear and non-linear effects among gene pairs and, hence, may be more appropriate in a genome context * Correspondence: [email protected]
1Computational Biology and Machine Learning Lab, Center for Cancer
Research and Cell Biology, School of Medicine, Dentistry and Biomedical Sciences, Queen’s University Belfast, 97 Lisburn Road, Belfast, BT9 7BL, UK Full list of author information is available at the end of the article
[31,32]. Recently, a new GRNI algorithm, C3NET [33], has been introduced. C3NET, which is also MI-based, has been compared with other GRNI algorithms [33], including ARACNE, MRNET, CLR and Relevance Net-work (RN) [27,30,34,35], by using F-scores as perfor-mance metric.
The major purpose of the present paper is to analysis the inferential characteristics of C3NET with respect to different network types of gene networks. Specifically, we will study the influence of various network struc-tures, two biological as well as three synthetic ones, using global and local performance metrics. In our pre-vious study [33], C3NET has been introduced and stu-died by using biological networks only. Also, these studies have been conducted focusing exclusively on global performance metrics in form of F-scores. Instead, in this paper we will use four different types of local-network based measures to assess the performance of C3NET. The utility of local network-based measures has been shown in [36,37]. Briefly, global measures like the F-score provide only partial insights into the intricate inferential assessment because they average over the entire network structure resulting in a global perfor-mance measure. However, there may be parts or subnet-works, e.g., motifs or modules, of the overall network that may be significantly better to infer than others. In oder to identify such substructures local network-based measures allow tozoom in these structural regions. In addition, we provide an introduction to the usage of
c3net, a R implementation of C3NET.
Studying the influence of different network structures on the inferential characteristics of any inference algo-rithm is an important task for several reasons. First, our knowledge about the causal interactions of genes or gene products is still quite limited, especially for higher organ-isms like mouse or human. For this reason, we need to rely on simulation studies guiding the selection of GRNI algorithms that could be applied to novel data sets from expression experiments. Because of potentially unknown features of the regulatory networks, underlying these expression data, which may lead to deviations to other networks for which the GRNI algorithm has been tested, knowledge about the robustness of a GRNI algorithm is an essential property that needs to be taken into account when selecting a GRNI algorithm. Second, due to the fact that the robustness of a GRNI algorithm is directly con-nected to the study of different data sets, respectively their underlying network structures, this property cannot be studied by using one or two network types only. Instead, a sensible variety of network types needs to be considered from which simulated expression data can be generated on which the GRNI method is applied to. Regarding a more technical point, in addition to these
studies we investigate the dependency of the inferential performance of C3NET on the MI threshold, or cut-off value, used to eliminate non-significant MI estimates.
This paper is organized as follows. In the next section we describe the methodology and our simulation set-up used for our numerical analysis. In addition, we provide a description of a R package we implemented providing the C3NET algorithm. In the results section we study the inferential behavior of C3NET for various network types, biological and synthetic networks, by using differ-ent performance measures. The paper ends with discus-sions and concluding remarks.
Methods
One major objectives of this paper is to analyze the influence of different structures of gene networks on C3NET. Our rational for this is at least three fold. First, the knowledge of thetruestructure of transcription reg-ulatory, metabolic or signaling networks is still at its infancy. For this reason it is difficult to select a prioria single synthetic network type which is best for testing an inference algorithm. This is even more true in the presence of a disease which may lead to the rewiring of smaller or larger portions of one or more of the above mentioned gene network types. Hence, in order to allow the application of an inference algorithm to data sets from biomedical or clinical studies, with potentially diffi-cult to anticipate interaction patterns, a broad analysis is indispensable. Second, despite the fact that it is com-monly acknowledged that the degree distribution of gene networks follows a power law, this property does not define the structure of a network uniquely. For
instance, the preferential attachment algorithm [38]
Brief overview of C3NET, RN, ARACNE and MRNET In this section we provide a brief overview of the GRNI algorithm C3NET, introduced in [33]. Principally, C3NET consists of two main steps. The first step is for the elimination of nonsignificant edges, whereas the sec-ond step selects for each gene the edge among the remaining ones with maximum mutual information value. The first step is common to many GRNI algo-rithms, for instance Relevance Network (RN) [23], ARA-CNE [30], MRNET [27] and CLR [35]. This statistical inference step is essential to eliminate nonsignificant
links, according to a chosen significance level a,
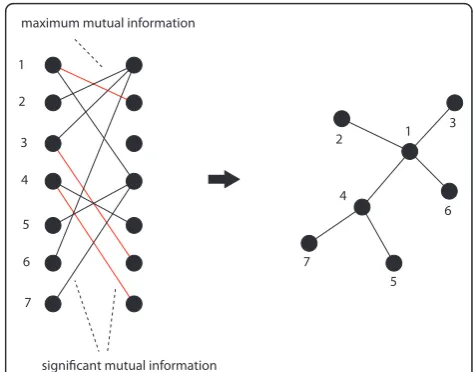
between gene pairs. In the second step, the most signifi-cant link for each gene is selected. This link corresponds also to the highest MI value among the neighbor edges for each gene. This implies that the highest possible number of edges that can be inferred by C3NET is equal to the number of genes under consideration. This number can decrease for several reasons. For example, when two genes have the same edge with maximum MI value. In this case, the same edge would be chosen by both genes to be included in the network. However, if an edge is already present another inclusion does not lead to an additional edge. Another case corresponds to the situation when a gene does not have significant edges at all. In this case, apparently, no edge can be included in the network. Since C3NET employs MI values as test statistics among genes, there is no direc-tional information that can be inferred thereof. Hence, the resulting network is undirected and unweighted. The principle working mechanism of C3NET is visua-lized in Figure 2. For a detailed explanation of C3NET, the reader is referred to [33].
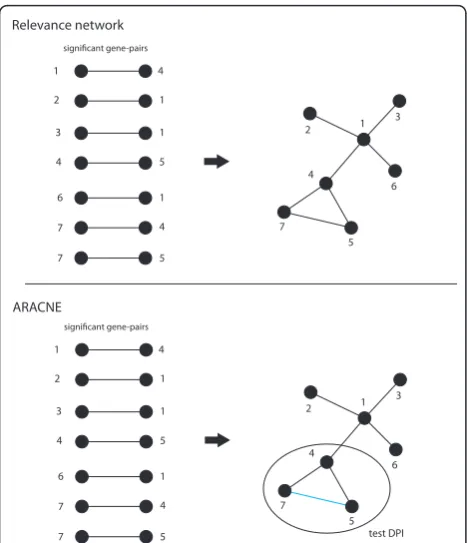
The principle idea of RN [23] is to compute all mutual information (MI) values for all pairs of genes and declare mutual information values as significant if their
corresponding value is larger than a given thresholdI0.
The first step of ARACNE [30] is similar to RN. In a
second step ARACNE uses thedata processing
inequal-ity(DPI) to eliminate the smallest mutual information value of gene-triplets if this value is below a certain threshold. The parameter that controlles this threshold has been called the tolerance parameter [30]. Both methods are visualized in Figure 3.
MRNET [27] is an iterative algorithm that identifies potential interaction partners of a target gene Y that maximize a scoring function.
Xjs= argmax
Xj∈V\S
(sj) (1)
sj=I(Xj;Y)− 1 |S|
Xk∈S
I(Xj;Xk). (2)
When a gene, Xj, is found with a score that
maxi-mizes Eqn. 1 and sjis above a threshold, s0, then this
gene is added to the set S. The basic idea of MRNET is to find genes that are of maximal relevance (first term
in Eqn. 2) for Y, but introduce a minimum redundancy
(second term in Eqn. 2) with respect to the already found interaction partners in the set S.
Implementation of C3NET: Usage of the R package In order to make C3NET usable for biologists we imple-mented a R package calledc3net. The software package c3net is available from the web site https://r-forge.r-project. org/projects/c3net and from the CRAN package repository. To illustrate the principle working mechanism of the package we provide an example data set for which we Figure 1 Illustration of the general influence that various
conditions have on the structure, the characteristics and the size of gene networks.
1
2
3
4
5
6
7
1 2
4
3
5 6
7
significant mutual information maximum mutual information
discuss in the following its analysis. The data set and the
true network are loaded in R by executing the data
(expdata)and data(truenet)commands of c3net. Here, the variable for the data set is expdataand the variable
for the true network is truenet. There is a compact
function available in the c3netpackage with the same
name,c3net, that takes the data set as input and outputs the inferred network. This is convenient for the user, because it hides the complexity of individual steps of C3NET, providing an all-in-one single command. The usage of the function and its default parameters are as follows: c3net(dataset, alpha = 0.01, methodstep1=“ cut-off”, cutoff MI = 0, MTCmethod=“BH”, itnum = 5, net-work = FALSE). Here datasetis the data set andalpha
is a user defined significance levela. For the parameter
methodstep1 one can assign three different options, {”cutoff“, “MTC“, “justp“}, in order to choose a proce-dure to eliminate nonsignificant edges. Ifmethodstep1=
“cutoff“ then its dependent parameter cutoffMIneeds to be set to a numerical value that is used as cutoff value to eliminate nonsignificant MI value of edges in Step 1
of C3NET. If methodstep1 =“MTC“ then a multiple
testing correction (MTC) method is used in Step 1 of C3NET. In this case, a MTC method needs to be
speci-fied by the dependent parameter MTCmethod (e.g.
MTCmethod= “BH”). Available options of different
MTC methods are“BH”,“bonferroni”, “BY”, “hochberg”, “holm”,“hommel”. Also,itnumneeds to be set to specify the number of iterations to obtain a null distribution and alphathe statistical significance level. If method-step1 =“justp” then only alphaand itnum need to be set and the elimination in Step 1 is done with respect to the p-values and the significance levelaonly.
In addition to providing the inference procedure of C3NET [33], thec3netpackage allows also a visualization of the inferred network by utilizing theigraphpackage [40]. This can be accomplished by setting the parameter
networktoTRUE. As an example one can executenet=
c3net(expdata, network = TRUE). Further,c3netprovides a function to validate the performance of the inference
called checknet. This evaluation can be obtained by
executingchecknet(net, truenet). Thechecknet function results in the following six values: precision, F-score, recall, TP, FP and FN. For the provided example data set the functionchecknetgives precision = 0.96, F-score = 0.34, recall = 0.21, TP = 181, FP = 6, FN = 683. We would like to emphasize that thec3netpackage provides additional functions that allow to perform individual steps only instead of performing the entire inference step. This allows a flexible combination with components outside our package the user may want to use.
In order to learn the usage ofc3net quickly we
com-piled a file with the name EXMAPLE.TXT containing examples that can be executed line-by-line demonstrat-ing the functionality of c3net. Additional help for each function ofc3netis available by using the helpfunction for each command. Further, we produced a vignette file which can be found in theinstfolder of c3netwhere all explanations and examples of the functions ofc3net can be found in a PDF document.
Simulation methodology
For our study we use two biological and three synthetic networks, each consisting of 100 genes. As synthetic networks we use a directed acyclic graph (DAG) [41], a scale-free (SF) network [38] and a random network (RND) [42]. To generate these networks we used GeNGe [43]. The real biological networks were obtained by randomly sampling a subnetwork of size 100 from the transcriptional regulatory network ofE. coli [44,45]
and of yeast[46] by using SynTReN [47]. Our overall
simulation set-up is shown in Figure 4. It is important to emphasize that any network inference algorithm operates on dataD, which are a function of the
underly-ing network G. Hence, the inferred or estimated
net-workG’is a function ofD(G). For this reason, variation of the structural connectivity of a network has a crucial influence on the dynamic states of the network and, consequently, on the performance of an inference algorithm.
1
2
3
4
6
7
1 2
4
3
5 6
7
significant gene-pairs
4
1
1
5
1
4
7 5
Relevance network
1
2
3
4
6
7
1 2
4
3
5 6
7
significant gene-pairs
4
1
1
5
1
4
7 5
ARACNE
test DPI
For each of the above networks, we generated simu-lated expression data, including biological noise, by using SynTReN [47]. The noise model used by SynT-ReN is a lognormal distribution. This model is sup-ported by experimental findings [48]. We repeated this step 300 times, generating 300 different data sets for each network type by changing the kinetic parameters for each simulation at each step. This way the biological variability of a population of similar organisms is imi-tated. We used these data sets for an ensemble-based performance analysis. This allows to measure important network statistics of C3NET, both on the global and local network level, for each network. In total we gener-ated 2100 gene expression data sets with steady-state values of varying sample sizes. These data sets were copula-transformed before applying the MI estimation algorithm [30]. For the estimation of MI values a non-parametric Gaussian estimator was used [26,49]. The DPI tolerance parameter of ARACNE, when used for comparison purposes, was chosen as 0.1 [30].
In the first step of C3NET, aiming at the elimination of nonsignificant edges, we used the optimal cut-off value, which is the threshold (I0) that maximizes the
F-score for each data set with respect to the true underly-ing network structure [36,37]. We want to emphasize that also for all other methods studied we used their optimal thresholdI0. The F-score is defined as F= 2pr/
(p+r), wherepcorresponds to the precision,p=TP/ (TP+FP), andr to the recall, r =TP/(TP+FN). Here TP (true positives) is the number of correctly inferred edges, FP (false positives) the number of incorrectly inferred edges and FN (false negatives) the number of true edges that could not be inferred.
Results
In the following sections we investigate the inferential characteristics of C3NET with respect to the structure of the underlying gene network by using two fundamen-tally different types of performance metrics. One type of metrics allows a global analysis of the inference algo-rithm only, the other permits a local one, allowing to
zoom in building blocks of the network and their assessment.
Global performance metric
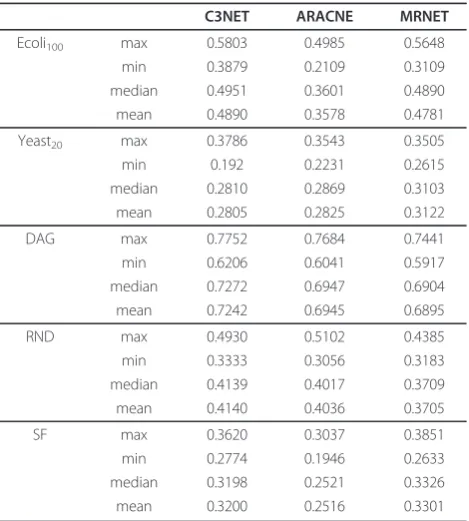
In this section we investigate the global inference per-formance of C3NET for five network types and different sample sizes. We also compare it with two other GRNI methods, namely ARACNE and MRNET. Table 1 sum-marizes our results. From this table we see that, in gen-eral, C3NET gives higher F-score values than the other inference methods for the studied cases. Specifically, in three out of five cases the median (and mean) F-scores of C3NET are higher compared to the other two GRNI algorithms.
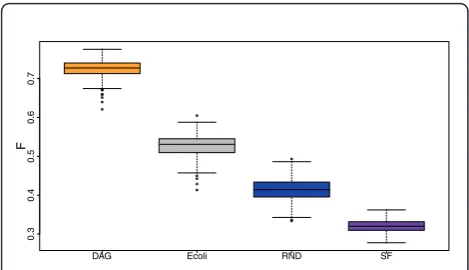
In order to clearly illustrate the inference performance of C3NET in dependence on the different network types, we plot in Figure 5 a summary of the correspond-ing F-scores. This figure suggest that C3NET obtains its best inference performance for DAG networks, with a significant margin to all other network types. The sec-ond best performance is obtained for the (real) biologi-cal network of E. coli, with an about 0.2 lower F-score. Then, the RND network follows and finally the SF net-work, with a median F-score that is slightly larger than 0.3. This figure demonstrates also that C3NET behaves differently for all four network types. This means that none of the three synthetic networks could serve as a
‘good model’for the transcriptional regulatory network ofE. coli. Interestingly, the RND network is closest with Figure 4Illustration of the dependencies of the data and,
hence, of the inference algorithm on the underlying network structure.
Table 1 Summary of various F-score statistics
C3NET ARACNE MRNET
Ecoli100 max 0.5803 0.4985 0.5648
min 0.3879 0.2109 0.3109
median 0.4951 0.3601 0.4890
mean 0.4890 0.3578 0.4781
Yeast20 max 0.3786 0.3543 0.3505
min 0.192 0.2231 0.2615
median 0.2810 0.2869 0.3103
mean 0.2805 0.2825 0.3122
DAG max 0.7752 0.7684 0.7441
min 0.6206 0.6041 0.5917
median 0.7272 0.6947 0.6904
mean 0.7242 0.6945 0.6895
RND max 0.4930 0.5102 0.4385
min 0.3333 0.3056 0.3183
median 0.4139 0.4017 0.3709
mean 0.4140 0.4036 0.3705
SF max 0.3620 0.3037 0.3851
min 0.2774 0.1946 0.2633
median 0.3198 0.2521 0.3326
mean 0.3200 0.2516 0.3301
respect to the F-scores obtained for the subnetwork ofE. coli.
It is important to note that the results presented in this section were obtained by using the optimal thresh-old values (I0) for all algorithms (C3NET, ARACNE and
MRNET). This threshold is used in the first step in each of the algorithms. Apparently, the optimal cut-off value can only be obtained in studies where the (true) refer-ence network is known. With respect to the obtained results, this implies that our results represent upper bounds which cannot be exceeded by any method trying to estimate this cut-off value from the data. For instance, performing a resampling of the data in order to estimate the cut-off value from the sampling distribu-tion of the null hypothesis for each algorithm could not result in better results but leads only to similar results at best.
Local Network-based performance metrics
In this section, we analyze the inference performances of C3NET locally, investigating various network types by using local network-based performance metrics. The local network-based measures used in this section have been introduced in [36,37].
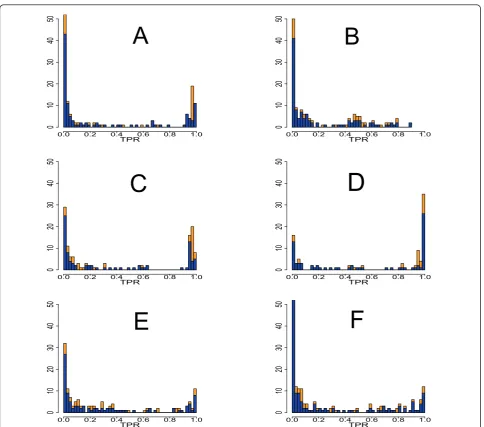
The first property we study is the influence of activa-tor (positive effect) and repressor (negative effect) edges on the inferability of the network. This property of an edge is given by the dynamical equations we used to simulate expression data. If a gene has a positive cou-pling to a second gene, this edge is called activator, if the coupling is negative, this edge is termed repressor. Overall, this means we study the inference performance of C3NET with respect to a binary edge type because an edge is either an activator or an repressor but cannot be both. In Figure 6 we show histograms for various
sample sizes and networks, to visualize the effect of acti-vator edges (blue) and repressor edges (orange) on the true positive rate (TPR) of individual edges. The TPR of an edge is the fraction of the number of times a specific edge is correctly inferred, divided by the size of the ensemble (300). In order to assess the results in Figure 6 quantitatively, we apply a two-sample Kolmogorov-Smirnov test [50] for testing for differences in the cumulative distribution function (CDF) of activator and repressor edges. Coarsely speaking, this test reveals whether the CDFs of the two edge types show heteroge-neous behavior or not, when C3NET is used as infer-ence algorithm.
Figure 6 A shows the results for a subnetwork ofyeast
that consists of 100 genes. The sample size used for these simulations was 200. Figure 6B is obtained for the same network, however, for a sample size of 20. This allows to study the influence of the sample size on the performance of C3NET. Figure 6C is obtained from a subnetwork ofE. coli, Figure 6D is from a DAG, Figure 6E is from a random network and Figure 6F is obtained from a scale-free network. All these networks contain 100 genes and their data set has a sample size of 1000.
For the subnetwork of yeast with sample size 200, a
two-sample Kolmogorov-Smirnov test gives a p-value of 0.002785. For the same network, but a sample size of 20, we obtain a p-value of 0.08638. This result suggests that, for a significance level of a = 0.01, the edge type has a systematic effect on the inferability of C3NET, if the sample size is large. This can be confirmed visually from the histogram shown in Figure 6A. Here the repressor edges (orange) have a notably higher TPR and are, thus, easier to infer by C3NET. Overall, this means that C3NET is sensitive to the used sample size. For a sample size of 20, the p-value appears not significant suggesting that there is no heterogeneous behavior in the CDFs and, thus, we cannot conclude that one of the edge types is better inferable than the other. For theE. coli network, a Kolmogorov-Smirnov test results in a p-value of 0.002112. The result suggests that, for a signifi-cance level of a= 0.01, the edge type has a systematic
effect on the inference of the E. coli network using
C3NET. If we look at the histogram for this network in Figure 6, we qualitatively observe that the repressor edges (orange) again seem to have higher TPRs and, thus, are easier to infer with C3NET. For the three syn-thetic networks a two-sample Kolmogorov-Smirnov test results in the following p-values: 0.02942, 0.1238, 0.2387 for the DAG, RND and SF network, respectively. These results suggest that for neither network the edge type has a systematic effect on its inference (for a significance
level ofa= 0.01), although, the DAG network shows a
certain tendency toward it. However, considering the large sample size used for these results it appears DAG Ecoli RND SF
0.3
0.4
0.5
0.6
0.7
F
Figure 5 Performance of C3NET with respect to different network types. Each network consists of 100 genes. Sample size is 1000 for each of the 300 data sets generated for each network type. DAG: Directed acyclic graph. E coli: Subnetwork from the
sensible for not considering this p-value as significant. Interestingly, all these results point to a crucial differ-ence between the results for synthetic and real biological
networks. Overall our results suggest that C3NET’s
inference performance is affected by the edge type only for real biological networks for large sample sizes. The fact that C3NET is effected for large, but not small sam-ples sizes means that this dependence appears not to be spurious. (If it would be reversed it would indicate a sys-tematic bias introduced by the sample size because the chosen value of the lower sample size is somewhat arbi-trary whereas the large sample size is an approximation
of the asymptotic behavior of C3NET.) For the yeast
andE. colinetwork the repressor edges seem to be bet-ter inferable than activator edges. For all synthetic net-works the edge type has no effect on the inference performances.
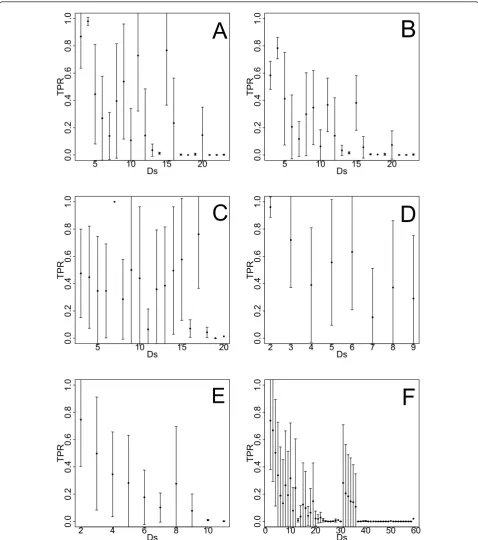
The second network-based measure we use allows to detect a possible effects of the local network structure surrounding an edge, on its inferability. More precisely, we de ne the metric,Dsij, as the sum of the out-degree
of node i plus the in-degree of node j [37]. Here the
edge between i and jrefers to a directed connection.
The effect ofDsijon the mean TPR (TPR)of edges is in the following used to asses the performance of C3NET. For this analysis we use the same data sets and the TPR
0.0 0.2 0.4 0.6 0.8 1.0
0
102
03
04
05
0
TPR
0.0 0.2 0.4 0.6 0.8 1.0
0
102
03
04
05
0
TPR
0.0 0.2 0.4 0.6 0.8 1.0
0
102
03
04
05
0
TPR
0.0 0.2 0.4 0.6 0.8 1.0
0
102
03
04
05
0
TPR
0.0 0.2 0.4 0.6 0.8 1.0
0
102
03
04
05
0
TPR
0.0 0.2 0.4 0.6 0.8 1.0
0
102
03
04
05
0
A
B
C
D
E
F
networks we used in Figure 6. Figure 7 illustrates the
functional relationship between the mean TPR (TPR)
andDsfor all networks. Here the order of the network type is the same as in Figure 6. In order to quantita-tively investigate whether there is a systematic effect of
Ds on (TPR) we apply an one-factor ANOVA test to
test for equal means of the TPR for each network type.
The six ANOVA tests give p-values of 7.35 × 10⁻⁶,
0.01191, 0.02172, 5.21 × 10⁻⁶, 5.39 × 10⁻⁷, 6.63 × 10⁻⁶
respectively for the subnetwork of yeast with sample
5 10 15 20
0.0
0.2
0.4
0.6
0.8
1.0
Ds
TPR
5 10 15 20
0.0
0.2
0.4
0.6
0.8
1.0
Ds
TPR
5 10 15 20
0.0
0.2
0.4
0.6
0.8
1.0
Ds
TPR
2 3 4 5 6 7 8 9
0.0
0.2
0.4
0.6
0.8
1.0
Ds
TPR
2 4 6 8 10
0.0
0.2
0.4
0.6
0.8
1.0
Ds
TPR
0 10 20 30 40 50 60
0.0
0.2
0.4
0.6
0.8
1.0
Ds
TPR
A
B
C
D
E
F
Figure 7TPR in dependence on the gene-degree specific measureDs.A:Yeast(sample size 200). B:Yeast(sample size 20). C:E. coli(sample
size 20, the subnetwork of yeastwith sample size 200,
the subnetwork of E. coli, DAG-like, RND and SF
net-works all with sample size 1000. For a significance level of a= 0.01, all three synthetic networks and theyeast
subnetwork with sample size 20 show a heterogeneous
behavior of the TPR with respect toDs using C3NET.
This suggests that the inference performance of C3NET with respect to the TPR is systematically affected by the
values of Ds and, hence, the local network structure
directly surrounding an edge, for those four networks. This can also be observed from the figures, which leads to the conclusion that asDsgets larger the values of the
TPR decrease. On the other hand, our results do not
suggest a systematic dependence of TPR on Dsfor the
subnetwork of yeast (sample size 200) and the
subnet-work ofE. coli (sample size 1000). Again, given the large sample size for these cases, but also the large margin to the p-values of the three synthetic networks, suggests, that there is a significant difference between the results for the biological and synthetic networks. Therefore, we conclude that, in general, C3NET’s inference perfor-mance is for the three synthetic networks significantly
influenced by the values of Ds, but only moderately
effected for biological networks.
Next, we asses the performance of C3NET with respect to basic motif types consisting of three genes. For this purpose, we use a motif metric also used in
[36,37]. For each motif type we calculate the true
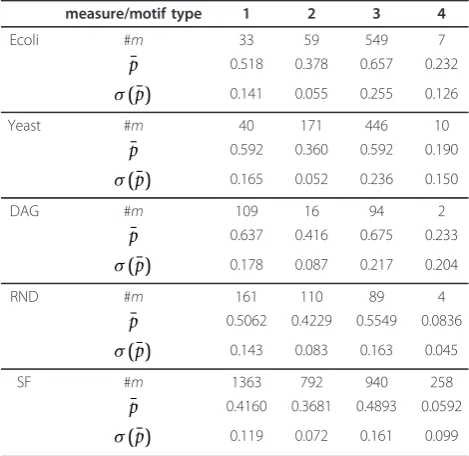
reconstruction rate which is the sum of the true positive rates (TPR) for existing and true negative rates for non-existing edges in each motif type. The details of this local network-based measures can be found in [36,37]. In Figure 8, we show the four motif types used for our analysis. These are directed motifs resulting from the interactions of three genes. The results for C3NET of our numerical analysis are presented in Table 2. In this table, p¯ represents the mean true reconstruction rate, #mrepresents the number of motifs found in a network and σ(¯p) is the standard deviation of p¯.
From Table 2 we observe that C3NET consistently infers motifs of type 3 better than the remaining motifs, for all network types, with respect to the mean true reconstruction rate. Then motif type 1 allows the second best inference. It is worth mentioning that it has only slightly lower p¯ values and, hence, has a similar good inferability as motifs of type 3. Motifs of type 2 rank third, however, there is already a significant gap to motifs of type 1 and 3. Motifs of type 4 cause the big-gest difficulties which can be seen from their low ¯p
values. However, in most networks this motif type is
only observed a few times (low #mvalues) which may
result in unreliable estimates. Only in the SF network motifs of type 4 can be found multiply. For this net-work, the results for p¯ clearly indicate that C3NET can hardly infer motifs of this type.
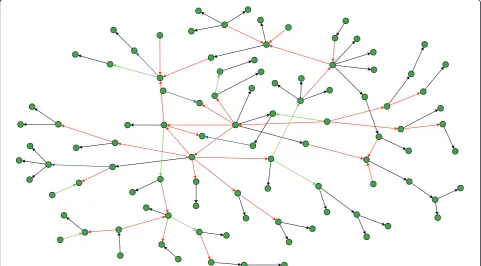
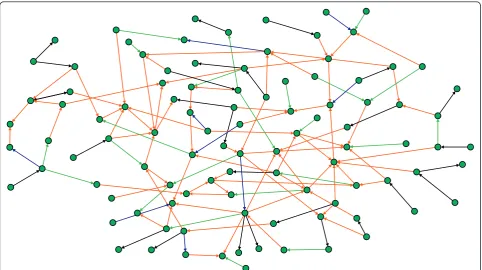
The last local network-based measure we use in our analysis assesses the inferability of every single edge in a network and, thus, provides the nest resolution of any error measure since an edge is the most basic compo-nent of a network [36,37]. In the following, we evaluate the mean TPR of each edge. For reasons of simplicity, we divide the values of TPR into four categories and visualize the edges in the networks correspondingly. Specifically, we are using the following color code for Figure 9 and Figure 10: Black edges, 1 ≥ TPR > 0.75, blue edges, 0.75 ≥ TPR > 0.5, green edges, 0.5≥ TPR > 0.25, and red edges, 0.25≥ TPR ≥0.0. Visualizations of our results for a DAG and a RND network are shown in Figure 9 and Figure 10. The sample size for these simu-lations was 1000. From these networks we observe that C3NET infers all leaf edges, because all leaf edges in all networks are colored black (for SF we obtain similar results - not shown). Here a leaf edge is defined as an edge that connects to a leaf node, which has only one incoming edge and no outgoing edges. The results for the motifs in Table 2 are also supportive for this finding regarding the inferability of leaf edges (Figure 9 to Fig-ure 10), because a motif of type 3 can be formed by two leaf edges. This observation allows us to hypothesize that C3NET can easily infer the leaf edges for all the considered network types. It can be further observed from the red edges that C3NET has difficulties in
inferring the cross connected edges that are ‘deeper’ inside the network.
Cut-off effects
Finally, we investigate the influence and the sensitivity of the cut-off valueI0on C3NET. This cut-off value is
used in the first step of C3NET in order to eliminate non-significant edges, as described in the methods sec-tion. Practically, this cut-off value needs to be estimated by resampling the data and selecting a significance level a. However, if the estimated cut-off value deviates from the optimalcut-off value, it may lead to a decrease in the performance of the inference algorithm that uses this cut-off value. In order to analyze the influence of I0
on C3NET we vary its value systematically within a wide range and observe the inference performance of C3NET for each of these values by calculating F-scores. Since the first step of C3NET is equivalent to RN, we also illustrate its behavior in Figure 11 to have a com-parison. For the results shown in this figure, we used
the subnetwork ofyeast and one data set with sample
size 200 (result for other data sets and network types look similar, not shown). From this figure we observe at least two things. First, there is a large margin between the F-scores for C3NET and RN. Hence, any cut-off value below ~1.75 leads to better results which makes the finding of the optimal cut-off value for C3NET less important. Second, the optimal cut-off value for C3NET assumes usually quite low values, but any value up to about ~1.0 results in F-scores that are only a couple of percentages worse than for the optimal value. This indi-cates the robustness of C3NET and the existence of a at plateau around the optimal cut-off value with respect to F-scores.
Conclusions
In this study we investigated the influence of the struc-ture of gene networks on their inference by using C3NET. Our analysis using a global performance metric demonstrated that C3NET provides consistently super-ior or at least competitive results compared to other inference algorithms widely used [27,30]. This result holds robustly for different biological and synthetic net-works. Other inference algorithms show a more sensi-tive behavior in dependence on the used network type. Interestingly, the global performance metric revealed that the inference performance of C3NET is best for a DAG network followed by a subnetwork of the tran-scriptional regulatory network ofE. coli, whereas the SF network received the lowest F-scores. This points to a crucial difference of the latter two network types. As discussed brie y in the ‘Methods’section, one network property, in this case the scale-free behavior of the degrees, is not sufficient to determine a network. Hence, Table 2 Summary of the statistics for the inferability of
motifs
measure/motif type 1 2 3 4
Ecoli #m 33 59 549 7
¯
p 0.518 0.378 0.657 0.232
σ(¯p) 0.141 0.055 0.255 0.126
Yeast #m 40 171 446 10
¯
p 0.592 0.360 0.592 0.190
σ(¯p) 0.165 0.052 0.236 0.150
DAG #m 109 16 94 2
¯
p 0.637 0.416 0.675 0.233
σ(¯p) 0.178 0.087 0.217 0.204
RND #m 161 110 89 4
¯
p 0.5062 0.4229 0.5549 0.0836
σ(¯p) 0.143 0.083 0.163 0.045
SF #m 1363 792 940 258
¯
p 0.4160 0.3681 0.4893 0.0592
σ(¯p) 0.119 0.072 0.161 0.099
Summary of motif statistics for all considered networks. #mis the number of motifs, p¯ is the mean true reconstruction rate for a motif ands(p) is its standard deviation. The sample size is for all cases 1000 except theYeast
the assumption that a SF network may be a good model of real transcription regulatory networks is ill-posed. Our results suggest that the algorithm used by GeNGe [43] to generate SF networks should be revised in order to produce scale-free networks that are more close to biological transcriptional regulatory networks. A general discussion of the point follows below.
From a complementing analysis, using local network-based performance metrics, we found the following.
First, C3NET is differently affected by repressor and activator edges for the biological networks only. For these networks, repressor edges are in general easier to infer than activator edges. This corresponds with results obtained for ARCNE, CLR, MRNET and RN which showed also a significant behavior [37]. This point dis-closes a general concern many GRNI algorithms seem Figure 9Inferability of a random network consisting of 100 genes (sample size 1000). Black edges, 1≥> 0.75, blue edges, 0.75≥> 0.5, green edges, 0.5≥> 0.25, and red edges, 0.25≥ ≥0.0.
Figure 10Directed network motifs with three genes. 1) chain, 2) collider, 3) fork, 4) triangle..
to suffer from. As a potential reason for this problem we
speculate that activating effects may be ‘additive’
whereas repressor edge are more canalizing [51]. This would imply that repressor edges act moredecisivethan activators which may be involved in the logical control of other genes, as a collective. Second, the inference per-formance of C3NET is affected by the sum of the in-degree and out-in-degree of edges (Ds), but only for syn-thetic networks. This is in contrast to the GRNI algo-rithms ARACNE and CLR which showed a significant dependency onDs[37]. Due to the fact that significant results point to a bias in the inference abilities of a GRNI algorithm, C3NET maybe preferred over these methods in order to circumvent potential problems. Third, we showed that the inference performance of C3NET depends for all studied networks on the type of a motif. This observation is also supported by the visua-lization of the networks which indicates that leaf edges have in general a very high inferability. Due to the fact that motifs of type 3 can be formed by two leaf edges, in contrast to all other motif types, it is plausible that this motif type can be inferred best. Taken together, the information gathered from these complex dependencies of C3NET on the conditions of the underlying gene reg-ulatory network are an important source of information for theoretical but also practical reasons. First, the results of our analysis allow to address specific aspects of the inference algorithm in order to refine C3NET. It is immediately clear that pinpointing a problem is the first step of revising any method. For this reason, our results can also be seen as an exploratory analysis in this context. Second, for potential users of our algorithm the obtained information may be helpful in selecting among various available algorithms for the inference of gene regulatory networks. This practical point is espe-cially important because, as demonstrated by our analy-sis, the behavior of an inference algorithm is not straight forward to predict for given conditions but there are subtitle differences among the available meth-ods. Depending on the intended application purpose and the characteristics of the domain, especially for bio-medical data, these differences may be weighted differ-ently by different users. Our comprehensive analysis offers a rich source of information for potential users in order to make a con dent selection. Third, in order to make it easier for biologists to use C3NET we provide a freely available and user-friendly R implementation.
In addition to the above results, our investigations revealed another interesting point, which is, in fact, not directly related to the inference of regulatory networks. Instead, this point relates to the differences between real biological and synthetic networks as observed in the sig-nificantly different behavior of C3NET. More precisely, the comparison of F-scores (see Figure 5) but also Ds
(see Figure 7 and the results from ANOVA tests) showed that there is a clear discrepancy between these two types of networks in the way that none of the stu-died synthetic networks could serve as a‘good model’of real biological networks. Or in other words, the syn-thetic networks seem to lack important properties resulting in discriminatory features that reflect in the performance of C3NET. Turned differently, as assess-ment if a synthetic network is capable of mimicking, e. g., a transcriptional regulatory network one could com-pare the inferential characteristics of a GRNI algorithm in order to judge complementing features that are based on graph-theoretical properties [52-55].
A problem that is of eminent importance for the prac-tical application of any inference algorithm is the esti-mation of the threshold parameter I0. Due to the fact
that all algorithms use nonparametric tests this requires the appropriate randomization of the data. Computa-tionally, this possess a challenge for a comprehensive analysis.
On a more general note, the large-scale inference of statistical entities [56,57], for instance of gene regulatory networks, possesses many difficulties and we are facing unprecedented problems. However, due to an intensified effort of the community [58,59] it can be expected that we are entering an era that will lead to dramatic changes and further developments in the computational but especially statistical methodologies involved in this endeavor. Such developments are necessary, in order to deal with high-throughput data reliably allowing to con-nect basic biological and medical research programs [60].
Reviewers’comments
Reviewer’s report 1
Lev Klebanov, Department of Probability and
Statis-tics, Charles University, Czech Republic.
the function and its default parameters are as follows: c3net(dataset, alpha = 0.01, methodstep1 =“cutoff”,
cut-off MI = 0, MTCmethod="BH”, itnum = 5,network =
FALSE). Here dataset is the data set and alpha is a user defined significance level. For the parameter method-step1 one can assign three different options, “cutoff”,
“MTC”,“justp”, in order to choose a procedure to elimi-nate nonsignificant edges. Let us note that available options of different MTC methods are “BH”, “ bonfer-roni”, “BY”, “hochberg”, “holm”, “hommel”. Also,
“itnum” needs to be set to specify the number of itera-tions to obtain a null distribution and alpha the statisti-cal significance level. If methodstep1 =“justp”then only alpha and itnum need to be set. Authors generated simulated expression data, including biological noise, by using SynTReN. As it was mentioned above, the manu-script seems to be interesting, and contains a lot of new results. However, I have some comments (see below) concerning the use of proposed software.
Comments:
1. As it was mentioned above, some parameters and/ or options like“alpha”,"BH”,“BY” and so on, has to be defined. Unfortunately, the authors did not mention how sensible is the model to the choice of the para-meters and options. For example, how will it change if one will usea= 0.05 instead ofa= 0.01? In reality, one does not know what level alpha has to be used. If the result will changed dramatically, it will show that the system cannot be used. In contrary, the system has to be sensible to large changes of significance level.
2. The same question may be addressed to the option in MTC. For example, it is not clear, what should be difference between“bonferroni” and“hochberg”. How-ever, the difference between “bonferroni” and “holm” should not be dramatical (from my view).
3. As it was mentioned above, the authors simulate expression data, including biological noise. I do not understand, what distribution have corresponding ran-dom variables. If it is Gaussian distribution, than the use of Pearson correlation coefficient is absolutely correct, and one does not need to use mutual information (MI) (for Gaussian distribution there are no nonlinear effects). Because the authors use MI, they, probably, have non-Gaussian distribution for either expression data or for biological noise. What is this distribution, and what are the reasons for its use.
Author’s response
Answer to 1: The reviewer addresses a very important point. Due to the fact that the inference of regulatory networks is a multi-step procedure rather than a mono-lithic method we focused in this paper on the influence of the underlying network structure on its inference. That means we did not attempt to address all problems explicitly. In our experience, the influence of the
significance level needs to be discussed in a method-spe-cific manner. The reason for this is that each method employs a different philosophy in applying the hypoth-eses tests. With respect to C3NET the exact value of a has no large influence on its performance as long as the chosen significance level is reasonable with respect to the noise in the data. Specifically, C3NET allows each
gene to add at most one edge to another gene. This
edge has also the maximum mutual information value between this gene and all other genes in the study and, hence, this edge has also the lowest p-value of all these edges. Numerically, we found that C3NET behaves very
robustly with respect to small changes in a. However,
we agree with the author that this needs to be studied comprehensively.
Answer to 2: The problem of multiple testing correc-tions (MTC) is in the literature of GRN not very well studied and deserves much more attention. Due to the correlation among the test statistics (because otherwise no network could be inferred) only MTCs taking this into account should be recommended. However, we think that none of the available methods is optimally designed for this type of problem, demanding a metho-dological extension.
Answer to 3: For the generation of simulated expres-sion data, we employed SynTReN [47]. In [47] it is described that a lognormal distribution is used to model noise, justified by experimental findings in [48]. Cur-rently, there are many algorithms available for generat-ing simulated expression data. The reason for usgenerat-ing SynTReN instead of another algorithm is that it is well known in the community. We added a description of this to the section‘Simulation methodology’.
We are very grateful for your comments.
Reviewer’s report 2
Joel Bader, Johns Hopkins University, School of Med-icine, USA.
another. The C3NET algorithm restricts its final predic-tion to a minimal spanning tree (MSTs). If the true net-work has edges that are not part of a minimal spanning tree, these edges will be necessarily missed by C3NET. Networks that are closer to MSTs will be easier for C3NET and, other aspects being similar, harder for algorithms that generate more general network topolo-gies. Therefore the sparsity of the networks simulated could affect the performance. For a broader comparison, there have been DREAM challenges that pose the pro-blem of network inference. It would be better to apply C3NET and the other algorithms to this public data for a better calibration with other algorithms. Finally, for readability, the authors should make the manuscript and the figure captions more self-contained. The algorithms should be presented as part of the methods, and the dif-ferences between algorithms should be made clear.
Detailed review: This manuscript investigates the per-formance of C3NET, a method developed to infer the structure of gene regulatory networks (GRNs) from gene expression data. C3NET is compared with ARACNE, another GRN inference method. Data sets are generated from network models designed to mimic expression data from GRNs with 100 genes. The methods section states that “In the first step of C3NET, aiming at the elimination of nonsignificant edges, we used the optimal cut-off value, which is the threshold (I0) that maximizes the F-score for each data set with respect to the true underlying network structure [36,37].”This would seem to give an unfair advantage to C3NET, since in any application to real data the true network will be unknown. It is not clear how the parameters are set for other methods. On p. 7 the authors state“The DPI tol-erance parameter of ARACNE, when used for compari-son purposes, was chosen as 0.1 [30],” but later they state“the results presented in this section were obtained by using the optimal threshold values (I0) for all
algo-rithms (C3NET, ARACNE and MRNET).”These
state-ments seem inconsistent. This also creates questions about how the results for synthetic data would look within tuning. The authors must describe how to set the parameters appropriately without knowledge of the true network structure. There have been several assessments of GRN inference through the DREAM challenge, and ideally it would be worthwhile to apply to some of these published data sets also. The manuscript should be modified to make the methods and results more self-contained. While some references to technical details are acceptable, it is too much to ask a reader to refer to previous papers for essential information such as the method itself (which can be compactly specified), for performance metrics, etc. The discussion of the perfor-mance for different edge types, p. 9, is a bit confusing because two concepts are being explored: (1) the recall
or true positive rate of activator vs. repressor edges; (2) the p-value for a test that compares TPR for activator vs. TPR of repressor. The authors show that, with suffi-cient samples, the p-value is significant. But it is also important to provide the estimates for the TPR for the two types of edges. Since edges in random networks occur with probability proportional to the product of in-degree and out-in-degree, the in-degree product (or its log) might be a better covariate to explore than the degree sum (p. 9). Again, estimates of the size of the effect should accompany calculations of p-values. For the inference of leaf nodes, p. 11, it is important to know whether the simulated network has more leaf nodes than the larger networks they were sampled from. This would affect performance with real data. The figure cap-tions should be revised to permit figures to be under-stood without referring to the main text.
Author’s response
We agree with the reviewer that it is very important to apply the same conditions for all methods. This point is
explicitly emphasized in section‘Global performance
metric’in the last paragraph. For this reason, we used for all studied algorithms their optimal parameter values in order to provide a fair comparison. We improved this explanation in the main text. We used 100 genes in our networks in order to reduce the computational complexity of the problem. This way we were able to study thousands of different data sets, instead of a single one as is the case for biological data, gaining insights into the population behavior of the studied inference methods. Due to the fact that we are studying an inferential problem this approach has advantages from a statistical point of view. The reviewer is completely right in stating that the structure of the network influences their inference. That is why we decided to make this the major topic of this paper because this fact has not been studied before systematically.
As explained above in our response to the comments made by reviewer 1, the inference of a GRN is a multi-step procedure. For reasons of clarity we did not aim to address all problems that this topic offers, instead, we focused on a few questions. The reviewer is entirely right pointing out that the randomization of the data, in order to obtain estimates for the thresholdI0, is of
We improved the description of our results for activa-tor and repressor edges. The point is that from an abstract point of view we study the inference perfor-mance of different classes of edges. Each such class is defined by certain properties, e.g., the degree of the edge enclosing genes, or the type of an edge (activator or repressor). For this reason each edge is not only stu-died once but appears in each different class. The esti-mates for the TPR for activator and repressor edges is shown in Figure 6. We revised the text in order to clar-ify this.
The reviewer’s suggestion to use the logarithm of the product of the degrees of genes, instead, of their sum as used in this paper, is a good idea. We tried several dif-ferent measures, including a similar one as the sug-gested, and found essentially similar results as reported in the results section. However, we did not study this comprehensively.
The used network structures forE. coliand yeastwere obtained by randomly sampling the transcriptional regu-latory networks of these organisms, employing SynT-ReN. That means these networks are representatives of the larger networks, within statistical variations. The total number of leaf nodes does actually not influence the finding that the corresponding leaf edges, statisti-cally, are better to infer than other edges. However, we agree that the network structure has a profound influ-ence on the inferability. All figure captions have been revised in order to make them more understandable.
The methods section has been extended including more detailed explanations of the used inference algorithms.
We are very grateful for your comments.
Reviewer’s report 3
Yuriy Gusev, Lombardi Cancer Center, Georgetown University, USA.
This reviewer provided no comments for publication.
Author’s response
We are very grateful for your comments.
Acknowledgements
We would like to thank Ricardo de Matos Simoes and Shailesh Tripathi for fruitful discussions about various parts of the paper. For our numerical simulations we used R [61], SynTRen [47], GeNGe [43] and MINET [49] and for the visualization of the networks the igraph package [40].
Parts of this project have been supported by the Department for
Employment and Learning through its“Strengthening the all-Island Research Base”initiative.
Author details
1Computational Biology and Machine Learning Lab, Center for Cancer
Research and Cell Biology, School of Medicine, Dentistry and Biomedical Sciences, Queen’s University Belfast, 97 Lisburn Road, Belfast, BT9 7BL, UK. 2Cambridge Research Institute, Department of Oncology, University of
Cambridge, CB2 0RE, Cambridge, UK.
Authors’contributions
GA and FES designed the method, performed the analysis and interpreted the results. FES conceived and coordinated the study. GA and FES wrote the manuscript. All authors read and approved the final manuscript.
Competing interests
The authors declare that they have no competing interests.
Received: 10 January 2011 Accepted: 22 June 2011 Published: 22 June 2011
References
1. Beadle GW, Tatum EL:Genetic Control of Biochemical Reactions in
Neurospora.Proceedings of the National Academy of Sciences of the United
States of America1941,27(11):499-506.
2. Emmert-Streib F, Dehmer M:Networks for Systems Biology:
Conceptual Connection of Data and Function.IET Systems Biology
2011,5(3):185-207.
3. Kauffman S:Origins of Order: Self-Organization and Selection in Evolution
Oxford University Press; 1993.
4. Kitano H:Foundations of Systems BiologyMIT Press; 2001.
5. Palsson B:Systems BiologyCambridge; New York: Cambridge University Press; 2006.
6. Trewavas A:A Brief History of Systems Biology:“Every object that
biology studies is a system of systems.”Francois Jacob (1974).Plant Cell
2006,18(10):2420-2430.
7. Vidal M:A unifying view of 21st century systems biology.FEBS Letters
2009,583(24):3891-3894.
8. Dudoit S, Shaffer J, Boldrick J:Multiple hypothesis testing in microarray
experiments.Statistical Science2003,18:71-103.
9. Eisen MB, Spellman PT, Brown PO, Botstein D:Cluster analysis and display
of genome-wide expression patterns.PNAS1998,95(25):14863-14868.
10. Emmert-Streib F:Unite and conquer: univariate and multivariate
approaches for finding differentially expressed gene sets.Bioinformatics
2009,25(18):2348-54.
11. Jiang Z, Gentleman R:Extensions to gene set enrichment.Bioinformatics
2007,23(3):306-313.
12. Emmert-Streib F, Dehmer M, (Eds):Analysis of Microarray Data: A Network
Based ApproachWeinheim: Wiley-VCH; 2008.
13. Emmert-Streib F:The chronic fatigue syndrome: a comparative pathway
analysis.J Comput Biol2007,14(7):961-72.
14. Speed T:Statistical Analysis of Gene Expression Microarray DataChapman and Hall/CRC; 2003.
15. Li H, Gui J:Gradient directed regularization for sparse Gaussian concentration graphs, with applications to inference of genetic
networks.Biostatistics2006,7(2):302-317.
16. Markowetz F, Spang R:Inferring cellular networks-a review.BMC
Bioinformatics2007,8:S5.
17. Opgen-Rhein R, Strimmer K:Learning causal networks from systems biology time course data: an effective model selection procedure for the
vector autoregressive process.BMC Bioinformatics2007,8:S3.
18. Pearl J:Causality: Models, Reasoning, and InferenceCambridge; 2000. 19. Shipley B:Cause and Correlation in BiologyCambridge University Press; 2000. 20. Werhli A, Grzegorczyk M, Husmeier D:Comparative evaluation of reverse
engineering gene regulatory networks with relevance networks,
graphical gaussian models and bayesian networks.Bioinformatics2006,
22(20):2523-31.
21. Wille A, Zimmermann P, Vranova E, Furholz A, Laule O, Bleuler S, Hennig L, Prelic A, von Rohr P, Thiele L, Zitzler E, Gruissem W, Buhlmann P:Sparse graphical Gaussian modeling of the isoprenoid gene network in
Arabidopsis thaliana.Genome Biology2004,5(11):R92.
22. Xing B, van der Laan M:A causal inference approach for constructing
transcriptional regulatory networks.Bioinformatics2005,21(21):4007-4013.
23. Butte A, Kohane I:Mutual information relevance networks: Functional
genomic clustering using pairwise entropy measurements.Pacific
Symposioum on Biocomputing2000,5:415-426.
24. Gallager R:Information Theory and Reliable CommunicationWiley; 1968. 25. Liang K, Wang X:Gene regulatory network reconstruction using
conditional mutual information.EURASIP J Bioinform Syst Biol 20082008,
26. Olsen C, Meyer P, Bontempi G:On the Impact of Entropy Estimator in
Transcriptional Regulatory Network Inference.EURASIP Journal on
Bioinformatics and Systems Biology2009,2009:308959.
27. Meyer P, Kontos K, Bontempi G:Information-theoretic inference of large
transcriptional regulatory networks.EUROSIP journal on bioinformatics and
systems biology2007,2007:79879.
28. Watkinson J, Liang K, Wang X, Zheng T, Anastassiou D:Inference of regulatory gene interactions from expression data using three-way
mutual information.Ann N Y Acad Sci2009,1158:302-13.
29. Kraskov A, Stögbauer H, Grassberger P:Estimating mutual information.
Phys Rev E2004,69(6):066138.
30. Margolin A, Nemenman I, Basso K, Wiggins C, Stolovitzky G, Dalla Favera R, Califano A:ARACNE: an algorithm for the reconstruction of gene
regulatory networks in a mammalian cellular context.BMC Bioinformatics
2006,7:S7.
31. Li W:Mutual information functions versus correlation functions.Journal
of Statistical Physics1990,60(5-6):823-837.
32. Steuer R, Kurths J, Daub CO, Weise J, Selbig J:The mutual information:
Detecting and evaluating dependencies between variables.Bioinformatics
2002,18(2):S231-240.
33. Altay G, Emmert-Streib F:Inferring the conservative causal core of gene
regulatory networks.BMC Systems Biology2010,5:132.
34. Butte A, Tamayo P, Slonim D, Golub T, Kohane I:Discovering functional relationships between RNA expression and chemotherapeutic
susceptibility using relevance networks.Proc Natl Acad Sci USA2000,
97(22):12182-6.
35. Faith JJ, Hayete B, Thaden JT, Mogno I, Wierzbowski J, Cottarel G, Kasif S, Collins JJ, Gardner TS:Large-Scale Mapping and Validation of Escherichia coli Transcriptional Regulation from a Compendium of Expression Pro
les.PLoS Biol2007,5.
36. Emmert-Streib F, Altay G:Local network-based measures to assess the
inferability of different regulatory networks.IET Systems Biology2010,
4(4):277-88.
37. Altay G, Emmert-Streib F:Revealing differences in gene network inference algorithms on the network level by ensemble methods.
Bioinformatics2010,26(14):1738-1744.
38. Barabasi AL, Albert R:Emergence of scaling in random networks.Science
1999,206:509-512.
39. Sole RV, Valverde S:Spontaneous emergence of modularity in cellular
networks.Journal of The Royal Society Interface2008,5(18):129-133.
40. Csardi G, Nepusz T:igraph-package2008.
41. Pearl J:Probabilistic Reasoning in Intelligent SystemsMorgan-Kaufmann; 1988. 42. Erdös P, Rényi A:On random graphs. I.Publicationes Mathematicae1959,
6:290-297.
43. Hache H, Wierling C, Lehrach H, Herwig R:GeNGe: systematic generation
of gene regulatory networks.Systems Biology2009,25:1205-1207.
44. Shen-Orr S, Milo R, Mangan S, Alon U:Network motifs in the
transcriptional regulatory network of Escherichia coli.Nat Genet2002,
31:64-68.
45. Ma HW, Kumar B, Ditges U, Gunzer F, Buer J, Zeng AP:An extended transcriptional regulatory network of Escherichia coli and analysis of its
hierarchical structure and network motifs.Nucleic Acids Res2004,
32:6643-6649.
46. Guelzim N, Bottani S, Bourgine P, Kepes F:Topological and causal
structure of the yeast transcriptional regulatory network.Nature Genetics
2002.
47. Van den Bulcke T, Van Leemput K, Naudts B, van Remortel P, Ma H, Verschoren A, De Moor B, Marchal K:SynTReN: a generator of synthetic gene expression data for design and analysis of structure learning
algorithms.BMC Bioinformatics2006,7:43.
48. Rocke DM, Durbin B:A Model for Measurement Error for Gene
Expression Arrays.Journal of Computational Biology2001,8(6):557-569.
49. Meyer P, Lafitte F, Bontempi G:minet: A R/Bioconductor Package for
Inferring Large Transcriptional Networks Using Mutual Information.BMC
Bioinformatics2008,9:461.
50. Sheskin DJ:Handbook of Parametric and Nonparametric Statistical
Procedures.3 edition. RC Press, Boca Raton, FL; 2004.
51. Kauffman S, Peterson C, Samuelsson B, Troein C:Genetic networks with
canalyzing Boolean rules are always stable.Proceedings of the National
Academy of Sciences of the United States of America2004,
101(49):17102-17107.
52. Barabasi AL, Oltvai ZN:Network Biology: Understanding the Cell’s
Functional Organization.Nature Reviews2004,5:101-113.
53. Ideker T, Sharan R:Protein networks in disease.Genome Research2008,
18(4):644-652.
54. Milo R, Shen-Orr S, Itzkovitz S, Kashtan N, Chklovskii D, Alon U:Network
motifs: simple building blocks of complex networks.Science2002,
298(5594):824-7.
55. Newman M:Networks: An IntroductionOxford University Press; 2010. 56. Dudoit S, van der Laan M:Multiple Testing Procedures with Applications to
GenomicsNew York; London: Springer; 2007.
57. Efron B:Large-Scale InferenceCambridge University Press; 2010. 58. Stolovitzky G, Califano A, (Eds):Reverse Engineering Biological Networks:
Opportunities and Challenges in Computational Methods for Pathway
InferenceWiley-Blackwell; 2007.
59. Stolovitzky G, Kahlem P, Califano A, (Eds):The Challenges of Systems Biology:
Community Efforts to Harness Biological ComplexityWiley-Blackwell; 2009.
60. Emmert-Streib F, Dehmer M, (Eds):Medical Biostatistics for Complex Diseases
Weinheim: Wiley-Blackwell; 2010.
61. R Development Core Team:R: A Language and Environment for Statistical
ComputingR Foundation for Statistical Computing, Vienna, Austria; 2008,
[ISBN 3-900051-07-0].
doi:10.1186/1745-6150-6-31
Cite this article as:Altay and Emmert-Streib:Structural influence of gene networks on their inference: analysis of C3NET.Biology Direct20116:31.
Submit your next manuscript to BioMed Central and take full advantage of:
• Convenient online submission
• Thorough peer review
• No space constraints or color figure charges
• Immediate publication on acceptance
• Inclusion in PubMed, CAS, Scopus and Google Scholar
• Research which is freely available for redistribution