R E S E A R C H
Open Access
Identification of five hub genes as
monitoring biomarkers for breast cancer
metastasis in silico
Yun Cai
1,2†, Jie Mei
1†, Zhuang Xiao
1†, Bujie Xu
1, Xiaozheng Jiang
1, Yongjie Zhang
3,4*and Yichao Zhu
1,5*Abstract
Background:Breast cancer is one of the most common endocrine cancers among females worldwide. Distant
metastasis of breast cancer is causing an increasing number of breast cancer-related deaths. However, the potential mechanisms of metastasis and candidate biomarkers remain to be further explored.
Results:The gene expression profiles of GSE102484 were downloaded from the Gene Expression Omnibus (GEO)
database. Weighted gene co-expression network analysis (WGCNA) was used to screen for the most potent gene modules associated with the metastatic risk of breast cancer, and a total of 12 modules were identified based on the analysis. In the most significant module (R2= 0.68), 21 network hub genes (MM > 0.90) were retained for further analyses. Next, protein-protein interaction (PPI) networks were used to further explore the biomarkers with the most interactions in gene modules. According to the PPI networks, five hub genes (TPX2, KIF2C, CDCA8, BUB1B, andCCNA2) were identified as key genes associated with breast cancer progression. Furthermore, the prognostic value and differential expression of these genes were validated based on data from The Cancer Genome Atlas (TCGA) and Kaplan-Meier (KM) Plotter. Receiver operating characteristic (ROC) curve analysis revealed that the mRNA expression levels of these five hub genes showed excellent diagnostic value for breast cancer and adjacent tissues. Moreover, these five hub genes were significantly associated with worse distant metastasis-free survival (DMFS) in the patient cohort based on KM Plotter.
Conclusion:Five hub genes (TPX2,KIF2C,CDCA8,BUB1B, andCCNA2) associated with the risk of distant metastasis were extracted for further research, which might be used as biomarkers to predict distant metastasis of breast cancer.
Keywords:Breast cancer, WGCNA, Bioinformatic analysis, Prognosis, Metastasis
Background
Breast cancer is one of the most common tumours threatening women’s health worldwide, and its inci-dence has shown a rising trend in the past decades. According to the prediction provided by the Ameri-can Cancer Society (ACS), there will be more than 271,000 new incidences in the United States (US) in 2019 [1]. Current therapeutic approaches for breast cancer mainly focus on comprehensive treatment, in-cluding surgery, chemotherapy, radiotherapy, hormone
therapy, and targeted therapy [2, 3]. Breast cancer in situ is usually not fatal to patients; however, advanced breast cancer with lymph nodes and/or distant metas-tasis tends to cause life-threatening outcomes for pa-tients [4]. Although the aetiology and signatures of breast cancer have been preliminarily explored, there is no defined means of predicting the metastasis and recurrence of breast cancer in clinical practice [5], and further exploration of the potential mechanisms of the metastasis and biomarkers to monitor recur-rence of breast cancer is urgently needed.
With the continuous development of biological re-search technologies, especially sequencing technologies and bioinformatic algorithms, massive amounts of gen-omic information are accumulating exponentially [6, 7]. Along with the successful implementation of numerous large-scale sequencing projects led by governments,
© The Author(s). 2019Open AccessThis article is distributed under the terms of the Creative Commons Attribution 4.0 International License (http://creativecommons.org/licenses/by/4.0/), which permits unrestricted use, distribution, and reproduction in any medium, provided you give appropriate credit to the original author(s) and the source, provide a link to the Creative Commons license, and indicate if changes were made. The Creative Commons Public Domain Dedication waiver (http://creativecommons.org/publicdomain/zero/1.0/) applies to the data made available in this article, unless otherwise stated.
* Correspondence:zhangyongjie@njmu.edu.cn;zhuyichao@njmu.edu.cn †Yun Cai, Jie Mei and Zhuang Xiao contributed equally to this work and
should be considered co-first authors. 3
Department of Human Anatomy, Nanjing Medical University, Nanjing 211166, China
1Department of Physiology, Nanjing Medical University, Nanjing 211166, China
Full list of author information is available at the end of the article
biomedical research has been entering the era of “big data”[8–10]. Over the past few years, bioinformatics re-searchers have developed a series of analysis strategies and data mining algorithms for increasing the amount of transcriptomic data [11–13].
Weighted gene co-expression network analysis
(WGCNA) is a systematic biological strategy for evaluating gene association patterns among different samples [11]. It can be applied to reveal highly cor-relative gene sets and explore potential biomarker genes or therapeutic targets according to the internal connectivity of gene clusters and the associations be-tween gene clusters and phenotypes. By constructing a gene co-expression network and identifying related gene clusters, the correlation between gene modules and phenotypes can be calculated based on pheno-typic information, and the most relevant gene mod-ules can be found. Numerous potential biomarkers have been identified to date based on WGCNA for sequencing data [14–16]. For example, Tang et al. identified five genes as prognostic biomarkers for
breast cancer, and Qiu et al. revealed several genes associated with the development of breast cancer for further basic and clinical research [14, 17]. However, there is currently no defined means of predicting the metastasis risk of breast cancer in clinical practice. Thus, we aim to further explore potential metastatic predictors via WGCNA.
GSE102484, a microarray containing 683 breast can-cer samples, was submitted by Cheng et al. from Taiwan in 2017 [18]. Cheng et al. validated the prog-nostic value of an 18-gene classifier that predicted locoregional recurrence and metastasis risk in patients after mastectomy based on the sequencing data and clinical information of GSE102484 [18, 19]. Given the complete follow-up information and the defined risk scoring system of recurrence and metastasis for this microarray data, we re-evaluated these data in this study and identified five candidate biomarkers associ-ated with the risk of metastasis through WGCNA and protein-protein interaction (PPI) networks. We further validated the differential expression and prognostic
Fig. 2(See legend on next page.)
value of these five genes with another open database. Overall, we identified five genes (TPX2, KIF2C,
CDCA8, BUB1B, and CCNA2) associated with distant
metastasis, indicating these genes as potential bio-markers for assessing the risk of breast cancer recur-rence and distant metastasis.
Materials and methods Acquisition of microarray data
The workflow of our research is illustrated in Fig.1. The array profiles of GSE102484 (https://www.ncbi.nlm.nih. gov/geo/query/acc.cgi?acc=GSE102484) contributed by Cheng et al. were downloaded from the Gene Expres-sion Omnibus (GEO) database. GSE102484 was an array profile based on the GPL570 platform (Affymetrix Human Genome U133 Plus 2.0 Array) containing 683 breast cancer samples from Taiwan. The robust multi-array average (RMA) algorithm in the affy package within Bioconductor (http://www.bioconductor.org) in R was employed to preprocess the array profiles. After background correction, quantile normalization and probe summarization, the data set with 21,653 genes was further processed. The top 25% most variant genes (MVGs) according to analysis of variance (5413 genes) were selected for further WGCNA.
Co-expression network construction
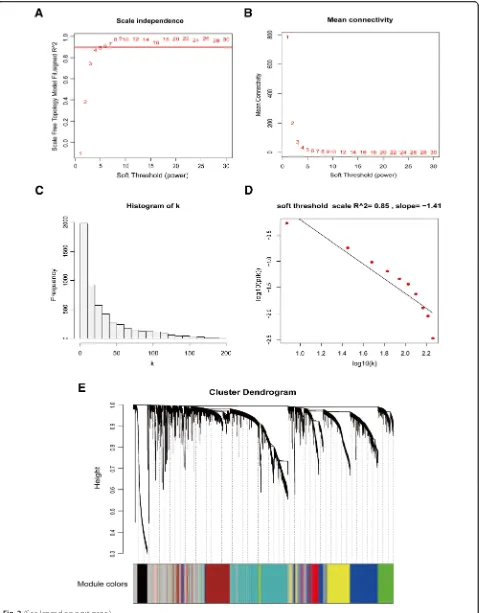
After preprocessing the GSE102484 microarray data, the expression profile of these 5413 genes was employed to construct to a gene co-expression net-work using the WGCNA package in R [11]. The idea of a soft threshold is to continually elementize the el-ements in the Adjacency Matrix through a weight function. Because the choice of the soft threshold, β, is bound to affect the result of module identification and the relative network of the random average of each node, there is a scale-free network in which a few nodes exhibit a significantly higher degree than the general point, which is a more stable choice, so we need to choose a soft threshold, β, is our gene distribution in line with the scale-free network. To create a network with a nearly scale-free topology, we installed the soft threshold power of β= 4 (scale free R2= 0.88). Adjacency matrices were calculated and
transformed into the topological overlap matrix
(TOM). The dynamic tree cut algorithm was applied to detect gene modules. Gene significance (GS) was defined as the correlation coefficient between gene expression and module traits. The module eigengene was calculated as a summary profile for each module. Module significance was defined as the correlation coefficient between a module’s eigengene and traits. Module membership (MM) was defined by the correl-ation coefficient of the module eigengene and gene expression profile. Genes with MM values above 0.90 were considered to be the modules’ representative genes with potential critical functions.
Identification of hub genes based on a PPI network After WGCNA of the microarray data, we screened 21 hub genes in the yellow module, which were sig-nificantly associated with clinical stage, T stage, and risk of metastasis. We constructed the protein– pro-tein interaction (PPI) network using the STRING database (https://string-db.org/) to load all the hub genes [20]. For all other parameters, the default set-tings were used. *.tsv format network files were loaded into the plug-in cytoHubba based on Cytos-cape software version 3.5.1 (Institute for Systems Biol-ogy, Seattle, WA, USA). We defined the top 5 genes with the highest prediction scores calculated by the Stress algorithm as hub genes. We defined these genes with a minimum required interaction score greater than 0.90 as hub genes according to the PPI network, and the network diagram of all PPI hub genes was visualized with Cytoscape (version 3.5.1, Seattle, WA) [12].
Further authentication of key genes using other open data
To verify the significant values of five hub genes, the clinical files and RNA-seq data for breast cancer were downloaded from The Cancer Genome Atlas (TCGA,
https://cancergenome.nih.gov/) database. The mRNA sequencing data were normalized using the edge R package in R software, and we used Student’s t-test and the receiver operating characteristic (ROC) curve to examine the differential mRNA levels of these five genes in breast cancer and adjacent tissues. The prog-nostic impacts of these five genes in breast cancer
(See figure on previous page.)
were analysed using the Kaplan-Meier Plotter (http:// kmplot.com/analysis/), an online database containing gene expression profiles and survival data for breast
cancer patients [21]. According to the mRNA
expression of the genes, the cases in the database
were ranked from high expression to low expression, which divided them into two groups; the top 50% were divided into the high expression group, and the bottom 50% belonged to the low expression group.
All cohorts were compared with Kaplan-Meier
Fig. 3Identification of relevant modules of breast cancer clinical traits and construction of the PPI network. (a) Visualization of the gene network with a heatmap. The heatmap depicts the TOM among all genes in the analysis. A light colour represents low overlap, and progressively darker reds indicate higher overlap. Blocks of darker colours along the diagonal are the modules. The gene dendrogram and module assignment are also shown along the left and upper sides. (b) The eigengene dendrogram and heatmap identify groups of correlated eigengenes termed meta-modules. As a result, the dendrogram shows that yellow, pink and green-yellow modules are highly related to breast cancer clinical stage. (c) Heatmap of the correlation between module eigengenes and clinical traits of breast cancer. The yellow gene module was shown to exhibit the strongest correlation with the clinical stage (clinical stage, T stage, N stage, metastatic risk). (d) PPI network of genes in the yellow module for clinical stage. The nodes other than the pale blue nodes represent the hub genes with the highest prediction scores calculated with the stress algorithm
survival plots. The hazard ratio (HR), 95% confidence interval (95%CI), and log rank P value were calculated and displayed online.
Statistical analysis
All statistical analyses were performed using SPSS 25.0 software and R 3.5.1 software. Most statistical compari-sons among different groups were analysed with Student’s
t-test and one-way analysis of variance (ANOVA). The ROC) curve was applied to examine the diagnostic value of differential hub gene mRNA expression for distinguish-ing tumour tissues from normal tissues. Kaplan-Meier survival plots were generated with survival curves com-pared by the log-rank test. For all analyses, differences were considered statistically significant if the P values were less than 0.05.
Results
Weighted co-expression network construction and key module identification
The R package for WGCNA was applied to construct a co-expression network, and 2370 MVGs with similar ex-pression patterns were submitted to modules by cluster analysis. In our research, we selected the power of β= 4 (scale free R2= 0.88) as the soft threshold to ensure a scale-free network (Fig.2A-D). Then, we extracted twelve modules for further analysis (Fig.2E). We next visualized the gene network with a heatmap and meta-modules (Fig.
3A, B). The yellow module, which was most significantly associated with clinical stage, T stage, and metastasis risk, was shown to be of notable value in the evaluation of breast cancer progression. Clinical stage (R = 0.21; P= 2e
−8), T stage (R = 0.20;P= 1e−7) and metastasis risk (R = 0.68; P = 1e−94) were all significantly correlated with the yellow module according to module-feature relationship analysis (Fig. 3C). Subsequently, we selected 21 genes in the yellow module with MM values above 0.90 for further analysis, which were considered representative genes exhi-biting potential critical functions.
Identification of hub genes of modules and filtration via the PPI network
In this study, we extracted 21 hub genes with a high cor-relation with the yellow module (Fig. 3C). Subsequently,
we constructed a PPI network using Cytoscape, and we screened these 21 PPI hub genes exhibiting intimate in-teractions with other genes (Fig.3D). Based on the stress algorithm, we retained the top five genes (TPX2,KIF2C,
CDCA8,BUB1B, andCCNA2) showing the closest
con-nections with other genes for validation and subsequent investigation (Table1).
Validation of hub genes based on TCGA-BRCA data The training dataset (TCGA-BRCA) was applied to validate the correlations between the five hub genes and clinical stages. We compared the expression of each candidate hub gene in breast cancer samples at different clinical stages and found that the five candi-date hub genes were closely related to clinical stages (Fig. 4A-4E). In addition, Wang et al. verified a list of cancer/testis genes showing high specificity of testis-specific expression, which included these five hub genes [22]. We speculate that these five genes were upregulated in tumour tissues. We used the TCGA-BRCA dataset to validate our hypothesis, and the re-sults showed that the mRNA level of each candidate hub gene was significantly upregulated in breast can-cer tissues compared with paired adjacent breast tis-sues (Fig. 5A-5E). In addition, ROC analysis revealed that the mRNA levels of these five genes showed ex-cellent diagnostic value for breast cancer and adjacent tissues (Fig. 6A-6E).
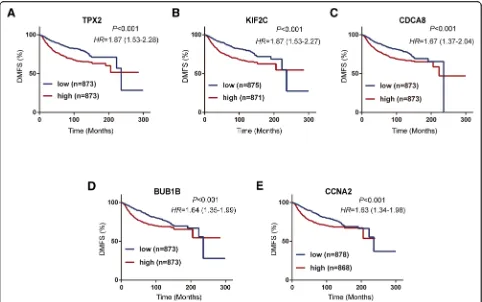
Prognosis value of key genes for DMFS according to KM plotter
To validate the association between the expression levels of these five hub genes and metastasis risk in breast can-cer, we used survival information from the KM Plotter database to perform survival analysis for the five hub genes. As shown in Fig.7, high mRNA expression levels of TPX2 (HR = 1.87; 95%CI: 1.53–2.28;P< 0.001), KIF2C (HR = 1.87; 95%CI: 1.53–2.27;P< 0.001), CDCA8 (HR = 1.67; 95%CI: 1.37–2.04; P< 0.001), BUB1B (HR = 1.64; 95%CI: 1.35–1.99; P< 0.001), and CCNA2 (HR = 1.63; 95%CI: 1.34–1.98; P< 0.001) were significantly associ-ated with worse distant metastasis-free survival (DMFS). Overall, these findings validated the prognostic value and the relationships between the five genes and the metastasis of breast cancer.
Table 1Five hub genes identified by combined bioinformatic strategies in breast cancer
Gene ID Ensembl ID Gene Description
TPX2 ENSG00000088325.15 Targeting protein forXenopuskinesin-like protein 2
KIF2C ENSG00000142945.12 Kinesin family member 2C
CDCA8 ENSG00000134690.10 Cell division cycle associated 8
BUB1B ENSG00000156970.12 BUB1 mitotic checkpoint serine/threonine kinase B
Fig. 4Validation of the differential expression of five hub genes in various clinical stages. (a) The correlation of TPX2 expression with clinical stage. (b) The correlation of KIF2C expression with clinical stage. (c) The correlation of CDCA8 expression with clinical stage. (d) The correlation of BUB1B expression with clinical stage. (e) The correlation of CCNA2 expression with clinical stage. ANOVA was used to assess the statistical significance of the differences
Discussion
Breast cancer is one of the most common cancers that poses a threat to women’s life worldwide. Ad-vanced breast cancer can spread to the whole body through blood vessels and lymphatics and directly cause cancer-related death. Although advanced ther-apies have achieved promising performance in con-trolling breast cancer with no metastasis, there are rarely available strategies to control advanced breast cancer, and even precise methods that can prevent the recurrence and metastasis of breast cancer are quite scarce [23, 24]. Therefore, it is urgent to ex-plore potential mechanisms of metastasis and candi-date biomarkers for monitoring the metastasis of breast cancer. Although Cheng et al. developed an 18-gene classifier for predicting local/regional recur-rence after mastectomy and estimating distant metas-tasis risk after mastectomy, the complicated scoring system is difficult to widely replicate and apply clinic-ally. Thus, in this study, we re-evaluated microarray data from GSE102484 through WGCNA and PPI ana-lysis and finally identified five genes that exhibited the highest correlation with metastasis risk.
Co-expression analysis is an efficient strategy for gene/disease prediction analysis in large-scale datasets.
In the current study, we employed WGCNA to con-struct a gene co-expression network, to measure the relationships between genes and modules and to in-vestigate the relationships between modules and clin-ical traits. In the analysis of the top 25% most variant genes (5413 genes), the yellow module was found to show the closest correlation with the risk of metasta-sis as well as tumour stage, and 21 genes with high connectivity were screened from the module. We next constructed a PPI network and finally identified five
(TPX2, KIF2C, CDCA8, BUB1B, and CCNA2) PPI
hub genes that significantly interacted with other genes.
Targeting protein for Xenopus kinesin-like protein 2 (TPX2), which is considered to be a microtubule-associated protein, can participate in the activation of protein kinase activity, regulation of mitotic spindle tissue, apoptotic processes, mitosis, cell division and cell proliferation [25, 26]. Previous studies have shown that TPX2 is overexpressed in tumour tissues and promotes the tumorigenesis of multiple cancers [27–29]. In breast cancer cells, TPX2 promotes cancer cell invasion and migration via regulating MMP2 and MMP9 expression [30]. Additionally, silencing TPX2 can suppress cell proliferation and promote apoptosis
by inhibiting PI3K/Akt signalling and activating P53 signalling [31].
Kinesin family member 2C (KIF2C) has been reported to be involved in mitosis and the cell cycle [32]. The encoded protein functions as a microtubule-dependent molecular motor that can polymerize microtubules at the plus end, thus promoting mitotic chromosome segregation. In addition, KIF2C is essential for inducing the deformation of microtubule structures and impairing cell motility [33]. In lung adenocarcinoma, KIF2C is highly expressed and is associated with the recurrence and stage of lung adenocar-cinoma [34,35]. In addition, the expression level of KIF2C mRNA has been identified as a potential independent biomarker for assessing glioma patient prognosis [36]. Ac-cordingly, KIF2C has been reported to be a promising therapeutic target in invasive ductal carcinoma of breast cancer based on PPI network analysis [37].
Cell division cycle-associated 8 (CDCA8) is a gene encoding a component of the chromosomal passenger complex, which functions as a crucial regulator of mitosis and cell division. This protein is required for chromatin-induced microtubule stabilization and spindle formation. Overexpression of CDCA8 in tumour tissues is observed in multiple cancers, including melanoma,
bladder cancer, and breast cancer [38–40]. In addition, Dai et al. revealed that the activation of CDCA8 was up-regulated by the transcription factor NF-Y in multiple cancer cells [41]. These results indicate that CDCA8 might be a novel target for reducing cell division and proliferation in multiple cancers.
BUB1 mitotic checkpoint serine/threonine kinase B (BUB1B) encodes a kinase participating in the spindle checkpoint; this protein plays a critical role in the inhib-ition of the anaphase-promoting complex/cyclosome (APC/C) and functions in delaying the onset of anaphase and ensuring proper chromosome segregation [42]. The oncogene role of BUB1B has been observed in cancers such as prostate cancer, glioblastoma and gastric cancer [43–45]. BUB1B is overexpressed in breast cancer, and the level of BUB1B mRNA is significantly correlated with intrachromosomal instability [46]. In addition, BUB1B is preferentially expressed in high-grade breast cancer, and its expression level exhibits significant asso-ciations with long-term survival [47].
Cyclin A2 (CCNA2), a protein encoded by the corre-sponding gene, belongs to the highly conserved cyclin family and functions as a regulator of CDK kinases. This protein binds and activates CDC2 or CDK2 kinases and.
Fig. 6Diagnostic value of the five hub genes in identifying normal and breast cancer tissues. The ROC curve revealed that the mRNA levels of these five genes exhibited excellent diagnostic efficiency for breast cancer and adjacent tissues. (a) TPX2, (b) KIF2C, (c) CDCA8, (d) BUB1B, (E) CCNA2
Thus. promotes the cell cycle G1/S and G2/M transi-tions [48]. In breast cancer, NEK5-dependent CCNA2 overexpression promotes the proliferation of tumour cells [49]. Moreover, CCNA2 had significant predictive value for the prognosis of ER+ breast cancer patients as well as tamoxifen resistance [50].
In this research, we further assessed the differential ex-pression of five hub genes (TPX2, KIF2C, CDCA8,
BUB1B, andCCNA2) in various clinical stages, and the
results showed that their expression was significantly in-creased in advanced tumour stages. In addition, the ex-pression levels of the five genes were significantly upregulated in tumour tissues compared with normal tissues. ROC analysis revealed that the mRNA levels of the five genes showed excellent diagnostic value for breast cancer and adjacent tissues. To further assess the association between the expression of these hub genes and the risk of breast cancer metastasis, we employed KM Plotter to evaluate the prognostic value of these genes in DMFS. The primary purpose of KM Plotter is to evaluate potential biomarkers in a meta-analysis-based manner, and many prognostic biomarkers have been identified based on this platform [51–53]. Five hub genes, including TPX2, KIF2C, CDCA8, BUB1B, and
CCNA2, were validated to be notably associated with the
shorter DMFS of breast cancer in the patient cohort based on KM Plotter.
Conclusion
Overall, our results provide valuable indications for biomarker research on breast cancer metastasis. We predicted key metastasis-associated genes based on WGCNA and PPI analysis and validated the primary findings using data from TCGA and KM Plotter. Fi-nally, five hub genes (TPX2, KIF2C, CDCA8, BUB1B,
and CCNA2) were identified for further research,
which might be used as promising biomarkers to evaluate the distant metastasis of breast cancer.
Abbreviations
ANOVA:One-way analysis of variance; BUB1B: BUB1 mitotic checkpoint serine/threonine kinase B; CCNA2: Cyclin A2; CDCA8: Cell division cycle associated 8; DMFS: Distant-metastasis-free survival; GEO: Gene Expression Omnibus; GS: Gene significance; KIF2C: Kinesin family member 2C; KM Plotter: Kaplan-Meier Plotter.; MM: Module membership; MVGs: Most variant genes; PPI: Protein-protein interaction; ROC: Receiver operating characteristic; TCGA: The Cancer Genome Atlas; TOM: Topological overlap matrix; TPX2: Targeting protein for Xenopus kinesin-like protein 2; WGCNA: Weighted gene co-expression network analysis
Acknowledgements
We thank Dr. Qianghu Wang and Dr. Xue Lin (Nanjing Medical University) for giving us rational advice during the study.
Availability of data and material
All data are included in the article.
Authors’contributions
Y Zhang and Y Zhu conceived the study and participated in the study design, performance, coordination and manuscript writing. YC, JM, ZX, BX, and XJ carried out the assays and analysis. JM, Y Zhang and Y Zhu revised the manuscript. All authors reviewed and approved the final manuscript.
Funding
Not applicable.
Ethics approval and consent to participate
Not applicable.
Consent for publication
Not applicable.
Competing interests
The authors declare no conflict of interest.
Author details
1Department of Physiology, Nanjing Medical University, Nanjing 211166, China.2Department of Bioinformatics, Nanjing Medical University, Nanjing 211166, China.3Department of Human Anatomy, Nanjing Medical University, Nanjing 211166, China.4Key Laboratory for Aging & Diseases of Nanjing Medical University, Nanjing Medical University, Nanjing 211166, China.5State Key Laboratory of Reproductive Medicine, Nanjing Medical University, Nanjing 211166, China.
Received: 7 April 2019 Accepted: 12 June 2019
References
1. Siegel RL, Miller KD, Jemal A. Cancer statistics, 2019. CA Cancer J Clin. 2019; 69:7–34.
2. Dean A. Primary breast cancer: risk factors, diagnosis and management. Nurs Stand. 2008;22:47–55 quiz 58, 60.
3. Peart O. Breast intervention and breast cancer treatment options. Radiol Technol. 2015;86:535M–58M quiz 559-62.
4. Shen T, Gao C, Zhang K, Siegal GP, Wei S. Prognostic outcomes in advanced breast cancer: the metastasis-free interval is important. Hum Pathol. 2017;70: 70–6.
5. Li SC, Stucky A, Chen X, Kabeer MH, Loudon WG, Plant AS, Torno L, Nangia CS, Cai J, Zhang G, Zhong JF. Single-cell transcriptomes reveal the mechanism for a breast cancer prognostic gene panel. Oncotarget. 2018;9: 33290–301.
6. Orton RJ, Gu Q, Hughes J, Maabar M, Modha S, Vattipally SB, Wilkie GS, Davison AJ. Bioinformatics tools for analysing viral genomic data. Rev Sci Tech. 2016;35:271–85.
7. Chen J, Coppola G. Bioinformatics and genomic databases. Handb Clin Neurol. 2018;147:75–92.
8. Heng HH. Cancer genome sequencing: the challenges ahead. Bioessays. 2007;29:783–94.
9. Hanauer DA, Rhodes DR, Sinha-Kumar C, Chinnaiyan AM. Bioinformatics approaches in the study of cancer. Curr Mol Med. 2007;7:133–41. 10. Li SC, Tachiki LM, Kabeer MH, Dethlefs BA, Anthony MJ, Loudon WG. Cancer
genomic research at the crossroads: realizing the changing genetic landscape as intratumoral spatial and temporal heterogeneity becomes a confounding factor. Cancer Cell Int. 2014;14:115.
11. Langfelder P, Horvath S. WGCNA: an R package for weighted correlation network analysis. BMC Bioinformatics. 2008;9:559.
12. Chin CH, Chen SH, Wu HH, Ho CW, Ko MT, Lin CY. cytoHubba: identifying hub objects and sub-networks from complex interactome. BMC Syst Biol. 2014;8 Suppl 4:S11.
13. Martin-Antoniano I, Alonso L, Madrid M, Lopez de Maturana E, Malats N. DoriTool: a bioinformatics integrative tool for post-association functional annotation. Public Health Genomics. 2017;20:126–35.
14. Tang J, Kong D, Cui Q, Wang K, Zhang D, Gong Y, Wu G. Prognostic genes of breast Cancer identified by gene co-expression network analysis. Front Oncol. 2018;8:374.
15. Liu M, Qiu YL, Jin T, Zhou Y, Mao ZY, Zhang YJ. Meta-analysis of microarray datasets identify several chromosome segregation-related cancer/testis genes potentially contributing to anaplastic thyroid carcinoma. PeerJ. 2018;6:e5822. 16. Guo X, Xiao H, Guo S, Dong L, Chen J. Identification of breast cancer
mechanism based on weighted gene coexpression network analysis. Cancer Gene Ther. 2017;24:333–41.
17. Qiu J, Du Z, Wang Y, Zhou Y, Zhang Y, Xie Y, Lv Q. Weighted gene co-expression network analysis reveals modules and hub genes associated with the development of breast cancer. Medicine (Baltimore). 2019;98: e14345.
18. Cheng SH, Huang TT, Cheng YH, Tan TBK, Horng CF, Wang YA, Brian NS, Shih LS, Yu BL. Validation of the 18-gene classifier as a prognostic biomarker of distant metastasis in breast cancer. PLoS One. 2017;12:e0184372. 19. Cheng SH, Horng CF, West M, Huang E, Pittman J, Tsou MH, Dressman H,
Chen CM, Tsai SY, Jian JJ, Liu MC, Nevins JR, Huang AT. Genomic prediction of locoregional recurrence after mastectomy in breast cancer. J Clin Oncol. 2006;24:4594–602.
20. Szklarczyk D, Franceschini A, Wyder S, Forslund K, Heller D, Huerta-Cepas J, Simonovic M, Roth A, Santos A, Tsafou KP, Kuhn M, Bork P, Jensen LJ, von Mering C. STRING v10: protein-protein interaction networks, integrated over the tree of life. Nucleic Acids Res. 2015;43:D447–52.
21. Lanczky A, Nagy A, Bottai G, Munkacsy G, Szabo A, Santarpia L, Gyorffy B. miRpower: a web-tool to validate survival-associated miRNAs utilizing expression data from 2178 breast cancer patients. Breast Cancer Res Treat. 2016;160:439–46. 22. Wang C, Gu Y, Zhang K, Xie K, Zhu M, Dai N, Jiang Y, Guo X, Liu M, Dai J,
Wu L, Jin G, Ma H, Jiang T, Yin R, Xia Y, Liu L, Wang S, Shen B, Huo R, Wang Q, Xu L, Yang L, Huang X, Shen H, Sha J, Hu Z. Systematic identification of genes with a cancer-testis expression pattern in 19 cancer types. Nat Commun. 2016;7:10499.
23. Weigelt B, Peterse JL, van‘t Veer LJ. Breast cancer metastasis: markers and models. Nat Rev Cancer. 2005;5:591–602.
24. McGuire A, Brown JA, Kerin MJ. Metastatic breast cancer: the potential of miRNA for diagnosis and treatment monitoring. Cancer Metastasis Rev. 2015;34:145–55.
25. Wieczorek M, Bechstedt S, Chaaban S, Brouhard GJ. Microtubule-associated proteins control the kinetics of microtubule nucleation. Nat Cell Biol. 2015; 17:907–16.
26. Janecek M, Rossmann M, Sharma P, Emery A, Huggins DJ, Stockwell SR, Stokes JE, Tan YS, Almeida EG, Hardwick B, Narvaez AJ, Hyvonen M, Spring DR, McKenzie GJ, Venkitaraman AR. Allosteric modulation of AURKA kinase activity by a small-molecule inhibitor of its protein-protein interaction with TPX2. Sci Rep. 2016;6:28528.
27. Tomii C, Inokuchi M, Takagi Y, Ishikawa T, Otsuki S, Uetake H, Kojima K, Kawano T. TPX2 expression is associated with poor survival in gastric cancer. World J Surg Oncol. 2017;15:14.
28. Glaser ZA, Love HD, Guo S, Gellert L, Chang SS, Herrell SD, Barocas DA, Penson DF, Cookson MS, Clark PE. TPX2 as a prognostic indicator and potential therapeutic target in clear cell renal cell carcinoma. Urol Oncol. 2017;35:286–93. 29. Pan HW, Su HH, Hsu CW, Huang GJ, Wu TT. Targeted TPX2 increases
chromosome missegregation and suppresses tumor cell growth in human prostate cancer. Onco Targets Ther. 2017;10:3531–43.
30. Yang Y, Li DP, Shen N, Yu XC, Li JB, Song Q, Zhang JH. TPX2 promotes migration and invasion of human breast cancer cells. Asian Pac J Trop Med. 2015;8:1064–70.
31. Chen M, Zhang H, Zhang G, Zhong A, Ma Q, Kai J, Tong Y, Xie S, Wang Y, Zheng H, Guo L, Lu R. Targeting TPX2 suppresses proliferation and promotes apoptosis via repression of the PI3k/AKT/P21 signaling pathway and activation of p53 pathway in breast cancer. Biochem Biophys Res Commun. 2018;507:74–82.
32. Manning AL, Ganem NJ, Bakhoum SF, Wagenbach M, Wordeman L, Compton DA. The kinesin-13 proteins Kif2a, Kif2b, and Kif2c/MCAK have distinct roles during mitosis in human cells. Mol Biol Cell. 2007;18:2970–9. 33. Jung YD, Cho JH, Park S, Kang M, Park SJ, Choi DH, Jeong M, Park KC, Yeom
YI, Lee DC. Lactate activates the E2F pathway to promote cell motility by up-regulating microtubule modulating genes. Cancers (Basel). 2019:11.
34. Bai Y, Xiong L, Zhu M, Yang Z, Tang H, Zhao J. Co-expression network analysis identified KIF2C in association with progression and prognosis in lung adenocarcinoma. Cancer Biomark. 2019.
35. Bai Y, Xiong L, Zhu M, Yang Z, Zhao J, Tang H. Co-expression network analysis identified KIF2C in association with progression and prognosis in lung adenocarcinoma. Cancer Biomark. 2019;24:371–82.
36. Bie L, Zhao G, Wang YP, Zhang B. Kinesin family member 2C (KIF2C/MCAK) is a novel marker for prognosis in human gliomas. Clin Neurol Neurosurg. 2012;114:356–60.
37. Li C, Luo L, Wei S, Wang X. Identification of the potential crucial genes in invasive ductal carcinoma using bioinformatics analysis. Oncotarget. 2018;9: 6800–13.
38. Phan NN, Wang CY, Li KL, Chen CF, Chiao CC, Yu HG, Huang PL, Lin YC. Distinct expression of CDCA3, CDCA5, and CDCA8 leads to shorter relapse free survival in breast cancer patient. Oncotarget. 2018;9:6977–92. 39. Bi Y, Chen S, Jiang J, Yao J, Wang G, Zhou Q, Li S. CDCA8 expression and its
clinical relevance in patients with bladder cancer. Medicine (Baltimore). 2018;97:e11899.
40. Ci C, Tang B, Lyu D, Liu W, Qiang D, Ji X, Qiu X, Chen L, Ding W. Overexpression of CDCA8 promotes the malignant progression of cutaneous melanoma and leads to poor prognosis. Int J Mol Med. 2019;43: 404–12.
41. Dai C, Miao CX, Xu XM, Liu LJ, Gu YF, Zhou D, Chen LS, Lin G, Lu GX. Transcriptional activation of human CDCA8 gene regulated by transcription factor NF-Y in embryonic stem cells and cancer cells. J Biol Chem. 2015;290: 22423–34.
42. Vleugel M, Hoek TA, Tromer E, Sliedrecht T, Groenewold V, Omerzu M, Kops GJ. Dissecting the roles of human BUB1 in the spindle assembly checkpoint. J Cell Sci. 2015;128:2975–82.
43. Ma Q, Liu Y, Shang L, Yu J, Qu Q. The FOXM1/BUB1B signaling pathway is essential for the tumorigenicity and radioresistance of glioblastoma. Oncol Rep. 2017;38:3367–75.
44. Fu X, Chen G, Cai ZD, Wang C, Liu ZZ, Lin ZY, Wu YD, Liang YX, Han ZD, Liu JC, Zhong WD. Overexpression of BUB1B contributes to progression of prostate cancer and predicts poor outcome in patients with prostate cancer. Onco Targets Ther. 2016;9:2211–20.
45. Hudler P, Britovsek NK, Grazio SF, Komel R. Association between polymorphisms in segregation genes BUB1B and TTK and gastric cancer risk. Radiol Oncol. 2016;50:297–307.
46. Scintu M, Vitale R, Prencipe M, Gallo AP, Bonghi L, Valori VM, Maiello E, Rinaldi M, Signori E, Rabitti C, Carella M, Dallapiccola B, Altomare V, Fazio VM, Parrella P. Genomic instability and increased expression of BUB1B and MAD2L1 genes in ductal breast carcinoma. Cancer Lett. 2007;254:298–307. 47. Mukherjee A, Joseph C, Craze M, Chrysanthou E, Ellis IO. The role of BUB
and CDC proteins in low-grade breast cancers. Lancet. 2015;385(Suppl 1): S72.
48. Zhang QH, Yuen WS, Adhikari D, Flegg JA, FitzHarris G, Conti M, Sicinski P, Nabti I, Marangos P, Carroll J. Cyclin A2 modulates kinetochore-microtubule attachment in meiosis II. J Cell Biol. 2017;216:3133–43.
49. Pei J, Zhang J, Yang X, Wu Z, Sun C, Wang Z, Wang B. NEK5 promotes breast cancer cell proliferation through up-regulation of cyclin A2. Mol Carcinog. 2019.
50. Gao T, Han Y, Yu L, Ao S, Li Z, Ji J. CCNA2 is a prognostic biomarker for ER+ breast cancer and tamoxifen resistance. PLoS One. 2014;9:e91771. 51. Mei J, Yan T, Huang Y, Xia T, Chang F, Shen S, Hao L, Chen Y, Wang Z, Jiang
X, Xu B, Zhu Y. A DAAM1 3′-UTR SNP mutation regulates breast cancer metastasis through affecting miR-208a-5p-DAAM1-RhoA axis. Cancer Cell Int. 2019;19:55.
52. Manicum T, Ni F, Ye Y, Fan X, Chen BC. Prognostic values of E2F mRNA expression in human gastric cancer. Biosci Rep. 2018;38.
53. Gayed DT, Wodeyar J, Wang ZX, Wei X, Yao YY, Chen XX, Du Z, Chen JC. Prognostic values of inhibitory kappaB kinases mRNA expression in human gastric cancer. Biosci Rep. 2019;39.
Publisher’s Note