MODELLING THE VOLATILITY OF RUBBER PRICES
IN ASEAN-3
Norlee Ramli
Universiti Kebangsaan Malaysia
Abu Hassan Shaari Md Noor
Universiti Kebangsaan MalaysiaTamat Sarmidi
Universiti Kebangsaan MalaysiaFathin Faizah Said
Universiti Kebangsaan MalaysiaAbdul Hafizh Mohd Azam
Universiti Kebangsaan MalaysiaABSTRACT
Rubber industry has always been vulnerable to the price volatility of standard rubber, which subverts the benefits of rubber production to the local economy. The objectives of this article are to study the volatility of rubber prices and its causality in three countries of main rubber producer namely Malaysia, Thailand and Indonesia as well as synthetic rubber and crude oil. Univariate Generalized Autoregressive Conditional Heteroscedastic (GARCH)-Family models such as an ordinary GARCH, GARCH-M, EGARCH and TGARCH are applied to determine the best model for volatility evaluation. Granger causality test is performed to observe the short-run relationship amongst ASEAN-3. The results denote that conditional variance is determined by past innovation and past conditional variance (volatility). The significance of leverage effect with negative coefficient value shows the existence of asymmetric effect at the same magnitude for Malaysia rubber prices, synthetic rubber prices and crude oil prices. This study indicates the evidence of bidirectional short-run Granger causality using VAR between the prices where any shocks occur at one country will give some impacts to the other countries.
Keywords: Natural rubber price; Volatility; Univariate GARCH; Granger causality (VAR)
1. INTRODUCTION
Natural rubber is one of the very important raw materials in most industries in the world. In recent years, the global economy was found to improve gradually, the demand for natural rubber is increasing, and so is the price of natural rubber. Generally, there are two types of rubber namely natural rubber which is known as latex and synthetic rubber. Natural rubber is tapped from rubber
trees (average maturity is 4 years with an average lifespan of 25 years). Synthetic rubber is oil-based product whose price is largely influenced by the price of crude oil. The global economic situation has deeply affected the secular price trend and production of natural rubber. In addition, due to the growth of the synthetic rubber industry which acts as a substitute for natural rubber, synthetic rubber prices are also becoming increasingly important. When the supply of natural rubber is insufficient or when prices rise, producers tend to choose a type of synthetic rubber which is cheaper than natural rubber (Khin et.al 2013). Like natural rubber, synthetic rubber which is a petrochemical product also has a high volatility, in parallel with the volatility of crude oil prices. The decline in crude oil price causes synthetic rubber price to be cheaper and this in turn reduces the demand for natural rubber. On the contrary, when there is an increase in the price of crude oil, the price of synthetic rubber increases and consumers will switch to natural rubber, thus natural rubber is highly demanded. As such, it is interesting to study the causal relationship between the volatility of natural rubber prices, synthetic rubber price and crude oil price for better understanding on the trend and pattern occurred.
Based on the volume of trade, Indonesia, Thailand and Malaysia are the leading producer and exporter of natural rubber in the world. Total production of natural rubber in three countries is estimated about 8.37 million tons in 2015, representing nearly 68.23% of the total world production (Yanita et.al 2016).
The current use of the world for rubber amounted to around 18 million tonnes per year, consisting of 48% natural rubber (NR), 20% solids styrene butadiene rubber (SBR), 14% latex styrene butadiene (SB), 12% polybutadiene, 5% ethylene propylene diene monomer (EPDM), 2% polychloroprene, 2% nitrile and 7% other synthetic. Therefore, the natural rubber is still the largest share in terms of quantity by type of latex used (Jumpasut 2002). Demand for elastomers, both synthetic rubber (SR) and natural rubber also increased at a rate of 3-4% per year, in line with the improvement of living standards around the world. Global economic decline is affecting the demand of natural rubber, causing the market price is at its lowest level in 30 years (Ghazali et. al 2015).
Figure 1: Natural and Synthetic Rubber Prices (Comparison)
The fundamental factors affecting the price of natural rubber is demand and supply, while all other factors have indirect effects through changes in the fundamentals of demand and supply. In addition, the volatility of world crude oil prices will also affect the price of natural rubber in which the cause behind the fall in rubber prices is none other than crude oil (Kottayam, 2016). This is because crude oil prices affect the cost of production of various goods including synthetic rubber in which 95% of its production is based on crude oil. It is also likely due to global aggregate demand affect both the price of crude oil and synthetic rubber (Sussman & Zohar, 2015). Figure 1 shows the behavior of rubber price which is in parallel with synthetic rubber price for the last 22 years (1986-2010), whenever one price is high then the other price will be low.
The objectives of this article are to model and study the volatility of rubber prices in Asean-3 countries namely Malaysia, Indonesia and Thailand, as the main world rubber producers, synthetic rubber prices and crude oil prices between the periods of 2001 to 2016 using univariate Generalized Autoregressive Conditional Heteroscedastic (GARCH)-Family models. The causality relationship between volatility of natural rubber prices, synthetic rubber prices and crude oil prices are estimated using Vector Autoregressive (VAR) model. The proxies involve are Standard Malaysia Rubber 20 (SMR20), Standard Thailand Rubber 20 (STR20), Standard Indonesia Rubber 20 (SIR20), synthetic rubber (SR) and world crude oil (OILC).
The remaining contents of this article consist of literature review in section 2, methodology in section 3, results and discussion in section 4, conclusion in section 5 and finally the policy implication in section 6.
2. LITERATURE REVIEW
Engle (1982) had introduced the Autoregressive Conditional Heteroscedastic (ARCH) model to overcome the classical assumption on serial correlation, heteroscedasticity and normality. In the meantime, Bollerslev (1986) proposed a Generalized ARCH (GARCH) model, which is the improvement of ARCH model by allowing the conditional variance to be an Autoregressive Moving Average (ARMA) process. The Exponential GARCH (EGARCH) model was proposed by Nelson (1991) to take into account the asymmetric effect while threshold GARCH (TGARCH) was introduced by Zakoian (1994) to estimate the asymmetric effect in the market.
The general model autoregressive conditional heteroskedasticity (GARCH), developed by Engle (1982) and Bolleslev (1986), has proven to be a useful tool to explain empirically momentum in the conditional variance. In GARCH, there is constantly shock to the variance in accordance to structural autoregressive moving average (ARMA). GARCH (p, q) allow random disturbance conditional variance depends linearly on the square of the error term. In addition, the specification of GARCH (1,1) has proven to be a suitable model for time series data.
The trend of volatility in natural rubber price of Malaysia for RSS 1 (Ribbed Smoked Sheet Grade 1) and SMR 20 (Standard Malaysian Rubber Grade 20) was studied using EGARCH and GJR-GARCH models in order to capture the asymmetry (leverage effect) in the variance whereas both models generally did not support asymmetry in the pattern of volatility of both RSS 1 and SMR 20 (Isa & Jamil, 2004).
Another study is performed on the impact of world crude oil price on the supply, demand, stock, synthetic rubber and natural rubber (NR) prices (represented by SMR20) of the Malaysian NR industry using econometric system of equations. A preliminary data analysis focused on univariate properties of the data series for unit root. The Granger causality test is conducted to examine the direction and relationship between the variables. The Vector Error Correction Method (VECM) is used where the results indicate that crude oil price and the supply, demand, stock, synthetic and natural rubber (SMR20) prices are significantly co-integrated, which means that the long-term equilibrium between the variables are met (Khin et al. 2013).
3. METHODOLOGY
The univariate Generalized Autoregressive Conditional Heteroscedastic (GARCH)- models are
applied namely GARCH(1,1), GARCH(1,1)-M, EGARCH(1,1), EGARCH(1,1)-M,
TGARCH(1,1)and TGARCH(1,1)-M in order to model the price return of natural rubber prices (namely SMR20, STR20 and SIR20), synthetic rubber prices and crude oil prices with a period from February 2001 until October 2016 on weekly basis, which resulting in a total 4090 observations. The symmetric volatility of price return is determined using GARCH(1,1) and GARCH(1,1)-M. On the other hand, EGARCH, EGARCH(1,1)-M, TGARCH and TGARCH(1,1)-M models are used to measure the asymmetric volatility. The mean and variance equations involve in analysing the volatility, in which an Autoregressive Moving Average (ARMA) model for mean equation is used to capture the random walk of the estimated series whilst GARCH model is used for variance equation to estimate the volatility.
3.1. Symmetric GARCH models
3.1.1 The Generalized Autoregressive Conditional Heteroscedastic (GARCH) model
This model is extended from original Autoregressive Conditional Heteroscedastic (ARCH), say with a simple GARCH(1,1):
Mean equation rpt = µ + ø1rpt-1 + εt (1)
Variance equation σ2
t = ω + α1ε2t-1 + β1σ2t-1 (2) where ω >0, α1 ≥ 0, and β1 ≥ 0, and :
µ= average return
rpt = return of the asset at time t εt = residual return = vt√ht σ2v =1 and
ht = θ0 + ∑q
i=1 θiε2t-i + ∑pi=1 δi ht-I (3)
where σ2
The return is represented as a linear function of its own lag which is lag 1for mean equation. Variance equation is depending on previous news and previous volatility (own lag of conditional variance). The previous news known as the ARCH term is used to measure the clustering effect. On the other hand the past conditional variance known as GARCH term is used to determine the persistency of the volatility.
3.1.2. The Generalized Autoregressive Conditional Heteroscedastic-in-Mean (GARCH-M)1 The GARCH-M model is suitable to study on asset market which the return of security may depend on its volatility. This model allowed the conditional variance to be inside the mean equation where risk premium can be estimate. A simple model that can be defined properly is GARCH-M(1,1):
Mean equation : rpt = µ + ø1rpt-1 + λσ2
t + εt (4)
Variance equation: σ2
t = ω + α1ε2t-1 + β1σ2t-1 (5) The variance equation is same like previous ordinary GARCH model but the mean equation is different. The parameter λ is called the risk premium parameter where the positive value of the parameter indicates higher risk is associated with high return. Meanwhile, the significant of the parameter shows the compensation to investor if they take the risk in holding the asset.
3.2. Asymmetric GARCH model
3.2.1. The Exponential Generalized Autoregressive Conditional Heteroscedastic (EGARCH) Model
The leverage effect can be measured using an asymmetric GARCH model where bad news increases volatility rather than good news at the same magnitude.
Basic EGARCH(1,1) model is written as below:
Mean equation: rpt = µ + ø1rpt-1 + εt (6)
Variance equation: 𝑙𝑛𝜎2
𝑡= 𝜔 + 𝛽1𝑙𝑛𝜎2𝑡−1 + 𝛼1| 𝜀𝑡−1
𝜎𝑡−1| + 𝛾 𝜀𝑡−1
𝜎𝑡−1 (7)
where leverage parameter, 𝛾 is expected to be negative and significant where negative shock will have greater impact on volatility rather than positive shock.
3.2.2 The Threshold Generalized Autoregressive Conditional Heteroscedastic (TGARCH) Model
Zakoian (1994) has developed TGARCH model to estimate leverage effect with basic specification of TGARCH(1,1) is written as below:
Mean equation: rpt = µ + ø1rpt-1 + εt (8)
Variance equation: 𝜎2
where dt-1 = dummy variable: 𝑑𝑡−1= 1, if 𝜀2𝑡−1 < 0, bad news
= 0, if 𝜀2
𝑡−1 > 0, good news
where leverage effect parameter, 𝛾 is expected to be positive and significant which are different from EGARCH model.
3.3. Error distribution
3.3.1 Normal distribution
The Gaussian distribution which is the normal distribution is the most popular distribution used where the log-likelihood functions is written as below:
Lnormal = − 1 2⁄ ∑𝑇𝑡=1[ln(2𝜋) + ln(𝜎𝑡2) +𝑧𝑡] (10)
where T = number of observations.
3.4. Data
The univariate GARCH models are estimated using weekly data on return prices of natural rubber namely Standard Malaysia Rubber 20 (SMR20), Standard Thailand Rubber 20 (STR20) and Standard Indonesia Rubber 20 (SIR20), synthetic rubber prices (SR) and crude oil prices (OILC) for the period February 2001 to October 2016 giving a total of 4090 observations. All data are obtained from Reuters, Malaysian Rubber Board (MRB) and Data Stream..
Weekly return prices, rpt are calculated as below:
rpt = [log(closet)-log(closet-1)] x 100 (11)
where;
Closet = closing price at the current time (t)
Closet-1 = closing price at the previous day (t-1)
4. RESULTS AND DISCUSSION
4.1. Descriptive Statistic of return series of SMR20, STR20, SIR20, SR and OILC
Table 1: Descriptive Statistics of Return Series of SMR20, STR20, SIR20, SR and OILC
RSMR20 RSTR20 RSIR20 RSR ROILC
Mean 0.0011 0.0011 0.0011 0.0014 0.0004
Median 0.0024 0.0012 0.0021 0.0000 0.0036
Maximum 0.1731 0.1880 0.1799 0.2564 0.1486
Minimum -0.2232 -0.2037 -0.2340 -0.4232 -0.2305
Std. Dev. 0.0306 0.0309 0.0350 0.0540 0.04204
Skewness -0.8996 -0.8140 -0.9232 -0.8624 -0.6591
Kurtosis 9.9580 10.3462 11.2683 11.3171 5.2671
Jarque-Bera 1760.4280 1929.6930 2446.2900 2459.0490 234.4082
Probability 0.0000 0.0000 0.0000 0.0000 0.0000
From table 1, mean value of all series is positive signifying a positive return series where small holders are still making a profit despite the uncertain price of natural rubber. The average return of Malaysia is slightly lower as compared to Indonesia and Thailand. Same goes to the maximum return where Thailand and Indonesia are slightly higher than Malaysia which is about 7.9% and 3.8% respectively. All series are negatively skewed distributions with high kurtosis (leptokurtic) identifying the return series are not normally distributed (according to statistical theory, normal distribution is whenever kurtosis value is 3 and skewness value is 0), and is strongly supported by rejection of null hypothesis for Jarque-Bera (probability values are less than 0.05).
4.2. Quantile-Quantile (Q-Q) Plots
Figure 3: Q-Q Plots of Return Series for SMR20, STR20, SIR20, SR and OILC
4.3. Unit-Root-Test
Table 2: Unit Root Test
Note: *** indicates 1% significant level
Unit root test is to determine the stationarity level of the series. Table 2 shows unit root test of price and return series for SMR20, STR20, SIR20, SR and OILC. The order of integration of the series were tested using Augmented Dickey-Fuller (ADF), Phillips-Perron (PP) and Kwiatkowski-Phillips-Schmidt_Shin (KPSS). Table 2 shows that series of price are not non-stationary whilst series of return are stationary at level. Hence Autoregressive Moving Average (ARMA) can be applied as return series fulfil the requirement of stationary at level.
4.4. Modelling the volatility of SMR20, STR20, SIR20, SR and OILC
Tables 3, 4 and 5 below show the estimation results of SMR20, STR20 and SIR20 return series using GARCH-Family models. From the tables, coefficient AR(1), Ø is found significant for all models, indicating current return is determine by its past value one period. On top of that, the significant of the AR term also shows the inefficiency of the rubber market since the return can be predicted by its previous value. This has been well documented in the efficient market theory by Fama (1970) through weak form hypothesis. Thus, its show that the rubber market is not efficient. Meanwhile the conditional variance is depending on past news about volatility and past one period before of volatility based on significant values gathered for ARCH term (α) and GARCH term (β). In addition, the summation of ARCH term and GARCH term (α + β) measure the persistency of the volatility either it is an explosive process or reverting process. Almost all models have a summation value close to one, signifying the persistency of the volatility.
Indeks Siri ADF PP KPSS
I I & T I I & T I I & T
SMR20 Price -1.8879 -1.6400 -1.7354 -1.4412 1.2146*** 0.5456*** Return -18.0460*** -18.1186*** -17.9401*** -18.0295*** 0.3193 0.0491
STR20 Price -1.7066 -1.4057 -1.6970 -1.3883 1.2022*** 0.5481*** Return -17.6721*** -17.7438*** -17.5498*** -17.6401*** 0.3218 0.0492
SIR20 Price -1.7179 -1.4414 -1.8585 -1.6165 1.1095*** 0.5337*** Return -20.2458*** -20.3133*** -20.2087*** -20.3331*** 0.3015 0.0474
SR Price -3.4712* -3.679* -2.9877* -3.1490** 1.0127*** 0.3991*** Return -12.6835*** -12.6798*** -16.3405*** -16.3321*** 0.0368 0.0236
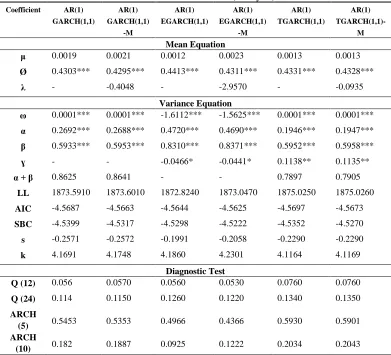
Table 3: SMR20 Estimation (Malaysia)
Coefficient AR(1)
GARCH(1,1) AR(1) GARCH(1,1) -M AR(1) EGARCH(1,1) AR(1) EGARCH(1,1) -M AR(1) TGARCH(1,1) AR(1) TGARCH(1,1)-M Mean Equation
μ 0.0019 0.0021 0.0012 0.0023 0.0013 0.0013
Ø 0.4303*** 0.4295*** 0.4413*** 0.4311*** 0.4331*** 0.4328***
λ - -0.4048 - -2.9570 - -0.0935
Variance Equation
ω 0.0001*** 0.0001*** -1.6112*** -1.5625*** 0.0001*** 0.0001***
α 0.2692*** 0.2688*** 0.4720*** 0.4690*** 0.1946*** 0.1947***
β 0.5933*** 0.5953*** 0.8310*** 0.8371*** 0.5952*** 0.5958***
ɣ - - -0.0466* -0.0441* 0.1138** 0.1135**
α + β 0.8625 0.8641 - - 0.7897 0.7905
LL 1873.5910 1873.6010 1872.8240 1873.0470 1875.0250 1875.0260
AIC -4.5687 -4.5663 -4.5644 -4.5625 -4.5697 -4.5673
SBC -4.5399 -4.5317 -4.5298 -4.5222 -4.5352 -4.5270
s -0.2571 -0.2572 -0.1991 -0.2058 -0.2290 -0.2290
k 4.1691 4.1748 4.1860 4.2301 4.1164 4.1169
Diagnostic Test
Q (12) 0.056 0.0570 0.0560 0.0530 0.0760 0.0760
Q (24) 0.114 0.1150 0.1260 0.1220 0.1340 0.1350
ARCH
(5) 0.5453 0.5353 0.4966 0.4366 0.5930 0.5901
ARCH
(10) 0.182 0.1887 0.0925 0.1222 0.2034 0.2043
Note: ***, **, * denotes significant at 1%, 5% and 10%
Table 4: STR20 Estimation (Thailand)
Coefficient AR(1)
GARCH(1,1) AR(1) GARCH(1,1) -M AR(1) EGARCH(1,1) AR(1) EGARCH(1,1) -M AR(1) TGARCH(1,1) AR(1) TGARCH(1,1)-M Mean Equation
μ 0.0022 0.0019 0.0018 0.0013 0.0017 0.0013
Ø 0.5106*** 0.5109*** 0.5032*** 0.5021*** 0.5126*** 0.5149***
Coefficient AR(1) GARCH(1,1) AR(1) GARCH(1,1) -M AR(1) EGARCH(1,1) AR(1) EGARCH(1,1) -M AR(1) TGARCH(1,1) AR(1) TGARCH(1,1)-M Variance Equation
ω 0.0001*** 0.0001*** -1.6914*** -1.7612*** 0.0001*** 0.0001***
α 0.3625*** 0.3664*** 0.5529*** 0.5634*** 0.3118*** 0.3135***
β 0.5416*** 0.5320*** 0.828689*** 0.8205*** 0.5302*** 0.5192***
ɣ - - -0.036891 -0.0367 0.0920 0.0940
α + β 0.9041 0.8984 - - 0.8420 0.8327
LL 1902.3990 1902.6270 1902.55 1902.8050 1902.9340 1903.1640
AIC -4.6391 -4.6372 -4.637043 -4.6352 -4.6380 -4.6361
SBC -4.6103 -4.6027 -4.602518 -4.5949 -4.6035 -4.5958
s -0.2874 -0.2770 -0.239454 -0.2249 -0.2596 -0.2486
k 5.2716 5.2218 5.286423 5.1989 5.2387 5.1989
Diagnostic Test
Q (12) 0.2760 0.2500 0.2190 0.1680 0.3130 0.2890
Q (24) 0.2690 0.2360 0.2430 0.1930 0.2680 0.2360
ARCH (5) 0.9421 0.9383 0.9225 0.8941 0.9662 0.9617
ARCH(10) 0.9618 0.9536 0.9456 0.9173 0.9638 0.9529
Note: ***, **, * denotes significant at 1%, 5% and 10%
Table 5: SIR20 Estimation (Indonesia)
Coefficient AR(1)
GARCH(1,1) AR(1) GARCH(1,1) -M AR(1) EGARCH(1,1) AR(1) EGARCH(1,1) -M AR(1) TGARCH(1,1) AR(1) TGARCH(1,1)-M Mean Equation
μ 0.0017 0.0018 0.0020 0.0003 0.0017 0.0018
Ø 0.3918*** 0.3916*** 0.3899*** 0.3948*** 0.3918*** 0.3917***
λ - -0.1418 - 1.1089 - -0.1152
Variance Equation
ω 0.0002*** 0.0002*** -1.6155*** -1.6571*** 0.0002*** 0.0002***
α 0.2785*** 0.2782*** 0.4530*** 0.4603*** 0.2835*** 0.2830***
β 0.5631*** 0.5635*** 0.8188*** 0.8137*** 0.5631*** 0.5634***
ɣ - - -0.0164 -0.0207 -0.0079 -0.0075
α + β 0.8416 0.8417 - - 0.8466 0.8464
LL 1746.2670 1746.2690 1745.2050 1745.2430 1746.2730 1746.2740
Coefficient AR(1)
GARCH(1,1)
AR(1)
GARCH(1,1)
-M
AR(1)
EGARCH(1,1)
AR(1)
EGARCH(1,1)
-M
AR(1)
TGARCH(1,1)
AR(1)
TGARCH(1,1)-M
SBC -4.2286 -4.2204 -4.2178 -4.2097 -4.2204 -4.2122
s -0.1225 -0.1231 -0.1052 -0.1179 -0.1267 -0.1270
k 5.4106 5.4128 5.7143 5.6867 5.4108 5.4126
Diagnostic Test
Q (12) 0.4680 0.4730 0.4100 0.3790 0.4670 0.4710
Q (24) 0.2920 0.2940 0.2690 0.2560 0.2920 0.2940
ARCH (5) 0.4677 0.4632 0.4571 0.4866 0.4711 0.4672
ARCH
(10) 0.3755 0.3743
0.2067 0.215 0.3819 0.3806
Note: ***, **, * denotes significant at 1%, 5% and 10%
GARCH(1,1)-M known as GARCH-in-Mean allows the conditional variance in the mean equation and, is applied to measure the risk premium where it is normally used for estimation the stock market or any financial data. Normally positive value of risk premium indicates that higher risk is associated with higher return and negative value of the risk premium parameter denotes higher risk is associated with lower return.
Exponential GARCH or EGARCH (1,1) model is used in this analysis as to determine the existence of leverage effect measured by the gamma (γ) coefficient. Asymmetric effect is therefore exists when the value of (γ) coefficient found to be significant. As for the negative value of the coefficient is an indication of bad news increases volatility for next period rather than good news at the same magnitude. The Empirical results show that value of γ found to be significant and negative in the case of SMR20 (-0.04655), SR (-0.052196) and OILC (-0.069865) but not significant for STR20 and SIR20. Therefore SMR20, SR and OILC exhibit leverage effect since the results gathered indicate the negative and significant of the leverage parameter.
Threshold GARCH known as (TGARCH) is another GARCH model that is used to estimate an asymmetric effect. However the value of γ is expected to be positive to indicate the presence of leverage effect which contradicting from the previous EGARCH model. As before, the empirical results show that value of γ found to be significant and positive in the case of SMR20 (0.113809), SR (0.090258) and OILC (0.06878) indicating the presence of leverage effect. However there is no leverage effect in the case of STR20 and SIR20 as γ coefficient value is not significant.
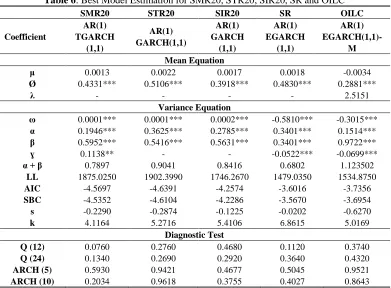
Table 6: Best Model Estimation for SMR20, STR20, SIR20, SR and OILC
SMR20 STR20 SIR20 SR OILC
Coefficient
AR(1) TGARCH
(1,1)
AR(1) GARCH(1,1)
AR(1) GARCH
(1,1)
AR(1) EGARCH
(1,1)
AR(1)
EGARCH(1,1)-M Mean Equation
μ 0.0013 0.0022 0.0017 0.0018 -0.0034
Ø 0.4331*** 0.5106*** 0.3918*** 0.4830*** 0.2881***
λ - - - - 2.5151
Variance Equation
ω 0.0001*** 0.0001*** 0.0002*** -0.5810*** -0.3015***
α 0.1946*** 0.3625*** 0.2785*** 0.3401*** 0.1514***
β 0.5952*** 0.5416*** 0.5631*** 0.3401*** 0.9722***
ɣ 0.1138** - - -0.0522*** -0.0699***
α + β 0.7897 0.9041 0.8416 0.6802 1.123502
LL 1875.0250 1902.3990 1746.2670 1479.0350 1534.8750
AIC -4.5697 -4.6391 -4.2574 -3.6016 -3.7356
SBC -4.5352 -4.6104 -4.2286 -3.5670 -3.6954
s -0.2290 -0.2874 -0.1225 -0.0202 -0.6270
k 4.1164 5.2716 5.4106 6.8615 5.0169
Diagnostic Test
Q (12) 0.0760 0.2760 0.4680 0.1120 0.3740
Q (24) 0.1340 0.2690 0.2920 0.3640 0.4320
ARCH (5) 0.5930 0.9421 0.4677 0.5045 0.9521
ARCH (10) 0.2034 0.9618 0.3755 0.4027 0.8643
Note: ***,**, * denotes significant at 1%, 5% and 10%
4.5. Volatility Profile
Figure 4: Volatility Profile of SMR20, STR20, SIR20, SR and OIL
4.6. Granger Causality
Unit root test need to be performed as to determine the stationary of volatility series. Monthly volatility series are used as to prevent bias and inconsistency estimation by averaging the daily data series.
Table 7: Unit Root Test of Volatility Series
SERIES LEVEL
ADF PP
VOLSMR20 -6.9992*** -6.7051***
VOLSTR20 -7.0377*** -7.0907***
VOLSIR -7.2785*** -7.1665***
VOLSR -4.2783*** -4.4168***
VOLOILC -4.8838*** -3.4544**
Note: ***, **denote significant at 1% and 5%.
Table 7 shows that all series are integrated of order or I(0) where null hypothesis of non-stationary series is rejected at 1% significant level.
Table 8: Granger Causality of SMR20, STR20, SIR20, SR and OILC Dependent
Variable VOLSMR20 VOLSTR20 VOLSIR20 VOLSR VOLOILC
VOLSMR20 - 6.5531** 14.418*** 3.1298 2.5652
VOLSTR20 2.8170 - 30.6004*** 0.2554 3.0119
VOLSIR20 1.3047 6.9964** - 3.3253 0.5796
VOLSR 2.8222 1.9333 5.3342* - 4.6215*
VOLOILC 0.0213 4.4875 8.6561** 8.9703** -
Note: ***, **, * denote significant at 1%, 5% and 10%.
5. CONCLUSION
This article studies the volatility of return price of Standard Malaysia Rubber (SMR20), Standard Thailand Rubber (STR20), Standard Indonesia Rubber (SIR20), synthetic rubber and crude oil using univariate Generalized Autoregressive Conditional Heteroscedastic (GARCH)-family model for the period of February 2001 to October 2016. The functional coefficient autoregression of order p (AR(p)) with the conditional variance specified as a general nonlinear first order generalized autoregressive conditional heteroskedasticity (GARCH(1,1)) model is applied. Six different GARCH models were applied in this study namely Generalized Autoregressive Conditional Heteroscedastic (GARCH(1,1)) and Generalized Autoregressive Conditional Heteroscedastic-in-Mean (GARCH(1,1)-M) which are an ordinary or symmetric GARCH, an
asymmetric Exponential Generalized Autoregressive Conditional Heteroscedastic
(EGARCH(1,1)), Exponential Generalized Autoregressive Conditional Heteroscedastic-in-Mean (EGARCH(1,1)-M), Threshold Generalized Autoregressive Conditional Heteroscedastic (TGARCH(1,1)) and Threshold Generalized Autoregressive Conditional Heteroscedastic-in-Mean (TGARCH(1,1)-M) which are used to measure the leverage effect. Modelling the volatility is best handled using GARCH model as heteroscedasticity problem can be prevented. Furthermore, significant of the ARCH term (α) and the GARCH term (β) values signify that future volatility is depending on its past innovation and past volatility and summation of both terms, (α + β) indicates the persistency of the volatility. The higher is the persistency, the longer it takes to die-off. However, from the results gathered, return series of Thailand and Indonesia indicate the absence of leverage effect as ɣ is not significant. The empirical evidence shows that the best volatility model of SMR20 is presented by AR(1) TGARCH(1,1), while STR20 best model is AR(1) GARCH(1,1) and AR(1) GARCH(1,1) for SIR20. As for SR, AR(1) EGARCH(1,1) found to be the best volatility model and OILC is presented by AR(1) EGARCH(1,1)-M model. The dynamics of rubber prices in ASEAN-3 can obviously be observed where the trend is very much affected by the global shocks occurred in the market. There are also an evidence of the existence of bidirectional and single directional Granger causality between the series of volatility. The results gathered show that the volatility of Standard Malaysian Rubber (VOLSMR20) Granger cause VOLSTR20 and VOLSIR20 but the converse is not true The research indicates that the three main world rubber producers are associated to each other where any shocks from Malaysian rubber market will give some impacts to Thailand and Indonesian rubber market volatility. Therefore, it is very crucial for the three countries to cooperate together to establish the best policy to cater for any consequences occurred due to high volatility of rubber prices.
6. POLICY IMPLICATION
the risk-spreading process or massive volatility spillover in a large scale and in a short time of period (Mori 2015). In line with the regression findings that found significant correlation to transmission of shocks, it is particularly important for the ASEAN-3 countries to create a comprehensive policy to offset the natural rubber price market that has undergone a change as the response to the shocks received. It is therefore very crucial for these three countries to establish certain policies in regulating the stability of the natural rubber industry, particularly in the ASEAN region.
ACKNOWLEDGEMENT
High appreciation goes to Malaysian Rubber Board as the funder of this research and Universiti Kebangsaan Malaysia for the facilities offered.
REFERENCES
Engle, R. F. (1982). Autoregressive conditional heteroscedasticity with estimates of the variance of United Kingdom inflation. Econometrica, 50(4), 987–1007.
Fama, E. F. (1970). Efficient capital markets: A review of theory and empirical work*. The Journal of Finance, 25(2), 28–30.
Ghazali, M, F., Lean, H, H., & Bahari, Z. (2015). Is gold a good hedge against inflation? Empirical evidence in Malaysia. Kajian Malaysia, 33(1), 69–84.
Isa, Z., & Jamil, A, N. (2004). Tabiat kemeruapan perubahan harga getah asli Malaysia. Jurnal Ekonomi Malaysia, 38, 63–79.
Jumpasut, P. (2002). Recent Trends and Outlook For Elastomers. The Fifth International Conference on New Opprtunities for Thermoplastic Elastomers(TPE 2002), 29-40. Khin, A, A., Mohamed, Z, A., & Hameed, A, A, A. (2013). The impact of the changes of the world
crude oil prices on the natural rubber industry in Malaysia. World Applied Sciences Journal, 28(7), 993-1000.
Kottayam. (2016). Crude oil is the real villain behind the rubber price fall. Business Line – Economy.
Mori, K. (2015). Limpahan kemeruapan dan korelasi dinamik pasaran saham dan tukaran asing
di ASEAN-5. Tesis Doktor Falsafah, Universiti Kebangsaan Malaysia.
Nelson, D. B. (1991). Conditional heteroskedasticity in asset returns: A new approach. Econometrica, 59(2), 347–370.
Sussman, N., & Zohar, O. (2015). Oil prices, inflation expectations, and monetary policy. Vox Cepr’s Policy Porta.