Validation of Spectroscopic Model for Fe Ions in Non-Equilibrium
Ionization Plasma in LHD and Hinode
∗)Izumi MURAKAMI
1,2), Tetsuya WATANABE
3,4), Chihiro SUZUKI
1), Shigeru MORITA
1,2),
Chunfeng DONG
1), Naoki TAMURA
1), Norimasa YAMAMOTO
5), Daiji KATO
1,2),
Hiroyuki A. SAKAUE
1), Hirohisa HARA
3,4), Nobuyuki NAKAMURA
6)and Shigeru SUDO
1,2)1)National Institute for Fusion Science, Toki, Gifu 509-5292, Japan
2)Department of Fusion Science, The Graduate University of Advanced Studies (SOKENDAI), Toki, Gifu 509-5292, Japan 3)National Astronomical Observatory of Japan, Mitaka, Tokyo 181-8588, Japan
4)Department of Astronomical Science, The Graduate University of Advanced Studies (SOKENDAI), Mitaka, Tokyo
181-8588, Japan
5)Center of Applied Superconductivity and Sustainable Energy Research, Chubu University, Kasugai, Aichi
487-8501, Japan
6)Institute for Laser Science, The University of Electro-Communications, Chofu, Tokyo 182-8585, Japan
(Received 25 September 2013/Accepted 16 February 2014)
We measured extreme ultraviolet spectra of Fe ions for plasmas produced in the Large Helical Device (LHD) at the National Institute for Fusion Science (NIFS). Iron was injected into the plasmas by using a tracer– encapsulated pellet. By controlling the neutral beam injection pattern, we could produce plasma with a central electron temperature of approximately 500 eV, which was suitable for producing Fe XVII ions. We measured seven Fe XVII lines. The intensity ratio forλof 20.468 to 25.493 nm was consistent with the theoretically cal-culated value of 1.1. This calcal-culated value was determined purely from the branching ratio due to the common upper level of these transitions, although Warrenet al.[Astrphys. J.685, 1277 (2008)] reported a larger ratio of approxinately 2 fromHinodeEIS measurements. The other five ratios for Fe XVII lines in our LHD measure-ments were also consistent with the theoretical ratios calculated with a collisional–radiative model. A preferred atomic dataset for Fe XVII is suggested to obtain better agreement between the measured and calculated ratios.
c
2014 The Japan Society of Plasma Science and Nuclear Fusion Research
Keywords: Fe XVII spectral lines, spectroscopic diagnostics, EUV spectrum, solar plasma, fusion plasma DOI: 10.1585/pfr.9.1401056
1. Introduction
In solar physics, one of the major issues to be solved is the identification of the heating mechanism that keeps the hot and diffuse corona, extending above the Sun’s cool atmosphere at its high temperature of a few million de-grees. Since 2006, theHinodespacecraft has been in or-bit to study the heating mechanism and dynamics of the active solar corona, the origin of strong magnetic fields, and the trigger mechanism for solar flares [1]. Hinodeis equipped with a solar optical telescope (SOT), an X-ray telescope (XRT), and an extreme ultraviolet (EUV) imag-ing spectrometer (EIS). The EIS takes EUV images of the Sun as well as EUV spectra in the wavelength regions of 17.0 - 21.0 nm and 25.0 - 29.0 nm [2]. In these regions, Fe VIII–XXIV lines are measurable and are expected to pro-vide information on the solar plasma in the wide electron temperature range 4.7<logTe[K]<7.2.
author’s e-mail: [email protected]
∗)This article is based on the invited talk at the 29th JSPF Annual Meeting (2012, Fukuoka).
Several models have been proposed to explain coro-nal heating by acoustic waves, Alfvén body waves, mi-croflares, etc [3]. Conventional one-fluid MHD plasma in thermal equilibrium has been used for modeling so-lar plasma. Typical ions observed in the soso-lar transition region and the corona have long ionization and recom-bination timescales, and non-equilibrium ionization has been suggested especially for plasma with flow [4] or so-lar fso-lares [5]. When the ionization timescale is longer than the time required for an ion to traverse a temperature scale height, the degree of ionization is delayed behind the equi-librium value under local conditions. In the solar transi-tion region, the electron temperature and density change drastically, and non-equilibrium conditions can result from downflows or outflows in the transition region. Dupreeet al.[4] showed that the electron temperature dependences of O IV, N IV, and C IV spectral-line intensity ratios are altered when plasma is in non-equilibrium with outflows in the transition region. Imadaet al.[6] found that the Fe ion state distribution is quite different from that for
ion-c
2014 The Japan Society of Plasma
ization equilibrium when time-dependent ionization and recombination processes are considered in the shock re-gion caused by magnetic reconnection. Thus, when ana-lyzing the spectroscopic data, we need to focus on phys-ical conditions of plasma, such as flows and shocks. In addition, non-thermal velocities measured as an excess of line thermal broadening are thought to be caused by tur-bulence, waves, or velocity gradients; those velocities pro-vide important information for examining the coronal heat-ing mechanism [7]. Doschecket al.[7] and Imadaet al.[8] estimated non-thermal velocities in the solar active region by using Fe XII and Fe XVI lines, and obtained values of 30 - 60 km s−1 and approximately 13 km s−1, respectively.
Such estimates depend on the accuracy of thermal condi-tion determinacondi-tion for plasmas.
The accuracy of the analyzed results from spectro-scopic measurements depends on that of the spectrospectro-scopic model and the atomic data used in the model. As Hin-odeEIS measures Fe VIII–XXIV lines for plasma diag-nostics as good indices for the solar transition region over a wide electron temperature range, we have constructed collisional–radiative (CR) models for Fe7+–Fe23+ ions to analyze both solar and laboratory plasmas [9–14]. We have carefully examined atomic data of Fe ions to be used in the CR models [15, 16], and so far, have applied the models to the measurements of laboratory plasmas to validate the CR models and atomic data for Fe XIII [9,14], Fe XIV [14], Fe XV [14], Fe XXI [12], and Fe XXII [13].
The Large Helical Device (LHD) in the National In-stitute for Fusion Science (NIFS) was used to validate the CR models and atomic data of Fe ions. The LHD can maintain stable plasmas even after impurity elements are injected by an impurity pellet or a tracer-encapsulated pel-let (TESPEL) [17, 18]. The LHD has various diagnostic systems for measuring electron temperature, density, and other plasma properties. LHD plasmas have electron tem-perature distributions from a few electron volts in the pe-ripheral region to approximately 4 keV in the plasma cen-ter. We can produce plasmas in the LHD with electron temperatures similar to those in the solar transition region and the corona. Thus, we used a TESPEL to inject iron into LHD plasmas and measured EUV spectra to compare with the model calculations [9, 12, 13]. The CR model for Fe XIII evaluated using the LHD experiments [9] has been applied to analyze solar spectra measured byHinodeEIS to estimate the electron density distribution in the solar ac-tive region [11].
We also used an electron beam ion trap (EBIT) device and compact EBITs (CoBITs) at the University of Electro-Communications (UEC) and NIFS [19, 20]. An EBIT ion-izes ions by an electron beam and traps them with an elec-tric field of the electron beam. It produces diffuse plasma with an electron density of approximately 1010cm−3. It
controls the ion charge distribution by choosing the elec-tron beam energy, and the charge states of spectral lines can be identified easily as only ions with ionization
po-tentials smaller than the electron beam energy are pro-duced. EUV spectral lines of Fe XIII, Fe XIV, and Fe XV were measured by the CoBIT at the UEC and compared with the CR model calculations [14]. Electron density de-pendence of line ratios for Fe XIII and Fe XIV agreed very well with the CR model calculations, but the Fe XV 23.39 nm/24.38 nm ratio was a factor 1.5 - 2 larger than that obtained from the model calculation. To find the cause of this discrepancy, we need to examine measurements, atomic data, and the CR model even more carefully.
Here we focus on Fe XVII. Recently, Fe XVII spec-tral lines were measured byHinodeEIS and discrepancies from theoretical predictions were reported for the intensity ratios of Fe XVII 20.4675 nm (2p53s1P
1–2p53p1S0) and
25.4885 nm (2p53s3P
1–2p53p1S0) [21]. The upper levels
of both transitions are the same (2p53p1S
0), so the
inten-sity ratio is determined by the branching ratio of 1.1 and does not depend on plasma conditions for optically thin plasma. However, the measured ratio was 2.5. In addition, otherHinode EIS results for this line ratio for the solar active region also show this discrepancy; the ratio tends to increase with decreasing electron temperature [22]. The same lines were measured previously in solar-flare spec-tra bySkylaband the ratio was 1.1, which agreed with the theoretical prediction [23]. Del Zanna and Ishikawa [24] made a list of Fe XVII EUV lines based on twoHinode
EIS measurements, and also reported a discrepancy with respect to theoretical calculations for this line ratio. They suggested that the 20.466-nm line was blended with an unidentified line at 20.472 nm, with the same morphology as the Fe VIII line in the monochromatic images taken by
HinodeEIS.
In order to use the Fe XVII lines for diagnosing high-temperature solar active region, the validation of the atomic data for Fe XVII is needed. Jönsson et al.[26] performed theoretical calculations for the Fe XVII atomic structure by using the GRASP2K code, which is widely used for theoretical studies of atoms and is believed to have a high accuracy [25]. Relativistic effects were care-fully considered in configuration interaction calculations. The results obtained for the branching ratio of the two Fe XVII lines agreed with the previous prediction [26].
In this study, we used LHD plasmas to measure the Fe XVII spectral lines for validation of the atomic data and the CR model for Fe XVII experimentally and to investi-gate the discrepancy in the Fe XVII line ratio between the-oretical predictions andHinodeEIS measurements. These two Fe XVII lines are very weak and were not detected us-ing CoBIT. In Sec. 2, we briefly introduce the CR model, followed by an explanation of the measurements with the LHD and the analysis in Sec. 3. In Secs. 4 and 5, we dis-cuss the results of validation of the CR model andHinode
2. Collisional–Radiative Model
The spectral line intensity of the transition from level
ito level jis proportional to the product of the population density of the upper level; radiative transition probability; and energy difference of the transition,n(i)Ar(i,j)ΔE(i,j).
We constructed a CR model to calculate the population densities of excited states for an Fe ion using the quasi-steady-state approximation. We assumed that population densities of excited states relax fast enough, compared to the timescales for changes in plasma properties and ion densities, and solved the rate equations for population den-sities as dn(i)/dt = 0. Excited states up to the principal quantum numbern=5 were considered, and a total of 157 fine-structure levels were included. The rate equation is written as
dn(i) dt
=
ji
{C(j,i)ne+Cp(j,i)np}n(j)+
j>i
Ar(j,i)n(j)
−
ji
{C(i,j)ne+Cp(i,j)np+S(i)ne}n(i)
−
j<i
Ar(i,j)n(i). (1)
We included radiative decay (Ar(i,j)), electron-impact
ex-citation and de-exex-citation (C(i,j)), electron-impact ioniza-tion (S(i)), and proton-impact excitation and de-excitation (Cp(i,j)) processes. Recombination processes were not
in-cluded in this model because LHD plasmas are mostly in an ionizing plasma phase, and in such cases, recombina-tion processes are not important for the spectral analysis. Energy levels, transition probabilities, and electron-impact excitation and ionization cross sections were calculated with the HULLAC atomic code [27]. Proton-impact rate coefficients were taken from recommended data [15].
For comparison, we also calculated population den-sities and photon emissivity coefficients using the ADAS package [28]. ADAS contains various atomic datasets for one ion; for comparison, we selected three diff er-ent atomic datasets for energy levels, transition prob-abilities, and electron-impact excitation effective colli-sion strengths. Specifically, the selected datasets were “chv6” whose atomic data are taken from CHIANTI ver.6 (245 levels) [29], “cpb06” whose excitation effective col-lision strengths are obtained by the Dirac-Fock R-matrix method (139 levels) [30], and “lgy09” whose excitation effective collision strengths are obtained by the ICFT R-matrix method (209 levels) [31]. In the CHIANTI dataset, electron-impact excitation rate coefficients are calculated by the distorted wave method and are included only for cer-tain selected transitions. The same atomic data of “cpb06” were used for the intensity calculations in [24].
3. LHD Experiments
EUV spectra in the 10 - 30 nm wavelength range were measured for plasmas in LHD using a flat-field EUV spec-trometer [32]. The specspec-trometer can cover a wavelength range of 5 - 50 nm using a laminar-type holographic grat-ing. Spectral resolution of approximately 0.02 nm was achieved at 20 nm. A 0.15µm thick aluminum filter was placed in front of the grating to screen out emissions in wavelengths below approximately 17 nm. This success-fully reduced the contamination of higher-order emission lines, especially the second-order emission line of Fe XXII at 10.22 nm, which could overlap with the Fe XVII line at 20.468 nm. The exposure time of one frame was 5 ms. A new technique for absolute intensity calibration was con-ducted using bremsstrahlung continuum radiation and a branching ratio of C IV lines [33].
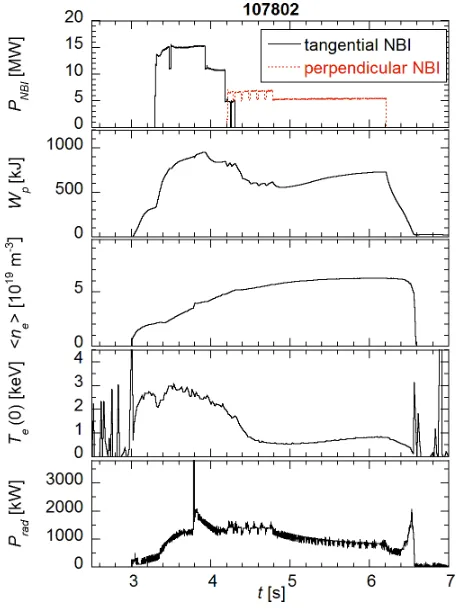
We analyzed the spectra measured for the plasma of shot number 107802. Figure 1 shows the temporal distri-bution of the discharge. Three tangential neutral beams (NBIs) were injected att=3.3 - 4.3 s, and two
perpendic-ular neutral beams were injected att =4.2 - 6.2 s. Due to
these changes, the stored energyWp and the central
elec-tron temperature started decreasing drastically att=4.3 s,
reached their minimum at aroundt = 5 s, and increased again. The minimum central electron temperature was
Fig. 1 Temporal evolution of shot 107802 discharge for NBI power PNBI, stored energy Wp, line-averaged electron
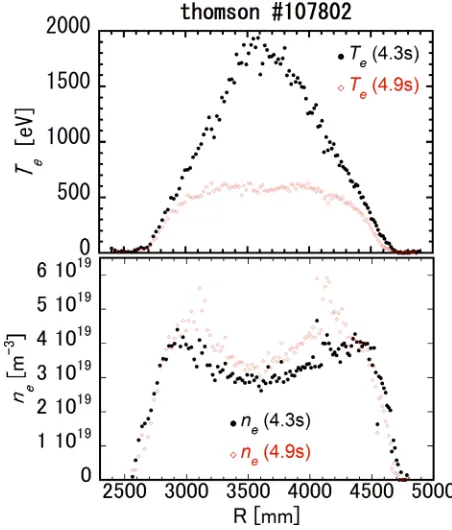
Fig. 2 Electron temperature distributions (top) and electron den-sity distributions (bottom) measured by Thomson scatter-ing att=4.3 s (solid circles) and 4.9 s (open diamonds).
about 500 eV. Figure 2 shows the electron temperature and density distributions att =4.3 and 4.9 s. Att =4.3 s, the
central electron temperature was about 2 keV with a peaky distribution; at t = 4.9 s, the distribution flattened with
a central electron temperature of approximately 500 eV. This temperature is suitable for Fe XVII measurements. Att = 3.8 s, a TESPEL doped with iron powder was in-jected. This instantly caused a large radiation power loss, but soon the loss became less effective. The electron tem-perature and density in the outer region were not affected by the changes in the central region.
Figures 3 (a) and 3 (b) show the EUV spectra att=4.4
and 5.0 s for wavelength regions 18 - 22 nm and 25 - 29 nm, respectively. Att = 4.4 s, the central electron
tempera-ture was high, as shown in Fig. 2, and Fe ions in higher charge states were observed, such as Fe XXIII and Fe XXIV. However, when the central electron temperature decreased to approximately 500 eV at aroundt=5.0 s, the
higher charged ions disappeared and Fe XVII at 20.468 and 25.493 nm were clearly detected. Lower charged Fe ions such as Fe XII and Fe XIII were constantly observed as these ions exist in the peripheral region at lower electron temperatures of approximately 100 eV.
As listed in Table 1, a total of seven Fe XVII lines ap-pear in Fig. 3. The measured wavelengths were calibrated with known prominent Fe XXIV lines and other impurity lines. Errors for the line wavelengths measured in the LHD in Table 1 were obtained by fitting to a Gaussian profile. The pixel size of the measurements corresponds to about
Fig. 3 EUV spectra at 4.4 s (dotted line) and 5.0 s (solid line) (a) for 18 - 22 nm wavelength region and (b) for 25 - 29 nm wavelength region of shot 107802. Forty frames (Δt =
200 ms) were added to obtaine the spectra. Wavelengths shown in bold face for identified lines were measured; others were taken from the NIST ASD database [35].
0.02 nm, but high S/N ratios in the measurements allow smaller errors for the line fits. The wavelengths of all Fe XVII lines roughly agree with those measured byHinode
EIS, those in the NIST database [34], and those calculated by the GRASP code [26]. We follow the identifications of the transitions for theλ26.646-nm and 27.564-nm lines in the NIST database and the GRASP calculation. The iden-tifications of these two lines are exchanged in the list of Warrenet al.[21]. The upper levels of these transitions are mixed with1D
2 and3F2 levels due to configuration
mix-ing, and similarly, the lower levels are mixed with1P 1and 3D
1levels.
The lower level of the transition for λof 28.021 nm (no.6 in Table 1) is mixed with 2s2 2p5 3p 1D
2 and3D2
Table 1 Observed Fe XVII lines.
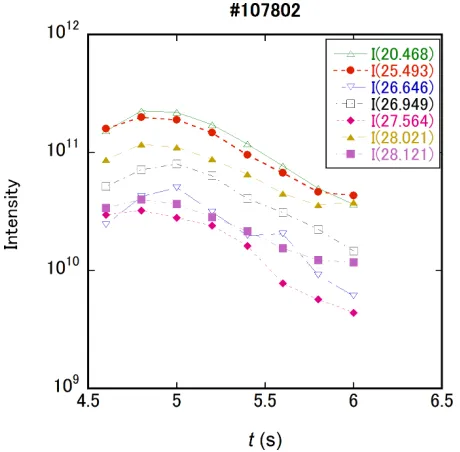
Fig. 4 Temporal evolution of Fe XVII line intensities for shot 107802.
coupling, so no LS terms were specified in the HULLAC calculation.
Figure 4 shows the temporal distribution for Fe XVII
Fig. 5 Temporal evolution of Fe XVII line ratio forλ20.468 nm andλ25.493 nm (solid circles) and the central electron temperature (solid squares).
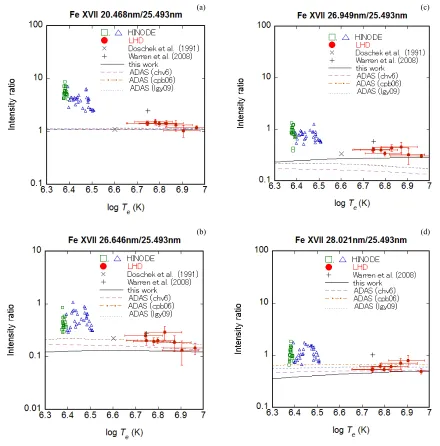
Fig. 6 Fe XVII line ratios as functions of electron temperature. (a) Fe XVII 20.468/25.493, (b) Fe XVII 26.646/25.493, (c) Fe XVII 26.949/25.493, and (d) Fe XVII 28.021/25.493. Solid dots with error bars are our measurements in LHD. Other measured values are fromHinodeEIS measurements (open triangles and open squares [22] and plus symbol [21]) and theSkylabmeasurements (crosses [23]). Theoretical calculations are from our CR model (solid line), ADAS calculations with chv6 atomic dataset (dashed line), ADAS calculations with cpb06 atomic dataset (dot-dashed line), and ADAS calculations with lgy09 atomic dataset (dotted line).
20.468-nm and 25.493-nm lines and the central electron temperature as functions of time. Figure 6 (a) shows the measured energy intensity ratio as a function of central electron temperature. There are time variations in the in-tensity ratio, and the average inin-tensity ratio is 1.35±0.16, which is slightly larger than the theoretically obtained value of 1.1. The observed 20.468-nm line is possibly blended with Fe XIII 20.43-nm and 20.494-nm lines, as other Fe XIII lines such as the 20.383-nm line constantly appeared just after pellet injection untilt=6.4 s when the Fe XVII 20.468-nm line disappeared. Such lower charged Fe ions exist in the lower-temperature peripheral region, which intersects the line of sight. We need to subtract the
of the analysis for subtracting the contributions of Fe XIII lines are described by Watanabeet al.[36].
4. Model Validation
As described above, we confirm that the measured in-tensity ratio for Fe XVII 20.468 and 25.493 nm is con-sistent with the theoretical prediction. Now we compare measured energy intensity ratios for other Fe XVII lines listed in Table 1 with theoretical calculations by the CR model. Some of the results are shown in Fig. 6. Measured ratios are plotted as solid dots with error bars; other data measured for the solar plasma bySkylab[23] (crosses) and
HinodeEIS [21, 22] (squares and triangles) are also plot-ted for comparison. In Fig. 6 (a), measured line ratios for 20.468 and 25.493 nm before the calibration are plotted. To compare with the measured 28.021-nm line intensity, the calculated intensities of two lines (nos. 6 and 6’ in Ta-ble 1) were summed. Basically, the differences between the four theoretical calculations are mainly due to diff er-ent atomic data, i.e., transition probabilities and electron-impact excitation effective collision strengths.
All measured ratios in the LHD plasma are roughly consistent with the calculated ratios, but ratios from Hin-odeEIS measurements are larger than the theoretical cal-culations, as seen in Fig. 6. Ratios from our CR model calculations are marginally consistent with the LHD mea-surements, but tend to be lower than the measurements. As described in Sec. 3, the measured ratios forλof 20.468 to 25.493 nm are slightly larger than the theoretical calcula-tions (Fig. 6 (a)), because theλ20.468-nm line is blended with the Fe XIII line. After subtracting the latter con-tribution, the ratio becomes consistent with the theoret-ical prediction. Similarly, our measured ratios for λ of 26.949 to 25.493 nm, whose average is 0.382 ± 0.055 (Fig. 6 (c)), are marginally consistent with our CR model calculation but larger than the three ADAS calculations, perhaps because theλ26.949-nm line is possibly blended with the Fe XIV 26.9357-nm line. As seen in Fig. 4, the line intensities of λ 26.949 and 26.646 nm increased at
t = 4.8 - 5.0 s, but other lines decreased. These
behav-iors of intensity also suggest contamination of other lines toλ26.949-nm andλ26.646-nm lines. The measured ra-tios forλ26.646-nm to 25.493-nm lines, whose average is 0.202±0.051 (Fig. 6 (b)), are roughly consistent with cal-culated ratios, but the candidate for line blending is the Fe XV 26.6377-nm line. The measured ratios forλof 28.021 to 25.493 nm, whose average is 0.604±0.102 (Fig. 6 (d)), show better agreement with all ADAS calculations than with our CR model calculation. The measured ratios for λof 27.564 to 25.493 nm, whose average is 0.134±0.027, and those forλ28.121-nm to 25.493-nm lines, whose av-erage is 0.202±0.028 show tendencies similar to that of the ratio forλof 28.021 to 25.493 nm in Fig. 6 (d).
These results show that our CR model is marginally consistent with the LHD measurements for the Fe XVII
line ratios. The ADAS calculations with the lgy09 atomic dataset show better agreement with the measurements than ours, except for theλ 26.949-nm line. For constructing a better CR model, the lgy09 atomic dataset is therefore preferred. The reason is that the electron-impact excita-tion rate coefficient is calculated with the R-matrix method, which includes the resonance effect and is better than the distorted wave method in the lower collision-energy re-gion, and many excited levels are considered. This atomic dataset can be obtained from the OPEN-ADAS website at http://open.adas.ac.uk/.
5. Discussion
The LHD measurements of the Fe XVII lines are al-most consistent with the theoretical predictions from our CR model, as described in Sec. 4. However,HinodeEIS measurements still remain inconsistent with the theoreti-cal predictions. For theλ20.468-nm line, Del Zanna and Ishikawa [24] suggested a blend with an unidentified line at 20.472 nm, which showed the same morphology as the Fe VIII line in monochromatic images taken byHinode
EIS. This unidentified line could originate from the transi-tion regions with lower temperatures atTe=4 - 6×10⁵K
(34 - 54 eV). For an active region core and a small flar-ing event on June 2, 2007, Watanabeet al.[35] reanalyzed the intensity ratio forλ20.468-nm and 25.493-nm lines by considering the contribution of the unidentified line orig-inating from the transition region; the intensity ratio was significantly reduced to approximately 1.5 - 1.6. Neverthe-less, the ratio is higher than the theoretical prediction. This inconsistency indicates the need for re-examining the in-flight intensity calibration ofHinodeEIS instruments us-ing two CCDs for the wavelength regions of 17 - 21 nm and 25 - 29 nm [37]. For the other five intensity ratios, the lines were measured with the same CCD and the inconsis-tency cannot be attributed to the intensity calibration of the instruments. The intensity forλof 25.493 nm seems sys-tematically smaller than the theoretical prediction, but it is difficult to explain. In the future, we will need to examine
HinodeEIS measurements in more detail.
6. Summary
to the common upper level, although Warrenet al.[21] re-ported a larger ratio fromHinodeEIS measurements. The agreement of our LHD measurements and theoretical cal-culations for these ratios imply that the atomic data and the CR model are valid to be used for diagnostics. We suggest a preferred atomic dataset to obtain better agreement in the intensity ratios.
Acknowledgments
We acknowledge the LHD experimental group for their assistance. This work is partly supported by the NIFS Collaborative Research Programs (NIFS10KLPF008 and NIFS12KLPF027), the NINS Inter-institute collaborative program for Creation of New Research Area (Head Investi-gator: T. Watanabe), NIFS/NINS under the project of For-mation of International Network for Scientific Collabora-tions (Head Investigator: H. Yamada). The authors would like to thank Enago (www.enago.jp) for the English lan-guage review.
[1] T. Kosugiet al., Solar Phys.243, 3 (2007). [2] J.L. Culhaneet al., Solar Phys.243, 19 (2007). [3] J.A. Klimchuk, Solar Phys.234, 41 (2006). [4] A.K. Dupreeet al.Astrophys. J.299, L101 (1979). [5] T. Katoet al., Astrophys. J.492, 822 (1998). [6] S. Imadaet al., Astrophys. J.742, 70 (2011). [7] G.A. Doscheket al., Astrophys. J.667, L109 (2007). [8] S. Imadaet al., Astrophys. J.705, L208 (2009). [9] N. Yamamotoet al., Astrophys. J.689, 646 (2008). [10] N. Yamamoto et al., J. Phys.: Conf. Ser. 163, 012023
(2009).
[11] T. Watanabeet al., Astrophys. J.692, 1294 (2009). [12] I. Murakamiet al., Plasma Fusion Res.5, S2021 (2010).
[13] H.A. Sakaueet al., J. Appl. Phys.109, 073304 (2011). [14] N. Nakamuraet al., Astrophys. J.739, 17 (2011). [15] I. Skobelevet al., Astron. Astrophys.511, A60 (2010). [16] I. Murakamiet al., accepted to IAEA Atomic and
Plasma-Material Interaction Data for Fusion (2013).
[17] S. Sudo et al, Plasma Phys. Control. Fusion44, 129 (2002). [18] S. Sudo and N. Tamura, Rev. Sci. Instrum. 83, 023503
(2012).
[19] N. Nakamuraet al., Rev. Sci. Instrum.79, 063104 (2008). [20] H.A. Sakaueet al., J. Instrumentation5, C08010 (2010). [21] H.P. Warrenet al., Astrphys. J.685, 1277 (2008).
[22] T. Watanabeet al., 38th COSPER-GA, E25-008-10 (oral presentation) (2010).
[23] G.A. Doschecket al., Phys. Rev. A43, 2565 (1991). [24] G. Del Zanna and Y. Ishikawa, Astron. Astrophys. 508,
1517 (2009).
[25] P. Jönssonet al., Compt. Phys. Commun.177, 597 (2007). [26] P. Jönssonet al., Research Report of the National Institute for Fusion Science, NIFS-DATA-113 (2011); Atomic Data Nucl. Data Tables100, 1 (2014).
[27] A. Bar-Shalonet al., J. Quant. Spect. Rad. Transf.71, 179 (2001).
[28] H.P. Summers, The ADAS User Manual, version 2.6, http://www.adas.ac.uk (2004).
[29] K.P. Dereet al., Astron. Astrophys.498, 915 (2009). [30] S.D. Lochet al., J. Phys. B39, 1 (2006).
[31] G.Y. Liang and N.R. Badnell, Astron. Astrophys.518, A64 (2010).
[32] M.B. Chowduri et al., Rev. Sci. Instrum. 78, 023501 (2007).
[33] C. Donget al., Rev. Sci. Instrum.82, 113102 (2011). [34] A. Kramida et al., URL=http://www.nist.gov/apml/data/
asd.cfm
[35] T. Watanabeet al., Plasma Fusion Res.8, 2501105 (2013). [36] T. Watanabeet al., in preparation (2014).