Energy Efficient Data Collection in WSN by Pattern Variation
Discovery
Mohd Muntjir
Research Scholar OPJS University Churu, Rajasthan, India
Abstract— The WSN is made of "nodes" – from a few to numerous hundreds or even thousands, where each node is connected to one or sometimes several sensors. Each that sensor network node has typically several parts: a radio transceiver with an internal antenna or relation to an external antenna, a microcontroller, an electronic circuit for interfacing with the sensors and an energy basis, generally a battery or an embedded form of energy harvesting. A sensor node might differ in size from that of a creation down to the size of a grain of dust, although functioning "motes" of genuine microscopic dimensions have yet to be created. Cross-layer is becoming an important studying area for wireless communications. Conventional layered technique cannot share different information among different
layers ,, which leads to each layer not having complete information. The Ad hoc On-Demand Distance Vector (AODV) protocol is one of the most popular reactive routing protocols. It is based on demand routing protocol. This protocol enables dynamic, self-starting, multi hop routing among the mobile nodes in the mobile ad hoc networks. Detection of irregularities is tightly interrelated to modeling of sensor data. Therefore, we suggest detecting irregular single-attribute sensor data with respect to time or space by building models.
Keywords- Characteristics of WSN, Platforms, Data Mining, Anomalies Detection, Shoebox, motes, medical applications, clusters, anomalies, power consumption
1.INTRODUCTION TO WSN
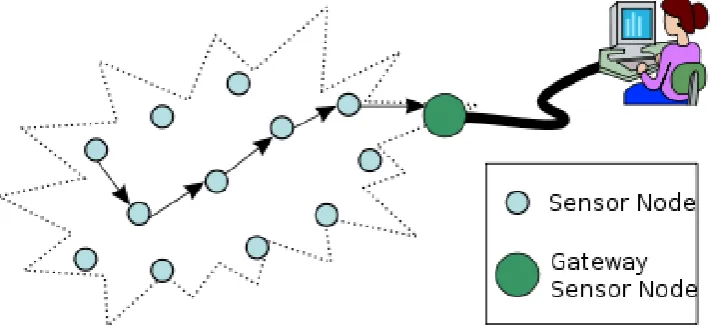
A wireless sensor network (WSN) of spatially distributed autonomous sensors to examine physical or environmental environment, such as temperature, sound, pressure, etc. and to cooperatively surpass their data through the network to a main locality. The more modern networks are bi-directional, also enabling control of sensor activity [1]. A sensor node might vary in size from that of a shoebox down to the size of a grain of dust, although execution "motes" of genuine microscopic dimensions have yet to be created. The cost of sensor nodes is similarly variable, varying from a few to hundreds of dollars, depending on the complexity of the individual sensor nodes. Size and cost restrictions on sensor nodes result in corresponding constraints on resources such as energy, memory, and computational speed and exchanges bandwidth. The topology of the WSNs can vary from a simple star network to an advanced multi-hop wireless mesh network [2].
Fig 1.1: Architecture of wireless sensor network
1.1 Applications
Area monitoring:Area monitoring is a ordinary application of WSNs. In area monitoring, the WSN is deployed over a section where some phenomenon is to be monitored. A military example is the uses of sensors detect
Dr. Vaibhav Bansal Associate Professor - CSE
enemy intrusion; a national example is the geo-fencing of gas or oil pipelines. Area monitoring is most important part.
Health care monitoring:The medical applications can be of two types: outer placed and implanted. Wearable devices are used on the body surface of a human or just at close nearness of the user. The implantable medical devices are those that are inserted inside human body [3].
1.2 Characteristics of Wireless Sensor Network: The main characteristics of a WSN include:
Power consumption constraints for nodes using batteries or power harvesting Ability to cope with node failures
Mobility of nodes Communication failures
Scalability to huge scale of deployment
Ability to withstand harsh environmental conditions Ease of use
Cross-layer design Heterogeneity of nodes
1.3 Platforms: Hardware
One major challenge in a WSN is to produce small cost and tiny sensor nodes. There are an growing number of small companies producing WSN hardware and the commercial situation can be collated to home computing in the 1970s. Many of the nodes are still in the research and development stage, particularly their software. Also intrinsic to sensor network adoption is the use of very low power methods for data acquisition.
Software
Energy is the wanting source of WSN nodes, and it determines the lifetime of WSNs. WSNs are meant to be deployed in large numbers in diverse environments, including remote and hostile regions, where ad hoc communications are a key component [5].
2.DATA MINING
Data mining (the analysis step of the "Knowledge Discovery in Databases" process, or KDD), an interdisciplinary inner field of computer science, is the computational process of discovering patterns in large data sets involving methods at the connection of artificial intelligence, machine learning, statistics, and database systems. The real data-mining task is the automatic or semi-automatic analysis of large quantities of data to extort previously unknown interesting patterns such as groups of data records (cluster analysis), unusual records (abnormality detection) and dependencies (involvement rule mining). This usually involves using database techniques such as spatial indices. These formats can then be seen as a kind of summary of the input data, and may be used in advance analysis or, for example, in machine learning and projecting analytics. For example, the data-mining step might classify multiple groups in the data, which can then be used to achieve more accurate prediction results by a decision support system. Neither, data gathering, data preparation nor result interpretation, and reporting are part of the data-mining step, but do link to the overall KDD process as additional steps [6].
2.1 Process: The Knowledge Discovery in Databases (KDD) process is normally defined with the stages: (1) Selection
(2) Pre-processing (3) Transformation (4) Data Mining
(5) Interpretation/estimation
It exists, however, in many variations on this theme, such as the Cross Industry regular Process for Data Mining (CRISP-DM), which defines six stages?
(1) Business Understanding (2) Data Understanding (3) Data Preparation (4) Modeling (5) Estimate (6) Deployment
3.ANOMALIES DETECTION:
ADS detect any observed activities that deviate from the normal behavior during operation. It does not require any past knowledge of abnormal behavior. It constructs a model of normal features from an observed system and determines a baseline of the standard behavior from the model. Using the model constructed, it can detect novel anomalies by observing any change in the present system behavior. A system will be flagged as abnormal if current observed behaviors deviate from the normal profile based on acceptable threshold value set [7].
4.LITERATURE SURVEY
The research work performed in this area by different researchers is presented as follows:
Miao Zhao et al. [1]suggested that current study reveals that great benefit can be achieved for data gathering in wireless sensor networks by employing mobile collectors that collect data via short-range communications. To pursue maximum energy saving at sensor nodes, intuitively, a mobile collector should navigate the transmission range of each sensor in the field such that each data packet can be straight transmitted to the mobile collector without any relay. However, this approach may lead to significantly improved data gathering latency due to the low moving velocity of the mobile collector. Fortunately, it is observed that data gathering latency can be efficiently shortened by performing proper local aggregation via multihop transmissions and then exchange the aggregated data to the mobile collector. In such a scheme, the number of local transmission hops should not be randomly large as it may increase the energy consumption on packet relays, which would adversely affect the overall competence of mobile data gathering. Based on these observations, in this paper, we study the tradeoff among energy saving and data gathering latency in mobile data gathering by exploring a balance between the relay hop count of local data aggregation and the poignant tour length of the mobile collector. We first propose a polling-based mobile gathering technique and formulate it into an optimization problem, named bounded relay hop mobile data gathering (BRH-MDG). Distinctively, a subset of sensors will be chosen as polling points that buffer locally aggregated data and upload the data to the mobile collector when it comes. In the meanwhile, when sensors are affiliated with these polling points, it is guaranteed that any packet relay is include within a given number of hops. We then give two efficient algorithms for choosing polling points among sensors. The effectiveness of our approach is validated through extensive simulations.
Laxmi Choudhary et al. [2]suggested that With the fast development of computer and information technology in the last many years, an massive amount of data in science and engineering has been and will continuously be generated in massive scale, either being stored in enormous storage devices or flowing into and out of the system in the form of data streams. Besides, such data has been made widely available, e.g., via the Internet. Such tremendous amount of data, in the order of tera-in peta-bytes, has fundamentally changed science and engineering, transforming many disciplines from poor to progressively rich, and calling for new, data-intensive methods to conduct research in science and engineering. In this paper, author discuss the research challenges in science and engineering, from the data mining perspective, with a focus on the following reasons: (1) information network analysis, (2) discovery, usage, and understanding of patterns and knowledge, (3) rivulet data mining, (4) mining moving object data, RFID data, and data from sensor networks, (5) multimedia data mining and spatiotemporal (6) Web, mining text, and other unstructured data, (7) data cube-oriented multidimensional online logical mining, (8) visual data mining, and (9) data mining by integration of complicated scientific and engineering domain knowledge.
Khushboo Sharma et al. [3]suggested that Advances in wireless technologies have lead to the development of sensor nodes that are capable of sensing, processing, and transmitting. They collect large amounts of sensor data in a vastly decentralized manner. Classification is an important task in data mining. In this paper a Nearest Neighbor organization technique is used to classify the Wireless Sensor Network data. Our experimental investigation yields a important output in terms of the correctly classified success rate being 92.3%.
Neelamadhab Padhy et al. [5]suggested that In this paper author have focused a variety of techniques, approaches and various areas of the research which are helpful and marked as the important field of data mining Technologies. As we are awake that many MNC’s and large organizations are operated in different places of the different countries. Each place of operation may produce large volumes of data. Corporate decision makers require access from all such sources and take planned decisions .The data warehouse is used in the significant business value by improving the effectiveness of managerial decision-making. In a uncertain and highly competitive business environment, the value of strategic information systems such as these are easily renowned however in today’s business environment, efficiency or speed is not the only key for competitiveness. This type of vast amount of data’s is available in the form of tera- to peta-bytes, which has radically changed in the areas of science and engineering. To analyze, manage and make a decision of such type of vast amount of data we need techniques called the data mining, which will transform in many fields. This paper imparts extra number of applications of the data mining and also o focuses scope of the data mining, which will helpful in the further research.
R. Sivaranjini et al.[6 Nowadays Wireless sensor networks playing vital role in all area. Which is used to intellect the environmental monitoring, temperature, Soil erosion etc? Low data delivery efficiency and high-energy utilization are the inherent problems in Wireless Sensor Networks. Finding accurate data is more difficult and also it will leads to more exclusive to collect all sensor readings. Clustering and prediction techniques, which exploit spatial and temporal connection among the sensor data, provide opportunities for reducing the energy utilization of continuous sensor data collection and to achieve network energy competence and stability. So as we propose Dynamic scheme for energy utilization and data collection in wireless sensor networks by integrating adaptively enabling/disabling prediction scheme, sleep/awake method with vibrant scheme. Our framework is clustering based. A cluster head represents all sensor nodes within the section and collects data values from them. Our framework is general enough to incorporate many advanced features and author show how sleep/awake scheduling can be useful, which takes our framework approach to designing a practical dynamic algorithm for data aggregation, it ignore the need for rampant node-to-node propagation of aggregates, but rather it uses faster and more proficient cluster-to-cluster propagation. To the best of our knowledge, this is the first work adaptively enabling/disabling forecast scheme with dynamic scheme for clustering-based continuous data collection in sensor networks. When a cluster node crashes because of energy reduction we need to choose alternative cluster head for that particular section. It will help to achieve less energy consumption. Our proposed models, analysis, and framework are validated via simulation and evaluation with Static Cluster method in order to achieve better energy efficiency.
M. Mehdi Afsar et al.[7] Energy preservation is one of the most important challenges in wireless sensor networks. In most applications, sensor networks contains of hundreds or thousands nodes that are dispersed in a wide field. Hierarchical architectures and data aggregation methods are gradually more gaining more popularity in such large-scale networks. In this paper, author suggests a novel adaptive Energy-Efficient Multi-layered Architecture (EEMA) protocol for large-scale sensor networks, wherein both hierarchical construction and data aggregation are efficiently utilized. EEMA divides the network into some layers as well as every layer into some clusters, where the data are gathered in the first layer and are iteratively aggregated in upper layers to reach the base station. Many criteria are wisely employed to elect head nodes, including the residual power, centrality, and proximity to bottom-layer heads. The routing delay is mathematically analyzed. Performance valuation is performed via simulations, which confirms the effectiveness of the projected EEMA protocol in terms of the network lifetime and reduced routing delay.
Er. Vickey Sharma et al.[8] WSN contains of spatially distributed autonomous sensors used to monitor physical or environmental conditions, such as sound, pressure, temperature etc. and to generally pass their data through the network to a primary location. The advancement of wireless sensor networks was aggravated by military applications such as battlefield surveillance; now such networks are used in many industrial applications and consumer applications, such as machine health observing, industrial process noticing and control, and so on. Sensor nodes are competent of sensing and transmitting. They collect huge amount of data in a vastly decentralized manner. The data collected contain all the information about the region. But sometimes users need only the precise information and for them rest of the information is treated as irrelevant. So here filter out that inappropriate data for the benefit of the users.
5.PROPOSED WORK
5.1 Problem Formulation
sensory attributes on all the nodes are irregular. Detection of irregularities is tightly interrelated to modeling of sensor data. Therefore, we propose to detect asymmetrical single-attribute sensor data with respect to time or space by building models.
5.2 Proposed Work
A new approach named proposed AODV (pattern variation discovery) is used to solve this problem. Our approach works in the following four steps:
1. Selection of a reference frame. This frame consists of the directions along which we want to look for irregularities between multiple sensory attributes. An analyst can explicitly indicate the reference frame. It is also possible to discover the reference frame that results in a lot of irregularities.
2. Definition of normal patterns. This definition can be models of multiple sensory attributes or constraints among multiple attributes.
3. Detection of irregularity. Whenever a normal pattern is broken at some point along the reference frame, irregularity appears. That is, the pattern variation happens.
6.RESULTS AND ANALYSIS
6.1 Evaluation of Simulation
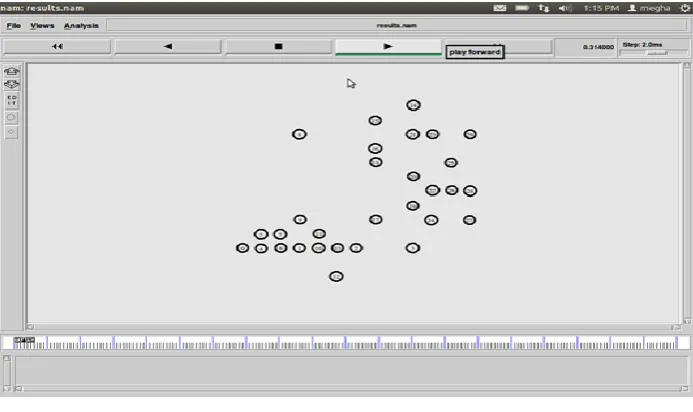
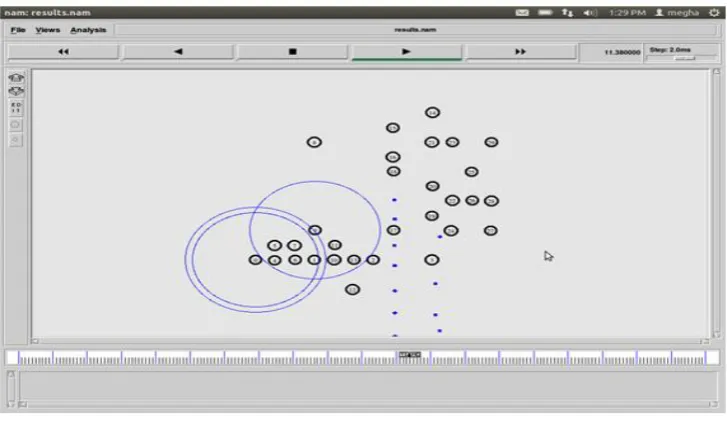
In the scenario we take network of 30 Nodes & Detect or Filter out the Anomalies or Irregularities when we look at the animation of the simulation, applying NAM. The output can be analyzed by observing the screenshots of the NS2 network simulator
Fig 6.2 Creation of different nodes
Fig 6.3 Creation of 30 Nodes
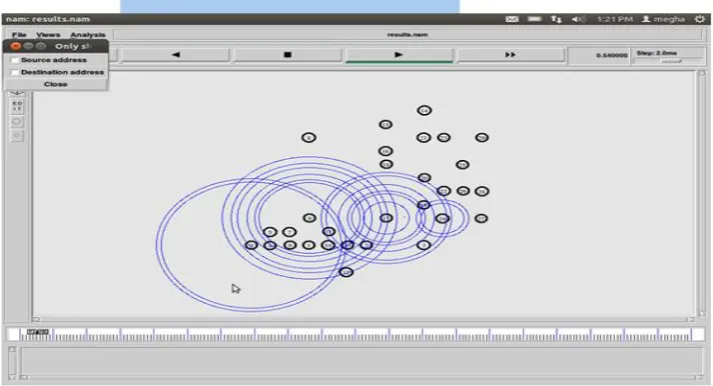
Fig 6.5 Zones between the nodes
Fig 6.6 Transmission between the nodes
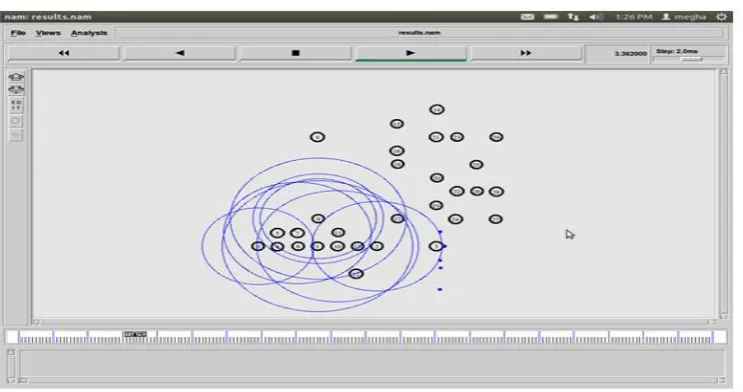
Fig 6.8 Nodes showing Transmission on different way
Fig 6.9 Packet drop between the nodes
Fig 6.11 Packet drop between the nodes on different root
Fig 6.12 Packet drop between the nodes
We have taken total of thirty nodes in our simulation valuation process as shown in the figure 5.1 to figure 5.12 above. In the above figures it is being observed that in the starting of simulation process we have network with Thirty nodes, packets are transmitted from one node to other node, As soon the packets with anomalies or irregularities are detected, They are dropped in the form of Droppings. As the Anomalies are detected, Energy consumption by network is less, which increases the efficiency of Wireless Sensor Networks.
Parameters analyzed in thirty nodes network with two different scenarios with respect to time:
1. Packets with Anomalies
2. Packets without Anomalies
3. Energy Consumption with Anomalies
4. Energy Consumption without Anomalies
5.2 Graphical Results:
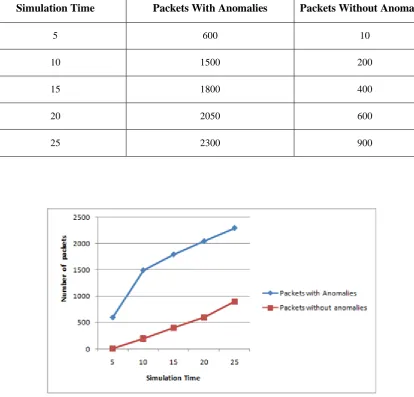
1. Scenario One (For simulation time=25 sec):
TABLE 6.1:TABLE SHOWING VALUES OF PACKETS WITH AND WITHOUT ANOMALIES FOR SIMULATION TIME=25SEC
Fig 6.13: Graph showing packets with anomalies and without anomalies for simulation time=25 sec
2: Energy Consumption with & without Anomalies
Table 6.2: Table showing values of energy with and without anomalies for simulation time=25 sec
Simulation Time
Packets With Anomalies
Packets Without Anomalies
5 600 10
10 1500 200
15 1800 400
20 2050 600
25 2300 900
Simulation Time
Energy With Anomalies
Energy Without Anomalies
5 125 25
10 260 90
15 340 160
20 440 240
Fig 6.14: Graph showing energy with anomalies and without anomalies for simulation time=25 sec
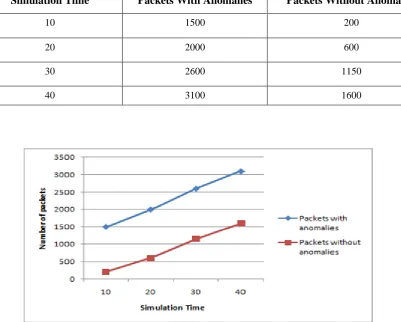
2. Scenario Two (For simulation time =40):
1: Packets with & without Anomalies
TABLE 6.3:TABLE SHOWING VALUES OF PACKETS WITH AND WITHOUT ANOMALIES FOR SIMULATION TIME=40 SEC
Fig 6.15: Graph showing packets with anomalies and without anomalies for simulation time=40 sec
Simulation Time
Packets With Anomalies
Packets Without Anomalies
10 1500 200
20 2000 600
30 2600 1150
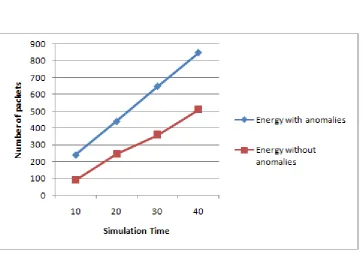
2: Energy Consumption with & without Anomalies
TABLE 6.4:TABLE SHOWING VALUES OF PACKETS WITH AND WITHOUT ANOMALIES FOR SIMULATION TIME=40 SEC
Fig 6.16: Graph showing energy with anomalies and without anomalies for simulation time=40 sec
7.CONCLUSION AND FUTURE SCOPE
Sensor nodes are competent of sensing and transmitting. They collect huge amount of data in a highly decentralized mode. The data collected consists of all the information about the region. But sometimes users need only the specific information and for users remaining information is handled as immaterial. So, here we filter out that irrelevant data for the benefit of the users. In future, it can be used to extract the desired information from the set of large information. AODV is being compared the proposed AODV. Proposed AODV has better performance as filtering out the unnecessary data is increasing efficiency of the system. I compared proposed AODV with existing AODV protocol at different simulation time after that the result shows that the packets with anomalies are being filtered out using the data-mining concept. And the proposed AODV is more energy efficient than the existing AODV. For getting the best results I have added the filtering concept. Future aspects for the proposed system are bright. We can use the concept of clustering for filtering out the data with anomalies. Other mining concepts are also available.
Simulation Time
Energy With Anomalies
Energy Without Anomalies
10 240 90
20 440 245
30 650 360
ACKNOWLEDGMENT
I would like to gratefully and sincerely thank to The Dean of our College, Chairman of our Department for his guidance, understanding, patience, and most importantly, his friendly nature during this research paper.
I would also like to thank my friends and colleagues, my supervisor and the university who provided me an efficient support to work on this atmosphere and good infrastructure. I would also like to thank to all the previous researchers who worked very hard and helped others to comprehend the subject of Wireless Sensor Networks System.
REFERENCES
[1] Miao Zhao, Member, IEEE, and Yuanyuan Yang, Fellow, IEEE “Bounded Relay Hop Mobile Data Gathering in Wireless Sensor Networks” IEEE TRANSACTIONS ON COMPUTERS, VOL. 61, NO. 2, FEBRUARY 2012. [2] Laxmi Choudhary, Banasthali University, Jaipur “ CHALLENGES FOR DATA MINING” IJREAS Volume 2, Issue 2
(February 2012) ISSN: 2249-3905.
[3] JANG-PING SHEU, KUN-YING HSIEH+ AND PO-WEN CHENG+ Department of Computer Science National Tsing Hua University Hsinchu, 300 Taiwan ,+Department of Computer Science and Information Engineering National Central University Chungli , 320 Taiwan “Design and Implementation of Mobile Robot for Nodes Replacement in Wireless Sensor Networks” JOURNAL OF INFORMATION SCIENCE AND ENGINEERING 24, 393-410 (2008). [4] Rouhollah Maghsoudi, Somayye Hoseini, Yaghub Heidari, Department of Computer, Nour Branch, Islamic Azad
University, Nour, Iran Payame Noor University of Shahrerey ,Tehran, Iran, [email protected] Department of Electrical, Nour Branch, Islamic Azad University, Nour, Iran, “ Surveying Robot Routing Algorithms with Data Mining Approach” The Journal of Mathematics and Computer Science Vol .2 No.2 (2011) 284-294.
[5] R. Shah, S. Roy, S. Jain, and W. Brunette, “Data MULEs: Modelling a Three-Tier Architecture for Sparse Sensor Networks,” Elsevier AdHoc Networks J., vol. 1, pp. 215-233, Sept. 2003
[6] R.Sivaranjini, E.Dinesh,” An Adaptive scheme for energy consumption and data collection in Wireless Sensor Networks”, Volume 2 Issue 3 ǁ March. 2013 ,PP.50-55