1)Princeton Plasma Physics Laboratory, Princeton, New Jersey, U.S.A 2)University of California at Davis, Dept. of Applied Science, Davis, California, U.S.A
3)Forschungszentrum J¨ulich, Institut f¨ur Plasmaphysik, Association EURATOM-FZJ, Partner in the Trilateral Euregio
Cluster, D-52425 J¨ulich,Germany
(Received 1 December 2006/Accepted 3 March 2007)
The detection and control of instabilities in a tokamak is one of the exciting challenges in fusion research on the way to a reactor. Thanks to a combination of an innovative 2D temperature imaging technique (ECEI), a versatile ECRH/ECCD system and a unique possibility to externally induce tearing modes in the plasma, TEX-TOR is able to make pioneering contributions in this field. This paper focuses on two meso-scale phenomena in tokamaks: m= 2 tearing modes and magnetic structures in the stochastic boundary. In these cases the 2D-ECEI diagnostic can resolve features not attainable before. In addition the possibility to use the diagnostic for fluctuation measurements is addressed.
c
2007 The Japan Society of Plasma Science and Nuclear Fusion Research
Keywords: Electron cyclotron emission, plasma diagnostic, imaging, magnetic island, fluctuations, suppression, stochastic fields, electron cyclotron heating, tearing mode
DOI: 10.1585/pfr.2.S1031
1. Introduction
The control of MHD structures is one of the chal-lenges in fusion research: the suppression of neoclassical tearing modes by electron cyclotron current drive (ECCD) to operate the reactor close to its stability limit or the miti-gation of ELMs by ergodisation of the plasma edge [1] are just two major examples showing the importance of this field.
On TEXTOR a coherent programme is executed around this theme, based on three pillars: an innovative 2D electron cyclotron emission imaging (ECEI) diagnos-tic to image the MHD structures, a versatile ECRH/ECCD system to manipulate these and finally a set of perturbation coils to induce such structures.
The potential for an ECEI diagnostic has been demon-strated by investigating the sawtooth crash [2]. This paper will concentrate on three different aspects: i) control of the
m=2 tearing mode; ii) visualization of the magnetic struc-tures induced in the plasma edge by the perturbation coils; and iii) temperature fluctuation patterns. Before focusing on the details of these studies a short overview of the ECEI system is at its place, together with some remarks on TEX-TOR and the used hardware.
author’s e-mail: [email protected]
2. The Experimental Tools
Although TEXTOR is a limiter tokamak with a circu-lar cross-section (major/minor radius R0, a=1.75, 0.46 m,
and typically Ip =350 kA, Bt =2.25 T), some of its tools
are completely unique, allowing for an exciting research programme. The relevant ones here are the ECEI system and the dynamic ergodic divertor, DED.
2.1
Electron cyclotron emission
Imaging-ECEI
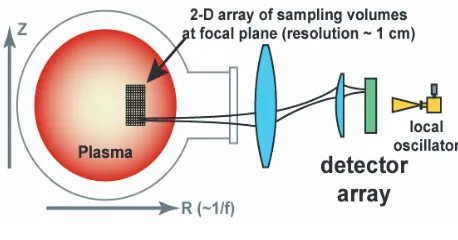
The 2D-ECEI [3] consists of a 16 element vertical ar-ray of heterodyne receivers, which, combined with wide aperture optics, can image a vertical slice of approximately 16 cm in the plasma. Since each receiver element is treated as a conventional second harmonic X mode ECE radiome-ter with 8 frequency channels, corresponding to a radial coverage of about 7 cm. The system in total can image an area of 16×7 cm2on an array of 16×8 sampling volumes,
centered around the mid-plane, see Fig. 1. The radial loca-tion can be shifted by either changing the local oscillator frequency (tunable from 85 to 130 GHz) or by varying the magnetic field. The resolution amounts to 2 cm in the ver-tical direction as limited by the optics and 1 cm radially. The time resolution is up to 500 kHz.
2.2
Dynamic Ergodic Divertor
The Dynamic Ergodic Divertor (DED) on TEXTOR consist of a set of 16 helical perturbation coils on the high
c
2007 The Japan Society of Plasma
Fig. 1 Sketch of the ECE-I system, consisting of an 16×8 array of sampling volumes in the plasma.
field side, with a helicity aligned with the q = 3 field lines [4]. The DED can be operated DC and AC up to 10 kHz. It can be used to generate a perturbation field with a dominant 12/4, 6/2, or 3/1 mode structure. When oper-ated in its 3/1 mode it possesses a strong 2/1 side band, which, above a certain threshold, triggers an m=2, n=1 tearing mode. In the experiments reported here 1 kHz AC currents are used, resulting in a 1 kHz toroidal rotation for the m/n=2/1 island.
Operation of the DED in the 12/4 mode will mainly disturb the plasma edge. In that case, the plasma edge consists of an ergodic region, arising from the overlap of neighbouring island chains at resonant surfaces (q=10/4, 11/4, · · ·). Close to the edge, open field lines with a very short wall-to-wall connection length arise, the lami-nar zone. The result is a complicated magnetic structure. In particular, long thin ergodic ‘fingers’ surrounded by lami-nar regions, connect the ergodic region with the wall.
3. Suppression of m
/
n
=
2
/
1 Tearing
Modes
Tearing modes can be induced externally at TEXTOR by the DED, allowing detailed investigations in the tearing mode physics. Here, we concentrate on the suppression of these modes. This can be done in well defined experimen-tal conditions: the perturbation amplitude can be externally governed, the rotation of the perturbation field and the ro-tation of the plasma can be independently controlled and finally the gyrotron is able to deposit locally its power in-side the island or drive current in the island. The excitation of the mode depends on the strength of the perturbation current, the relative rotation between the perturbing field and the plasma, on density and beta [5].
Once the mode is excited the ECRH/ECCD sys-tem (140 GHz, 800 kW, CW or modulated, poloidal and toroidal movable launcher [6]) can be applied to test the scenarios for island suppression. Various systematic scans of the mode suppression ratio have been performed, in or-der to compare (i) ECRH with ECCD, (ii) CW heating with pulsed heating at various duty cycles and (iii) the diff er-ence between heating in the X- and O-points of the island.
Fig. 2 Poloidal reconstructions of the island, showing the time evolution during the suppression process: a) flat island b) heated island c) suppressed island. The color coding goes from dark (cold) to light (hot).
Strongest suppression is found when pulsed ECRH is ap-plied within the O-point of the island [7].
To interpret the physics mechanism at work in sup-pressing the island, quantitative information on the evolu-tion of the temperature is required. To visualize the ECEI data in an easily interpretable way, a poloidal reconstruc-tion is used in which the data for one full rotareconstruc-tion period are mapped onto a poloidal shell, assuming rigid plasma rotation. Note that this reconstruction only represents the low field side structure of the island. Figure 2 shows the reconstruction of the island during the three main stages of the suppression process [8]. The first stage is the sit-uation in which the island has been generated and has reached a saturated width of about 12 cm, before ECRH was switched on. In this phase, the Te profile inside the
island is still flat. The hot, central plasma, approximately elliptically deformed by the island, is clearly visible. The second reconstruction, shortly (about 10 ms) after switch on of ECRH, shows a peaked Te profile inside the island.
The third stage is the steady state situation long (more than 100 ms) after switch on of ECRH. The island is now sup-pressed to about half the initial size and the central plasma is less deformed and the peaked temperature region inside the island is narrower.
An automatic algorithm is used to extract the main is-land parameters, its width and amplitude, from the ECEI data. The time evolution of these parameters is given in Figure 3. Knowing the Teprofile and the power deposited
inside the island, the diffusivityχein the island can directly
be calculated from simple power balance calculations. It turns out thatχeis 1-1.5 m2/s, close to the value found for
the ambient plasma, which amounts to 1 m2/s [8].
resistiv-Fig. 3 Typical evolutions of the temperature peaking inside the island (a) and the island width w (b) after switching on and offof ECRH, in case of island excitation by the DED. Note that the dashed line is the calculated result for the ECRH term according to eq. 1, in good agreement with the data.
ity allows for an enhancement of the induced current inside the island). The mathematical expression for this modified Rutherford equation then looks like:
0.82τrdw
dt =r
2
s∆+MDED−MECRH (1) whereτris the current diffusion time, w the island width,
and rs the resonant surface. The DED term (MDED = 2mrs(wvac/w)2); wvacbeing the vacuum island width, about 4 cm for this case) is fully known and the ECRH term can be evaluated numerically using the measured Tedata
in-side the island. Finally the∆’ term can be estimated from the balance in the saturated state. Thus this TEXTOR ex-periment is unique in the sense that it can separate single terms in the Rutherford equation. The dashed line in Fig. 3 represents the theoretical expectation from the right hand side of Eq.1 (the MECRH term), and is in good agreement
with the experimental data.
The stabilizing effect of heating on the island evolu-tion can thus be calculated, and it appears to be the domi-nating effect in these experiments. Heating may well play a role in Neoclassical Tearing Mode (NTM) stabilization in ITER as well and, consequently, result in lower power requirements for this in ITER [8].
4. Structures in the Ergodic Edge
Another area where ECEI provided valuable informa-tion is in imaging edge structures induced by the DED in the 12/4 mode. In Fig. 4a-d ECEI measurements at the low field side (LFS) plasma edge during a shot with DC DED are presented. During this phase of the shot the plasma cur-rent was ramped down from Ip =390-365 kA. The data is
normalized to the temperature profile just before switching on the DED, and hence reflects the relative change during DED operation. With DED, the temperature drops over the entire observation volume of ECEI, which is a clear sign of an enhanced transport level. The measurements also show structures that evolve with the changing plasma current.
Fig. 4 Comparison of ECEI temperature measurements with At-las calculations [9] of the connection length (laminar plots) during a plasma current ramp. The hotter region is indicated by the arrows.
Due to the changing q profile the DED induced structures are expected to evolve. Figures 4e-h give the correspond-ing ‘laminar plots’, as calculated with the Atlas code [9]. A laminar plot is a contour plot of the wall-to-wall con-nection length in units of poloidal turns. The laminar zone consists mostly of the 1 and 2 poloidal turn field lines. The field lines with connection length longer than 4 poloidal turns belong to the ergodic region. The black contour indi-cates the observation area of ECEI. Fig. 4e-h show the in-ward migration of a structure of ergodic plasma, as corrob-orated by the (relative) ‘hot’ temperature region observed in the ECEI data (denoted by arrows in Fig. 4).
Fig. 5 Comparison of Te profiles during DED with non-DED
reference.
heat transport during DED [10]:
∇Te,non−DED
∇Te,DED ≈ χer
χ⊥ (2)
Whereχ⊥is the perpendicular diffusion coefficient in the unperturbed case andχeris the effective heat diffusion coefficient in the perturbed magnetic field. Fig. 5c indicates a significant transport enhancement in the plasma regions where the laminar zone is expected. In the ergodic region (for example in the ‘hot spot’) transport levels are close to the unperturbed values.
5. Fluctuations
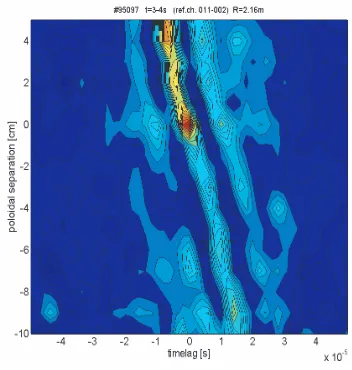
The final example of the capabilities of the ECEI sys-tem is fluctuations. Previously reported measurements with the TEXTOR O-mode reflectometer [11] have shown den-sity fluctuations near the plasma edge, the quasi-coherent mode. This mode provides a test bed for the ECEI system. The cross correlation function of two ECE channels indicates a clear 90 kHz oscillation around zero time lag. A bandwidth of around 50 kHz can be derived from the corre-lation function, in agreement with reflectometer measure-ments at the same radius. The contour plot in Fig. 6 shows the cross correlation function as a function of poloidal channel separation∆s. From the phase shift as a function of∆s, a poloidal velocity of about 6 km/s can be deduced. The poloidal wavelength can be estimated to be around 7 cm (λpol =vpol/f ), from which a poloidal mode number
around m=40 is found.
The fluctuation amplitude however is affected by the optical thickness τ, which is low (τ is about 1.5) at the
Fig. 6 Cross correlation spectrum for the poloidal evolution of ECEI fluctuation measurements of the quasi coherent mode.
outboard side of the observation volume, rapidly increas-ing towards the plasma centre. Hence, in fact a mixture of density and temperature fluctuations is measured. The den-sity fluctuation amplitude however is known from reflec-tometer data [11], so the density contribution to the mea-sured radiation temperature fluctuations can be estimated and corrected for, just as for the optical thickness. This has been done and the temperature fluctuation amplitude amounts to be about 1% near the edge, decaying more in-ward, falling below the detection limit of 0.1 % after 6 cm. From these investigations one can conclude that a) ECEI is able to measure the fluctuations down to a level of 0.1% and b) the quasi-coherent mode exhibits apart from density also temperature fluctuations.
6. Conclusion
In this paper the powerful capability of the high res-olution 2D Teimaging data from the ECEI diagnostic has
been demonstrated in three examples, where the ECEI data were crucial for the interpretation and understanding of the physics mechanisms at play: i) the dominant effect of heat-ing inside the island in the suppression of the m=2 tearing mode; ii) the verification of structures induced by the DED in the plasma edge and iii) temperature fluctuation in quasi coherent modes.
Acknowledgments
This work, supported by the European Commu-nities under the contract of Association between EU-RATOM/FOM, was carried out within the framework of the European Fusion Program with the ECEI system de-veloped under US DOE funding. The views and opinions
(2006).
![Fig. 4Comparison of ECEI temperature measurements with At-las calculations [9] of the connection length (laminarplots) during a plasma current ramp](https://thumb-us.123doks.com/thumbv2/123dok_us/8447031.1703604/3.595.324.531.66.358/comparison-temperature-measurements-calculations-connection-length-laminarplots-current.webp)