Hybrid
Algorithms
of
Whale
optimization
algorithm
and
k-nearest
neighbor
to
Predict
the
liver
disease
Vahid
Hajihashemi
1,
Zeinab
Hassani
2,*,
Iman
Sahraei
Dehmajnoonie
3,
Keivan
Borna
41Student Member, IEEE
2Faculty of computer science, Kosar University of Bojnord, Iran 3Science and Research Branch, Islamic Azad University, Kerman, Iran
4Faculty of Mathematics and Computer Science, Kharazmi University, Tehran, Iran
Abstract
Liver Disease is one of the most common diseases which can be prevented by early diagnosis and up-to-date treatment. Advances in machine learning and intelligence techniques have led to the effective diagnosis and prediction of diseases to improve the treatment of patients and reduce the cost of treatment. Whale Optimization Algorithm is a swarm intelligent technique, inspired by the social behavior of whales. One of the effective classification algorithms is K-Nearest Neighbor which is employed for pattern recognition. This paper was designed to investigate the prediction of Liver Disease using a hybrid algorithm including KNN and WOA. In order to evaluate the efficiency of hybrid algorithm, two datasets of liver disease including BUPA and ILPD were used. The results showed that 81.24% and 91.28% of accuracy was gained by the proposed algorithm for BUPA and ILPD, respectively. Experimental results showed that the hybrid WON-KNN is a better classifier to predict the liver diseases
Received on 01 December 2018; accepted on 15 December 2018; published on 18 March 2019
Keywords: Whale Optimization Algorithm, K-Nearest Neighbor Algorithm, Liver Disease, Medical data, Evolutionary algorithm.
Copyright © 2019 Vahid Hajihashemi etal., licensed to EAI. This is an open access article distributed under the terms of the Creative Commons Attribution license (http://creativecommons.org/licenses/by/3.0/), which permits unlimited use, distribution and reproduction in any medium so long as the original work is properly cited.
doi:10.4108/eai.13-7-2018.156838
1. Introduction
The liver is the largest gland of body and one of the most important organs in the body. It also is the largest organ in body accounting for about 4% of body weight and a blood flow of 1.5 liters per minute. Furthermore, human’s liver is placed in the upper right quadrant of the abdomen, below the diaphragm. Liver is involved effectively in many functions such as metabolism, regulation of glycogen storage, decomposition of red blood cells and hormone generation. In addition, liver produces the main substance of blood plasma called albumin. There are several main causes such as alcohol, viral hepatitis and obesity affecting more people day by day. The liver is also exposed to many diseases such as hepatitis, fatty liver, cancer, drug damage
∗Corresponding author. Email:[email protected]
and over-sampling balancing techniques and found that random forest algorithm showed better results in over-sampling balancing technique [6]. Vijayarani et al. (2015) studied on liver disease prediction using Nave Bayes and support vector machine (SVM) algorithms on the ILPD dataset. In their study, the results showed that 55% and 76 % of accuracy was obtained by two mentioned algorithms for the ILPD dataset respectively [7]. Olaniyi et al studied on the BUPD dataset using BPNN recursive neural network and radial function. The results showed that a recognition rate of 63 % and 70 % was obtained by BPNN and RBFN neural network, respectively [8]. The rest of this paper is organized as follows: section II is concerned with the material and methods, section III provides explanation on WOA-KNN algorithm, section IV discusses about the results of the evaluation, and section V presents the conclusion.
2. METHODS AND MATERIAL
2.1. Layout K-Nearest Neighbor algorithm
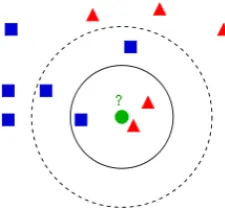
K-Nearest neighbor (KNN) is a one of nonparametric classification techniques and it is able to process the information with continuous features. It also known as case-based argument and is used in many applications such as pattern recognition, statistical estimation. By this technique, classification is obtained by identifying the closest neighbor in order to determine the class of an unknown instance and it is used rather than other preferred classification algorithms due to its high convergence rate and simplicity of preference [3]. KNN is one of the best learning algorithms. The algorithm process is such that a sample x of a testing dataset is compared with all educational samples in terms of Euclidian distance. Among educational samples calculated, k samples with less distance to sample X are chosen as neighbors of sample x and finally, sample x belongs to the class having the greatest votes for the number of nearest neighbors (Fig. 1) [2].
Figure 1. Fig. 1. KNN classification. The new sample(green
circle) might be classified either into the first class,(blue squares) or to the second class(red triangle(
2.2. Whale Optimization Algorithm
Mirjalili et al. introduced the Whale Optimization Algorithm (WOA) which simulates the social behavior of humpback whales [9]. The algorithm is inspired by the hunting strategy of whales. Humpback whales hunt krill or small fish folk by creating specific bubbles along a circle shape path. This behavior is modeled in two steps. The first step includes encircling a prey and spiral bubble-net attacking method, and the second step includes Search for Prey that is known as exploration phase of the algorithm. Mathematical model of WOA is as follows:
(i) Encircling prey: whales are able to identify the position of the prey and in next step they try to encircle it. When the best search agent is found, other search agents update their positions based on the best search agent. This manner is represented by the following equations:
X(t+ 1) =X∗(t)A.D (1)
D =|C.X∗(t)−X(t)| (2)
X∗ represents the position of the best solution obtained so far,Xrepresents the location,tshows the current iteration. A and C represent the coefficient vectors. Arepresents a random value in the range [a, a] and C represents a coefficient as follows:
A= 2.a.r−a (3)
C= 2.r (4)
The a parameter is reduced from 2 to 0.
(ii) Bubble-net attacking method: This phase includes the act of shrinking the encircling and spiral updating position approach. Whales move around the prey through two paths simultaneously. Two paths consist of a shrinking circle along with a spiral-shaped path. This behavior is simulated with 50% of probability in order to select between two paths to update the position of whales as follows:
X(t+ 1) =
{
X∗(t)−A.D ifp <0.5
D′.ebl.cos(2.π.l) +X∗(t) ifp >= 0.5 (5)
is shown in the following:
X(t+ 1) =Xrand−A.D (6)
D=|C.Xrand−X(t)| (7)
2.3. Dataset
The research data in this paper was provided from two main sources: BUPA (Medical research limited, India) [10] and ILPD [11]. The first dataset, BUPA, is made up of 6 blood test attributes collected from men and, it includes information on 345 patients with liver diseases. The second dataset, ILPD, contains of information on 538 patients with liver diseases and as well as 10 blood test attributes collected from men. The table 1 and 2 show the characteristics of two datasets.
Table 1. The attributes of liver patients in ILPD datasets
no Attributes
1 Age
2 Gender
3 DB Direct Bilirubin
4 Sgot Aspartate Aminotransferase 5 A/G Ratio Albumin and Globulin Ratio 6 Sgpt Alamine Amino transferase
7 TB Total Bilirubin
8 TP Total Protiens
9 ALB Albumin
10 Alkphos
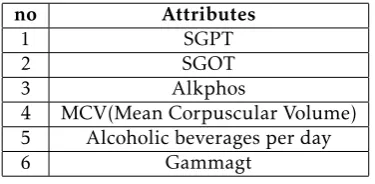
Table 2. The attributes of liver patients in BUPA datasets
no Attributes
1 SGPT
2 SGOT
3 Alkphos
4 MCV(Mean Corpuscular Volume) 5 Alcoholic beverages per day
6 Gammagt
2.4. Pre-processing
In this paper, in order to achieve the best performance by the classifier, attributes values were transformed into homogenous values to create numerical stability [8].Therefore, attributes values were obtained ranging between -1 and 1. The process is called the normaliza-tion. The normalization formula is as follows:
X= (x−xMIN)/(xMAX−xMIN) (8)
Where xMIN and xMAX are the smallest and largest values for each feature, thus the normalization is
to improve the performance of the results. Then, data is balanced by oversampling method. It is quite conspicuous that balanced data is used in classification algorithms. Therefore, if the classification of unbalanced data is not carried out correctly, the classification tends to move toward samples with larger teaching class, which increases the error for identifying a minority class. In this paper, over-sampling method was used to balance the data. Therefore, the data was obtained by over-sampling method along with those obtained by copying and adding random samples from minority class [12]. Finally, MATLAB software was selected to be used as the measurement tool in the current study.
2.5. Indicators for evaluation of models
In order to assess the performance of the proposed algorithm using the datasets, some indicators were used including a mighty evaluation tool which is called confusion matrix. The indicators such as accuracy, precision, sensitivity and specificity were used to evaluate the performance of the proposed algorithm [13]. This behavior is represented by the following equations:
Accuarcy= (T P +T N)/(T P +T N+FP +FN) (9)
Sensitivity=T P /(T P +FN) (10)
Specif icity=T N /(T N+FP) (11)
P ercision=T P /(T P +FP) (12)
Where TP and FP represent the number of true-positive and false-true-positive, respectively, and TN and FN represent the number of true-negative and false-negative, respectively.
3. The WOA-KNN algorithm
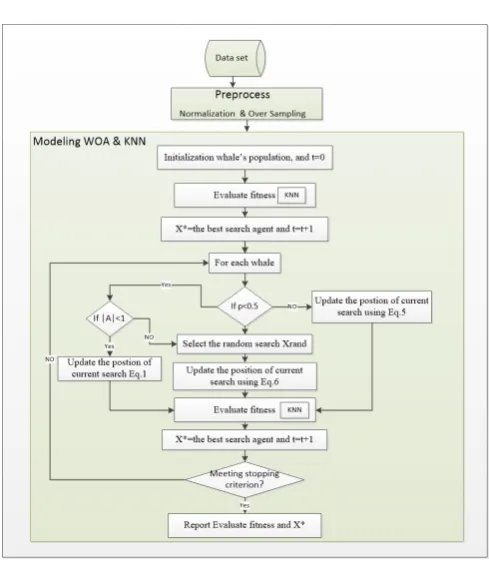
The main purpose of this paper was to propose a method for prediction of liver disease using the Whale Optimization Algorithm and k-nearest Neighbor and based on a 10- fold cross validation model, divided into educational and test data. Fig. 2 presents flowchart for WOA-KNN hybrid algorithm and its pseudo code in the following:
4. EXPERIMENTAL RESULTS
Algorithm 1Hybrid WOA and KNN
Input:Datasets (BUPA, ILPD), Maximum number of iterations(maxIterations), and Number of Wales (n) Output:The best solution and the best search agent.
1: Preprocessing (BUPA, ILPD)
2: Initialize the whales populationXi(i= 1,2, ..., n) 3: Calculate the fitness of each search agent byKNN 4: X*=the best search agent
5: while(t < maxIterations)do 6: foreach search agentdo 7: Updatea, A, C, l, andp 8: ifp <0.5then
9: if|A|<1then
10: Update the position of the current
search agent by the Eq.1 11: elseIf|A|>= 1
12: Select a random search agent (Xrand)
13: Update the position of the current
search agent by the Eq.6
14: end if
15: elseIfp >= 0.5
16: Update the position of the current search by the Eq.5
17: end if 18: end for
19: Check if any search agent goes beyond the search space and amend it
20: Calculate the fitness of each search agent by KNN
21: UpdateX∗if there is a better solution 22: t=t+ 1;
23: end while 24: returnX∗
sensitivity and specificity values were obtained by 81.24%, 90%, 81.82%, and 88.89%, respectively after applying WOA-KNN algorithm on BUPA dataset. Also, by the implementation of WOA-KNN algorithm on the ILPD dataset, the values of 91.28%, 98.11%, 85.25%, and 97.06% were obtained for accuracy, precision, sensitivity and specificity, respectively. Table 3 and 4 illustrate the classification accuracy for two KNN and WOA-KNN algorithms in predicting liver disease. 3 shows the results of WOA-KNN hybrid algorithm applied for two datasets.
In order to evaluate the performance of the proposed algorithm, the results obtained by this algorithm were compared with those of the previous works. Table ??
shows the results obtained by the proposed algorithm and those of the previous researches. Improvement observed in the results show the superiority of the proposed algorithm
Figure 2. WOA-KNN algorithm.
Table 3. the results obtained by WOA -KNN hybrid algorithm
for ILPD Data set.
Indicator WOA-KNN KNN
Accuracy 91.2824 86.4333
Precision 98.1132 94.3396 Sensitivity 85.2459 79.3651 Specificity 97.0588 90.6250
Table 4. The results obtained by WOA -KNN hybrid algorithm
for BUPA Data set
Indicator WOA-KNN KNN
Accuracy 81.2349 71.3293
Precision 90 55
Sensitivity 81.8182 78.5714 Specificity 88.8889 65.3846
Figure 3. (a) The results obtained by WOA -KNN hybrid
work Method BUPD ILPD
Olaniy BPNN 63
RBFN 70
Vijayarani Naïve Bayesian 61.28
Svm 79.66
This paper WOA-KNN 81 .2349 91 .2824
5. Conclusions
The liver is the most important organ in the human’s body. The prediction of the liver dysfunction and its proper diagnosis would lead to a reduction in the complications of the disease and prevents the progress of the disease. Recently, artificial intelligence techniques have played an important and effective role in predicting the disease and its treatment. Naïve Bayesian Network and SVM algorithms proposed by Vijayarani et al were used for ILPD datasets to diagnose liver disorders in a patient, which the results showed the accuracy of 55% and 76% was obtained by two mentioned algorithms, respectively [7]. Olaniy in a study, by applying BPNN neural network and radial function on BUPD dataset obtained the accuracy of 63% and 70% , for each of the proposed methods, respectively [1]. In the present study, using the proposed hybrid method, the accuracy and precision of the two datasets has been increased, so that the superiority of the proposed method was confirmed compared to previous works. It is suggested to investigate the factors influencing the disease using an optimization algorithm in future studies. By the help of the early diagnosis of the disease, beneficial outcomes would be achieved for both physicians to treat the disease at the early stages and for patients, since it would reduce the costs for the treatment.
References
[1] OlaniyI E.O, Adnan K. (2013) Liver Disease Diagnosis Based on Neural Networks, Advances in Computational
Intelligence, pp.48-53.
[2] Bahramian S, Nikravanshalmani A. (2016) Hybrid algorithm based on K-nearest-neighbor algorithm and
Adaboost with selection of feature by genetic algorithms for the diagnosis of diabetes; vol. 6, no. 2, pp. 2977-2986. [3] Jabbar M.A. (2017) Prediction of heart disease using k-nearest neighbor and particle swarm optimization,
Biomedical Research, vol. 28, no. 9, pp. 4154-4158.
[4] Karule P.T., Dudul S.V. (2009) Intelligent Diagnosis of Liver Diseases from Ultrasonic Liver Images, Neural Network Approach. In: Lim C.T., Goh J.C.H. (eds) 13th International Conference on Biomedical Engineering. IFMBE
Proceedings, vol 23. Springer, Berlin, Heidelberg, pp.
215-218.
[5] Spelt L,Nilsson J,Andersson J,Andersson B. (2012) Prognostic models for outcome following liver resection for colorectal cancer metastases: A systematic review,
EJSO Eur J Surg Oncol, Vol 38, pp: 16-24.
[6] Gulia, A., Vohra, D.R., Rani, P.I. (2014) Liver Patient Classification Using Intelligent Techniques,International Journal of Advanced Research in Computer Science and
Software Engineering, Vol. 5 (4) , 2014, 5110-5115.
[7] Vijayarani S,Dhayanand S. (2015) Liver Disease Predic-tion using SVM and Naïve Bayes Algorithms,International Journal of Science, Engineering and Technology Research
(IJSETR), vol. 4, no. 4, pp.816-820.
[8] OlaniyI E.O, Adnan K. (2014) Onset diabetes diagnosis using artificial neural network, International Journal of
Scientific and Engineering Research2014a, vol. 5, no. 10, pp.
754-759.
[9] Mirjalili S.A,Lewis A. (2016) The Whale Optimization Algorithm,Advances in Engineering Software95, pp. 51-67.
[10] Newman D.J, S. Hettich S,Blake C.L, Merz C.J. UCI Repository of machine learning databases, (1998),(http://www.ics.uci.edu/ mlearn/MLRepositor), University of California, Department of Information and Computer Science. Last access: 11th August 2015. [11] Ramana B.V, Babu M.S.P,Venkateswarlu N.B. Indian
Liver Patient Dataset, UCI Repository of machine learning databases , University of California, Department of Information and Computer Science 2013.
[12] García V, Sánchez J.S, Mollined R.A. (2012) On the effectiveness of preprocessing methods when dealing with different levels of class imbalance,Knowledge-Based
Systems25, pp. 13-21.
[13] Baratloo A, Hosseini M, Negida M, Ashal E. (2015) Simple Definition and Calculation of Accuracy,Sensitivity