Research
Article
Context
analysis
approach
for
context
aware
applications
deployed
on
pervasive
environments
Nesrine
Khabou
1,∗,
Ismael
Bouassida
Rodriguez
1,2,
Mohamed
Jmaiel
1,31ReDCAD laboratory, University of Sfax, National School of Engineers of Sfax, Tunisia
2Univ de Toulouse, LAAS, Toulouse, France
3Research Center for Computer Science, Multimedia and Digital Data Processing of Sfax, Sfax, Tunisia
Abstract
The increase of mobile and interconnected devices leads to the growth of demands for context aware applications.Theseapplicationsdeployedontopofpervasiveenvironmentsmustadaptthemselvestocontext changes.Contextawareapplicationshavetocontinuouslysensetheirphysicalenvironment,andadapttheir behavior accordingly. These applications must perform four phases starting by collecting and monitoring context, thenanalyzing context, deciding adaptation actions andfinally executing theplannedadaptation actionstodeal withthecontextchanges.Inthispaper,wefocusonthesecondphase.Weproposea context analysis approach that relies on different thresholds defined according to the user needsto detect context changesandraisenotificationswhenchangesoccur.Theanalysisapproachisperformedaccordingtothree differentsteps.Acontextstoragestep,acontextclassificationstep,andathresholdcalculationstep.
Received on 12 December 2014; accepted on 05 March 2015; published on 04 August 2015
Keywords: Pervasive computing, context awareness, adaptation, analysis techniques, threshold calculation, mathemati-cal models.
Copyright © 2015 Nesrine Khabou etal., licensed to ICST. This is an open access article distributed under the terms of
the Creative Commons Attribution license (http://creativecommons.org/licenses/by/3.0/), which permits unlimited
use, distribution and reproduction in any medium so long as the original work is properly cited.
doi:10.4108/eai.4-8-2015.150041
1. Introduction
Recently, we have been witnessing how various applications are being integrated more deeply into daily users [6]. These technological advances are providing the hardware infrastructure necessary to achieve the pervasive computing paradigm [14]. Pervasive computing is defined by Mark Weiser [16] as: "The most profound technologies are those that disappear. They weave themselves into the fabric of everyday life until they are indistinguishable from it”. One of the important properties of pervasive computing is context awareness. Moreover, pervasive computing and ubiquitous applications need to be aware of their environment in order to adapt to changing contexts and provide correct services [1]. Context awareness refers to
∗
Correspondingauthor.Email:[email protected]
the ability of an application to acquire and reason about context and adapt its behavior accordingly.
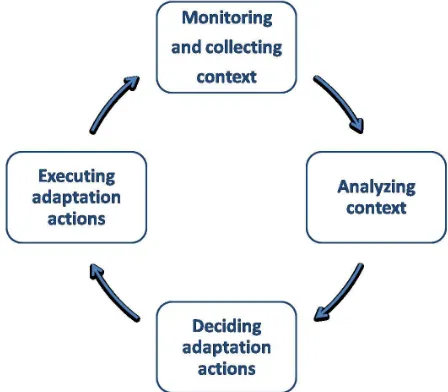
Therefore, applications on top of pervasive environ-ments need to be context aware so that they can adapt themselves to the changing context and the execution environments. The applications that feature this prop-erty should perform four phases illustrated in Fig-ure. 1 starting by collecting and monitoring context from different sources like sensors for example. These
monitored information are exploited and analyzed dur-ing the second phase (Analyze). The analysis phase is responsible for detecting context changes and raising notifications when changes are detected. These notifi-cations are used in the third phase (Decide) to decide the adaptation actions related to the changes. In the last phase (Act), the adaptation actions are executed to react to the changes and adapt the application behav-ior accordingly. Our interest is focused on the second phase (Analyze). In fact, detecting context changes in a timely manner is crucial to avoid undesirable situations such as device crashes, etc. In this paper, we propose
andwedetailacontextanalysisapproachinpervasive environments. Our proposed approach is performed according tothree steps. First,contextparametersare stored in context databases for example for further use. The context storage step is out of the scope of this paper.Second, the stored context parametersare retrievedfromthedatabasesthenclassifiedtofacilitate the context use. Finally, the context parameters are analyzed and changes aredetected by comparing the contextparametervalues andthe computedthreshold values.Thethresholdvaluesarecomputedandupdated via different mathematical models. Notifications are
triggeredwheneverthecontextvaluescrossthe thresh-oldvalue.
Figure 1. Context aware application cycle
The rest of the paper is organized as follows. In section 2, we present some studies related to context change detection (Context analysis). In section 3, we present a case study named “Smart Campus System”. Its purpose is to provide suitable services to users according to context. The analysis approach is detailed in section 4. First, we define a context parameter classification step which takes into account the context parameter evolution. Second, we detail the threshold calculation step that allows to analyze context and detect changes. In section5, we illustrate the usefulness of our approach through an illustrative scenario related to the Smart Campus case study. The last section concludes the paper and gives some directions for future work.
2. Related work
In the context changes detection (context analysis) research direction, different techniques are proposed to
detect the context changes.
Cioara et al. [4] propose to use the context entropy concept to detect the context changes and determining the degree of fulfilling a predefined set of policies. Furthermore, context situation entropy measures the level of the system’s self and execution environment disorder. So, if the system context situation entropy value exceeds a fixed threshold value, then the system is in a critical state and it must execute adaptation actions to control itself and to keep the system entropy below the threshold.
Although this approach allows for a self adaptation in context aware systems, it is restricted to external context parameters such as temperature, humidity and light etc. Besides, using fixed threshold values is inappropriate in dynamic environments and can cause false alarms.
In other studies, context changes are detected by comparing a context value saved in a repository with a new context value. In fact, Zheng et al. [18] have addressed the issue of context change detection by proposing a context-aware middleware which conforms to the CORBA component model. The proposed middleware is composed of context aware services such as a context collector, a context interpreter, a context repository and a context analyzer. The latter is in charge of filtering and analyzing context parameters to determine relevant context changes and notify the application afterwards. Context filtering is based on a comparison of the context values stored in the context repository with the new context value in order to detect context changes.
The proposed middleware enables to save the scare resources. In fact, the component deployment is performed “just-in-time”. However, this middleware does not specify context parameters to take into account.
Another approach for dynamic context management is proposed by Taconet et al. in [15]. They present CA3M, a context aware middleware, which enables applications to adapt their behavior by dynamically taking into account context changes. The authors model the application by “entities”, which represent a physical or a logical phenomenon (person, concept, etc.) and “observable”, which defines something to observe. For instance, a mobile device state is an example of an observable which may take a finite number of values (e.g low battery, almost low battery or normal battery). They consider that the change of an “observable” state leads to a different application behavior.
Other approaches are used to analyze context. In fact, Bouassida et al. [3] proposed a model driven approach for collaborative pervasive systems. The authors have identified different levels for such systems.
a selection procedure, that allows the adaptation to context changes according to given policies. The selection procedure is based essentially on fixed thresholds. Then, once a node state (identified by battery level, memory consumption, CPU usage, etc.) remain below/under the threshold values, a notification is raised. Although this approach enables to detect context changes, it may cause false detections by using fixed thresholds.
In the work of Hussein et al., [7], the authors pro-posed an architecture based approach for developing context aware adaptive systems. The proposed archi-tecture has three layers that partition the system in a way that allows the context aware adaptive system requirements to be handled using the different
lay-ers. The context is first modelled at layer two (The system and its context representation), processed and managed at layer three (The change management). This layer is responsible for adapting the system to cope with context. It is based on adaptation rules that rely on fixed thresholds to trigger adaptation actions. The above layered approach allows for context aware system development. The used technique for context change detection is based on fixed threshold which can lead to false detections or missing alarms.
Birje et al. [2] propose a multiagent model to monitor the resource availability and control the device state in wireless grid. The mobile agent models aim to provide not only a resource monitoring scheme to keep track of all devices and their resource utilization at any instant but also a device state control such that avoiding an overloaded state. For that reason, the authors consider three resource states: an overload/poor state, an underload/excellent state and a normal state. To evaluate the resource state, the authors define two thresholds. A minimum threshold thresholdmin and
a maximum threshold thresholdmax. The proposed
multi agent model monitors and controls the resource utilization, the resource availability, the device mobility and the device state by using the defined thresholds. Although the proposed approach takes into account various parameters, the use of fixed thresholds can lead to false or missing detections.
In [10], the authors provide an experimental study about the detection capabilities provided by different
monitoring techniques used in web based applications. They study four monitoring techniques. The system level monitoring that consists in gathering different
sys-tem parameters like CPU usage, memory consumption, etc.These parameter values are forwarded to a central system that compares the collected parameter values against threshold values that are set so that when the thresholds are reached, alert messages are triggered. In the container level monitoring, application containers that include monitoring services gather details related to the application server parameters for example the
JVM memory, the instanced objects, etc. The gathered data is used by the information technology staff to
reason about the application server thumbprint and to react when necessary in order to adjust the appli-cation and improve its performance. The end-to-end monitoring aims to identify if users are facing problems while accessing the application. End-to-end monitoring tools are based on monitoring agents that are geograph-ically dispersed that gather details such as availabil-ity, response time, etc. These data are used to detect anomalies and identify their origin. Finally, log anal-ysis which consists in log files that record data about the system and application usage to detect anomalies. The authors propose their own monitoring technique. They present a framework used to detect and isolate performance anomalies in web based applications. The proposed framework is composed of different building
blocks: A monitoring module, a performance analyzer, an anomaly detector, a root cause failure analysis, a recovery module, a workload variation module and a system dimensioning module. The monitoring module is responsible for collecting, online, a set of system, application and application server parameters. These parameters are transmitted to the performance analyzer to detect the performance anomalies. When anomalies are detected, the recovery module is responsible for executing the reconfiguration action. For the workload variation and the system dimensioning modules, they are in charge of controlling the workload demands and the resource consumption. The authors use AOP (Aspect Oriented Programming) to monitor the system, the application and the application server parameters. In order to detect anomalies, the authors measure the correlation degree between the response time and the number of user transactions processed. Alert messages are triggered when the correlation degree suddenly decays. An additional analysis based on the Dynamic-Time Wrapping algorithm is performed to detect perfor-mance anomalies. The proposed approach is designated to web based applications, so that it is restricted to few parameters.
temporal evolution. Finally, for the multiparametric alarms, they are build by considering simultaneously several heterogeneous parameters. Summarizing, the diversealarmcategoriesarecharacterizedbythresholds in orderto detect theevent. However, specifying pre-established thresholds is not appropriate in dynamic environments. Furthermore, only data related to patientsareconsidered,astheproposedframeworkis evaluatedthroughahealthcaredomain.
Miao et al. [11], have proposed an online light weightfailuredetectionapproachthataimsatdetecting nodesfailureinawirelesssensornetwork.Theauthors design a correlation graph that characterizes internal correlationsinside anode. Then,failuresaredetected by identifying the changes and anomalies of the correlation graph. The proposed approach aims at analyzing node metrics. The authors classified node metrics into four categories such as timing metrics, traffic metrics, task metrics and other metrics. Then,
thecorrelationgraphnodesrepresentthenodemetrics and the edges represent the pairwise correlations of themetrics.Eachedgehasaweightwhichdenotesthe correlation score between the corresponding metrics. The correlation graph is maintained periodically for eachnodeinthewirelesssensornetwork.Then,anode isassumedtobefaultyifthereisamissingcorrelation between two metrics. The proposed approach allows to detect node failure in wireless sensor network by constructing a correlation graph of a node. Although the proposed approach relies on minimal a-priori knowledgeandcanbegeneralizedtoawidevarietyof wirelesssensornetworkapplications,itisrestrictedto somecontextparametersrelatedtonodes.Furthermore, theproposedapproachdoesnottreatforexamplelink failure.
Mohamed et al. [12], have proposed an approach based on the modeling of physical phenomena, allowing to use available resources to predict the values that are supposed to be read by sensors. Then, a comparison of the predicted values and the real readings allows to detect failures. Predicting is performed through a prediction engine that is responsible for deducing the values expected to be read by sensors based on the law sets defined in the environmentmodel.Ifthepredictedvaluesareoutside thesensor’stolerancemargin,then,afailureisdetected. Theproposedapproachallowstodetect failuresusing a comparison between predicted values and values actually read from sensors. However, the technique usedtodetectfailurescancausefalsealarmssincethe predictedenginecouldproduceinaccuratevalues.
3.
Case
study:
Smart
campus
system
To motivate theuse of ourapproach, weintroducein the following an example of a smart campus system
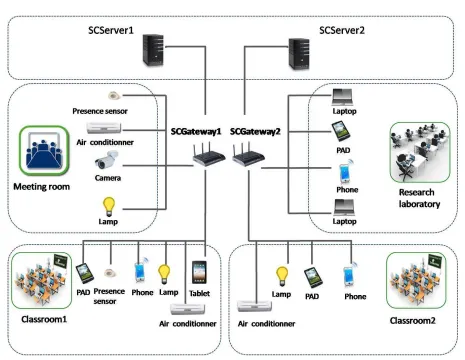
illustrated in Figure. 2. Smart campuses, with the ability to collect and analyze data, are built in order to benefit the institutions, the actors -the students and the teachers- by providing services which facilitate interaction between them. For instance, in the smart campus, every actor is equipped with a personal device such as a Personal Digital Assistant (PDA), a smart phone, a tablet, etc. and the smart campus system provides different services to actors based on
their current situations. To maintain the collaboration between students and teachers, these devices need to be aware of their environment and their execution context, etc. Consequently, smart campuses contain an infrastructure that allows devices and systems to be monitored and adapted autonomously according to the changing context.
In this paper, our work deals with several context parameters such as temperature, pressure, position and light which need to be monitored. Furthermore, a number of context resources such as the memory consumption, the energy, the CPU load and the available bandwidth should be monitored to assess both the devices and the communication state especially in pervasive environments. The campus architecture depicted in the Figure. 2 involves different kinds of
participants. On the one side, two controlling servers called Smart Campus Servers (SCS) namely SCS1 and
SCS2which are Ethernet-connected and equipped with
important storage and high computational capabilities. On the other side, fixed (Presence sensors, cameras, lamps, air conditioners) and mobile (laptop, PDA, phones) devices are placed inside of the campus. The mobile devices are usually resource constrained in terms of memory, bandwidth and energy for example. Hence, a periodic monitoring by the controlling servers is needed in order to check their state which changes according to context. Furthermore, two gateways called Smart Campus Gateways (SCG),SCG1
and SCG2 implementing software interfaces are used
to connect devices to the corresponding controlling servers to transmit information between them. The campus space is composed of separate rooms (Research laboratories, Meeting rooms, classrooms (Classroom1 and Classroom2)). Each room is equipped with fixed devices as well as mobile devices that are carried by the different actors.
Because of the complexity of the interaction between the different entities, we propose to focus our study on
a part of the Smart Campus. It consists in the gateway
SCG2 connected to both the SCS2 and the devices
located in the Classroom2.
Figure 2. Case study: Smart campus
4. The proposed approach
Our context analysis approach is performed according to three steps: A context storage step, a context processing and classification step and a threshold calculation step. The context storage step is out of the scope of this paper.
In the following we present respectively the context classification step and the threshold calculation step.
4.1. Context parameter classification step
With a wide range of context parameters, context parameters need to be classified into different categories
in order to use context easily. Since context parameters evolution is dynamic especially in pervasive environ-ments, we propose to divide the context parameters into three categories according to the context parameter evolution. We have identified three categories. Param-eters whose evolution is characterized by a tendency, parameters whose evolution is characterized by peaks and parameters whose evolution is characterized by bursts. Therefore, this classification covers almost all
context parameter types. Indeed, each context param-eter evolves over time, so, it belongs inevitably to one of the defined context categories.
The tendency category. A tendency is defined as a line in a graph which shows the general direction that a set of points seem to be heading as illustrated in Figure. 3(a). For example, each mobile device such as PDA, mobile phone, etc. mentioned in section 3
periodically monitors its resource state namely the battery level, the memory consumption that belong to the tendency category.
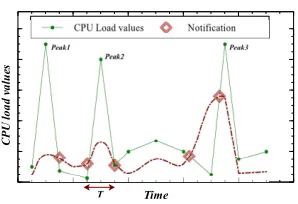
The peak category. Peaks are defined as high values with sharp rise followed quickly by sharp fall implying a narrow period width [13]. We define a peak “Peak” by its amplitude “Ap” and its period “T” as depicted in
Figure. 3(b). In fact, the peak is a very narrow period of high values- That is, its amplitude “Ap” exceeds for
n times the average amplitude “Aav” of the time series
formed by the context parameter evolution. We define a peak by the following formulas:
(
Ap = n×Aav
B
a
tt
e
ry
v
a
lu
e
s
Time
(a) Tendency category
T
Average Amplitude Ap
CPU Load values
C
P
U
l
o
a
d
v
a
lu
es
Time
(b) Peak category
Message number values
OFF-period
ON-period
M
es
sa
g
e
n
u
m
b
er
Time
(c) Burst category
Figure 3. The proposed context categories
WhereApdefines the peak’s amplitude,Aavdefines the
average amplitude of the context parameter evolution,n
andmare constants fixed by the application designers. TheSCSs receive the monitored data from the mobile devices in order to analyze them. For that reason, the
SCSsCPU load can rise suddenly reaching high values after a high rate of requests. Hence, the CPU load especially of the SCSs can be modeled by a peaked function. The link load and the available bandwidth belong also to this context category.
The burst category. A burst consists on a relatively wide contiguous region of values. Otherwise, a burst is defined as a large number of occurring events [8]. As depicted in the Figure. 3(c), we model the wide region by an ON period and the other by an OFF behavior [17]. The ON-period models a single flow such as the transfer of a single web page, and the OFF-period models the user’s thinking time. The ON-period and the OFF-period are strictly alternating. The message number received by theSCSs during an ON-period is modeled as a burst.
4.2. Threshold calculation step
In the following, we detail some elements about threshold calculation for each context category defined previously.
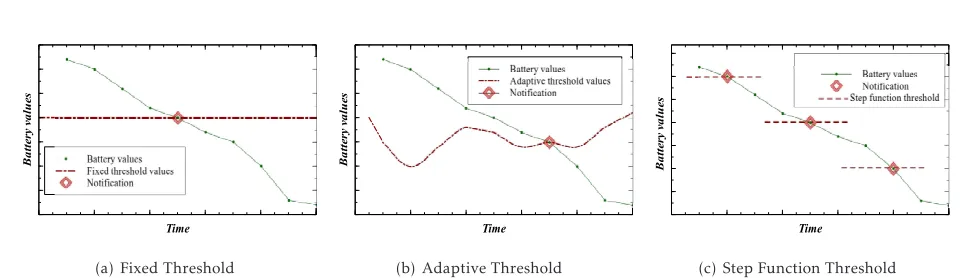
Threshold calculation for the tendency category. For this category, the context parameter evolution is described by a tendency. In order to avoid false detections as well as missing alarms, we need to define thresholds which are uncorrelated with the context parameter evolution. The notification raised when the context parameter behavior crosses the threshold is illustrated in Figure.4. Uncorrelated thresholds can be fixed thresholds, uncorrelated adaptive thresholds and step function thresholds. For instance, these thresholds are defined by the application designers according to their needs in terms of Quality of Service (QoS).
For the adaptive threshold denoted in the Fig-ure. 4(b), mathematical methods can be applied in
order to update threshold values at runtime. However, for this kind of context parameter characterized by a tendency, adaptive threshold must be uncorrelated with the context parameter evolution in order to avoid false detections and missing alarms.
For the step function threshold described in the Fig-ure.4(c), thresholds are defined per period according to the application designers needs.
T
C
P
U
l
o
a
d
v
a
lu
e
s
Time
Figure 5. Threshold calculation for the peak category
Threshold calculation for the peak category. In this context category, the idea consists in specifying adaptive thresholds that are correlated with the context parameter evolution. Adaptive thresholds are calculated via different mathematical models such
as Exponential Weighted Moving Average (EWMA) technique used by Lahyani et al. [9], Simple Moving Average (SMA). Mathematical functions defined by the application user are used to update thresholds.
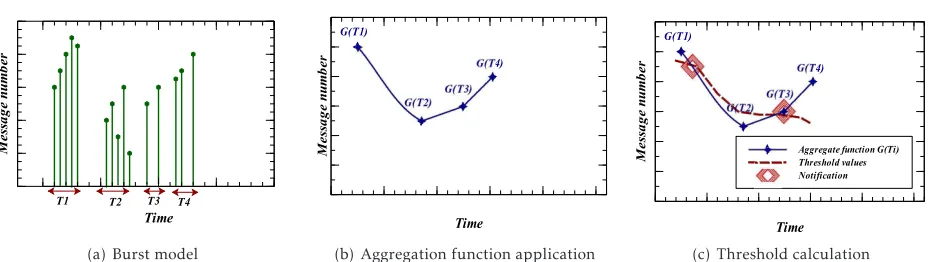
Threshold calculation for the burst category. In this context category, our idea consists on transforming a bursty model into a tendency/peak model. So we propose to apply an aggregate function G in each ON-period. The obtained model coincides with a tendency function as illustrated in Figure.6(b). A notification is raised when the context parameter crosses the threshold calculated in an ON-period.
B
a
tt
e
ry
v
a
lu
e
s
Time
(a) Fixed Threshold
B
a
tt
e
ry
v
a
lu
e
s
Time
(b) Adaptive Threshold
B
a
tt
e
ry
v
a
lu
e
s
Time
(c) Step Function Threshold
Figure 4. Threshold calculation for the tendency category
devices. The maximum queue size for this device is set by the application designer. So that, if the traffic received by this gateway in a periodTi exceeds
a maximum, then a burst is identified in Ti. To
detect bursty periods, applying the aggregate function G consists in calculating the slope of the scatter diagram obtained in each ON-period. Second, in each ON-period, we compute the intensity of each slope formed in each ON-period. We obtain the Figure.4(b). Consequently, if the slope intensity exceeds the threshold, then a burst is detected and appropriate adaptation actions are triggered.
5. Illustrative scenario
To illustrate the usefulness of our approach, we elaborate the following scenario which is conducted in the smart campus system presented in Figure. 2. It highlights the ability of an application to react accordingly to the changing context. We focus on the interaction of the actors of the Classroom2 and
SCS2 through SCG2. Classroom2 is used by the
researchers, the teachers and the students. Different
context parameters are considered in this scenario.
• The actors’ position: It belongs to the peak category. Adaptive thresholds are applied to this context parameter.
• The memory consumption: It belongs to the ten-dency category. Fixed, adaptive or step function thresholds are applied to this context parameter.
The scenario starts as follows: At the beginning of each course session, the presence sensor captures and localizes the mobile actors. Their positions are then forwarded to SCS1. SCS1 runs the analysis
algorithm based on thresholds on the context parameter (mobile actors’ position) and takes the appropriate decision. Each student participating to a course uses a tablet device to which the course will be dispatched through bluetooth. The tablet device holds the analysis algorithm in order to detect context changes. During
the course, the students’ tablet display appropriate slides and they follow their courses. Furthermore, the students can write annotations on their tablets and publish their comments to share knowledge between all the group members to enrich the course and enhance the collaboration. A student holding a tablet is participating to the course by exchanging information and slides.
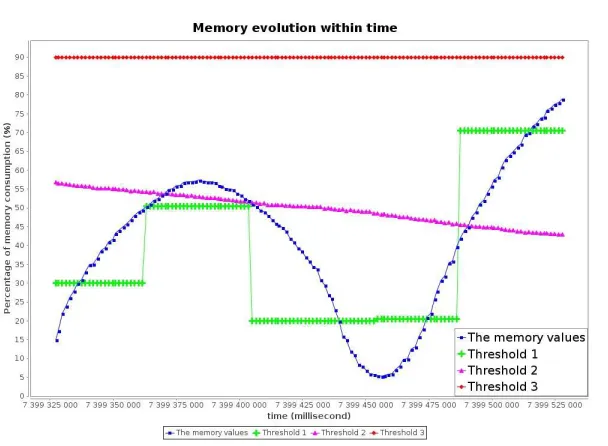
For each amount of data received, the tablet device retrieves the memory consumption from the operat-ing system usoperat-ing probes. Since the memory consump-tion belongs to the tendency category, fixed thresh-old(Threshold3), step function threshold (Threshold1) and uncorrelated adaptive threshold (Threshold2) are applied for this context parameter as illustrated in the Figure.7.
• T hreshold3: A fixed threshold (value=90). This
threshold is specified by the application designer. It corresponds to a critical memory. For instance, if the memory values crosses this fixed threshold, the analysis module detects a device crash.
• T hreshold2: An adaptive threshold. This threshold
is updated using the mathematical formula defined by the user. The mathematical formula is described as follows:
T hresholdt=λ×t+β
Whereλandβ are two constants defined by the user.λrepresents the slope andβ represents the intercept. This threshold level corresponds to a normal memory state. As shown in Figure.7, we do not need to trigger adaptation actions when memory values oscillate around the T hreshold2.
However, we must react when the memory not only goes past theT hreshold2but comes closer to
the critical threshold (T hreshold3).
• T hreshold1: A step function threshold. The step
T4 T3 T2 T1
M
e
ss
a
g
e
n
u
m
b
e
r
Time
(a) Burst model
G(T4) G(T1)
M
e
ss
a
g
e
n
u
m
b
e
r
Time
(b) Aggregation function application
Aggregate function G(Ti) Threshold values Notification
G(T4) G(T1)
M
e
ss
a
g
e
n
u
m
b
e
r
Time
(c) Threshold calculation
Figure 6. Threshold calculation for the burst category
– For the first step (threshold value=30), we can consider that the course to which the student is participating does not require exchanging information.
– For the second step (threshold value=50.5), we can consider that the student is partici-pating to a course that requires interaction with the teacher, displaying and exchanging information.
– For the third and the fourth step (thresh-old value=20, thresh(thresh-old value=20.5) respec-tively, we can consider that the student is in a pause time or he is not doing any activity. – For the last step (threshold value=70.5), it
means that we must react once the memory values cross this threshold and increase rapidly.
6. Conclusion
The challenges for context aware applications design and implementation are to perform four phases. Collecting context from different sources such as
sensors, widgets, etc., analyzing context to detect changes, deciding adaptation actions and executing the planned action to react dynamically to context changes. In this paper, we have considered context analysis. we have proposed an analysis approach for context change detection in pervasive environments. The proposed analysis approach is divided into three steps. A context storage step, a context classification step and a threshold calculation step. The context storage step is out of the scope of this paper. We have proposed a context classification based on context parameter evolution. This context classification takes as input the collected context parameter and attributes for each context parameter one or many categories. Three categories have been identified. Second, we have detailed the threshold calculation step that aims at analyzing context and identifying context changes. Threshold calculation allows to analyze
context parameters, identify context changes and notify the context aware application. The thresholds can be fixed, step function and adaptive ones. For the adaptive thresholds, mathematical models are applied in order to update the threshold used to detect context changes. Further, when the context parameter crosses the threshold, a notification is triggered to react to the context changes. As future work, we plan first to stretch the context parameter classification. Second, our aim consists not only in detecting context changes but also predicting context behavior using mathematical models such as autoregression.
7. Acknowledgements
This research is supported by the Itea2’s A2NETS
(Autonomic Services in M2M Networks) project1.
References
[1] Alagar, V., Mohammad, M., Wan, K. and Hnaide,
S.A.(2014) A framework for developing context-aware
systems. EAI Endorsed Transactions on Context-aware
Systems and Applications14(1). doi:10.4108/casa.1.1.e2.
[2] Birje, M. and Manvi, S. (2011) Multiagent
model for device state control in the wireless
grid. In Electronics Computer Technology (ICECT),
3rd International Conference on, 3: 456 –460.
doi:10.1109/ICECTECH.2011.5941834.
[3] Bouassida Rodriguez, I., Sancho, G., Villemur, T.,
Tazi, S.andDrira, K.(2009) A model-driven adaptive
approach for collaborative ubiquitous systems. In
Proceedings of the 3rd workshop on Agent-oriented software engineering challenges for ubiquitous and pervasive computing, AUPC 09 (New York, NY, USA: ACM): 15–20. [4] Cioara, T., Anghel, I., Salomie, I., Dinsoreanu, M.,
Copil, G. and Moldovan, D. (2010) A self-adapting
algorithm for context aware systems. In Roedunet
International Conference (RoEduNet), 2010 9th: 374 –379.
[5] Esposito, A., Tarricone, L. andZappatore, M. (2010)
A versatile context-aware pervasive monitoring system:
Figure 7. Application of threshold on the memory context parameter
Validation and characterization in the health-care
domain. In Industrial Electronics (ISIE), 2010 IEEE
International Symposium on: 2791–2796.
[6] Gilman, E., Davidyuk, O., Su, X.andRiekki, J.(2013)
Towards interactive smart spaces.JAISE5(1): 5–22.
[7] Hussein, M., Han, J., Colman, A. and Yu, J. (2012)
An architecture-based approach to developing
context-aware adaptive systems. In Engineering of
Computer Based Systems (ECBS), 2012 IEEE 19th International Conference and Workshops on: 154–163. doi:10.1109/ECBS.2012.13.
[8] Klan, D., Karnstedt, M., Politz, C. and Sattler,
K. (2008) Towards burst detection for non-stationary
stream data. InKDML: 57–60.
[9] Lahyani, I., Khabou, N. and Jmaiel, M. (2012) Qos
monitoring and analysis approach for publish/subscribe
systems deployed on manet. InParallel, Distributed, and
Network-Based Processing, Euromicro Conference on(Los Alamitos, CA, USA: IEEE Computer Society): 120–124.
[10] Magalhaes, J.andSilva, L.(2012) Anomaly detection
techniques for web-based applications: An experimental
study. In Network Computing and Applications (NCA),
2012 11th IEEE International Symposium on: 181–190. doi:10.1109/NCA.2012.27.
[11] Miao, X., Liu, K., He, Y., Liu, Y. and Papadias, D.
(2011) Agnostic diagnosis: Discovering silent failures
in wireless sensor networks. In INFOCOM, 2011
Proceedings IEEE: 1548–1556.
[12] Mohamed, A., Jacquet, C. and Bellik, Y. (2012) A
fault detection and diagnosis framework for ambient
intelligent systems. InUbiquitous Intelligence Computing
and 9th International Conference on Autonomic Trusted Computing (UIC/ATC), 2012 9th International Conference
on: 394–401.
[13] Palshikar, G.K. (2009) Simple Algorithms for Peak
Detection in Time-Series. InProc. 1st Int. Conf. Advanced
Data Analysis, Business Analytics and Intelligence. [14] San Martín, L.A.,Peláez, V.M.,González, R.,Campos,
A.andLobato, V.(2010) Environmental user-preference
learning for smart homes: An autonomous approach.J.
Ambient Intell. Smart Environ.2(3): 327–342.
[15] Taconet, C., Kazi-Aoul, Z., Zaier, M. and Conan,
D. (2009) Ca3m: A runtime model and a middleware
for dynamic context management. InProceedings of the
Confederated International Conferences, CoopIS, DOA, IS, and ODBASE 2009 on On the Move to Meaningful Internet Systems: Part I, OTM ’09 (Berlin, Heidelberg: Springer-Verlag): 513–530.
[16] Weiser, M. (1995) Human-computer interaction (San
Francisco, CA, USA: Morgan Kaufmann Publishers Inc.), chap. The Computer for the 21st Century, 933–940. [17] Yang, X. (2002) Designing traffic profiles for bursty
internet traffic. InIn Proceedings of IEEE Global Internet.