103 Volume 6, 2008
EFFECTS OF TEACHERS
AND SCHOOLS
ON mATHEmATICS ACHIEVEmENT
noor azina Ismail University of malaya, Kuala Lumpur, malaysia Email: nazina@um.edu.my
abstract
The purpose of this study is to investigate the effect of factors related to schools and teachers on mathematics achievement of Malaysian students in the Trend International Mathematics and Science Study conducted in 2003. A total of 150 schools were involved in the study and these schools were selected at random using simple random sampling from all secondary schools in Malaysia. This study employed a uni-variate analysis such as t-test or ANOVA to investigate the differences in mathematics achievement among groups. It was found that students taught by female teachers, participating in developing mathematics contents and mathematics curriculum, having few or no limitation on instruction, spent less time in reviewing homework and more on working problem on their own, students coming from economically less disadvantaged homes, good perception on the school climate and good class attendance had significantly higher mathematics achievement.
Keywords: academic performance, mathematics achievement, schools and teachers.
Introduction
In 1966, a group of researchers had written a report known as The Coleman Report (Coleman et al, 1966) which implies that only students’ background proved to be a significant predictor of achievement in school and other factors such as school inputs, teachers and factors that were under control of educators do not matter. The controversy over findings and implications of Coleman Report generated many other studies which were generally aimed to prove that schools and teachers matter (Hanushek, 1997; Angrist & Lavy, 2001; Jepsen & Rivkin, 2001; Jacob & Lefgren, 2002; Rivers & Sanders, 2002; and Rivkin, Hanushek & Kain, 2002). These researchers found that teachers’ experi
-ence and qualification, and school expenditure contribute to student performance.
In Malaysia, educational system is highly centralized whereby formulating policy guidelines, translating policies into plans, project and activities, developing curriculum syllabi, coordinating national examination and teacher placement are carried out at the national level, under the Ministry of Education (MOE), Malaysia. Despite the full control of MOE on curriculum and school budget, teachers in Malaysia are responsible for assessing and evaluating student’s achievement and each school is free to carry out activities to improve students’ academic performance. Hence, it is natural to expect that differences among schools and teachers characteristics have effect on student academic performance.
We are interested in investigating factors that are related to mathematics achievement in the Trend International Mathematics and Science Study (TIMSS), conducted in 2003 by the Interna
104 467 and Malaysia was placed 10th among the 45 countries involved in the study. The performance of Malaysian students in 2003 improved from the study carried out by IEA in 1999 where Malaysia was at the 16th place.
TIMSS collected information about the demographic characteristics of the teachers and teach
-ers’ educational background and preparation, including opportunities for professional development and instructional practices. Factors related to teachers investigated in this study are background characteristics of teachers, preparation for teaching mathematics and classroom characteristics and instruction. Background characteristics of teachers include gender, age, type of teaching certification and number of years of teaching experience.
Meanwhile, preparation for teaching mathematics includes teachers’ highest level of educa
-tion, major area of study, and professional development in mathematics while teaching in school. Furthermore, classroom characteristics and instructions are represented by class size, limitation on instruction, instructional strategies, calculator use, roles of homework and assessment. Factors related to schools are the economic status of the students, the extent of school resources, the school climate, attendance problems and school safety.
Hence, it is the objective of this study to investigate the effect of these factors (factors that are related to teachers and schools) on mathematics achievement of the eighth grade students in Malaysia using data from TIMSS 2003. Although this study is exploratory, these results will provide other educators, school administrators, teacher educators and policy makers with important insights of what is going on in the eighth grade mathematics classroom in Malaysia.
Methodology of Research
This paper analyzes data from TIMSS conducted in 2003 by the IEA which was carried out in more than 40 countries around the world. The data were obtained from the responses of teachers and principals of the schools. The study involved eighth grade students at 150 schools in Malaysia. The school samples were selected using a simple random sampling from all the secondary schools in Malaysia. For each school, a single classroom of eighth grade students was selected at random. Mathematics teacher for this class was asked to complete the teacher’s questionnaire and the principal of the school was asked to answer questionnaire related to the school.
TIMSS administered a two-part questionnaire for the teachers. In the first part, the teachers were asked to provide information about their background and training and their instructional practices. In the second, the teachers gave information about classroom instruction. The school questionnaire con
-sisted of information about the school contexts for learning and instruction. The information included the economic status of the students, the extent of school resources, the school climate, attendance problems and school safety. Full descriptions of variables and the summarized results can be found in the International Mathematics Reports (Mullis, Martin, Gonzalez & Chrostowski, 2004).
Students’ performance in this study is represented by the average score in mathematics of students in a class and the average score for each student is the average of five plausible values generated by TIMSS. Data were presented in percentages to investigate their distribution. In addition, a t-test was used to investigate differences in mean scores among two groups in each variable. For more than two groups, ANOVA was used.
Results of Research
Background Characteristics of Teachers
105
IN THE 21 CENTURY Volume 6, 2008
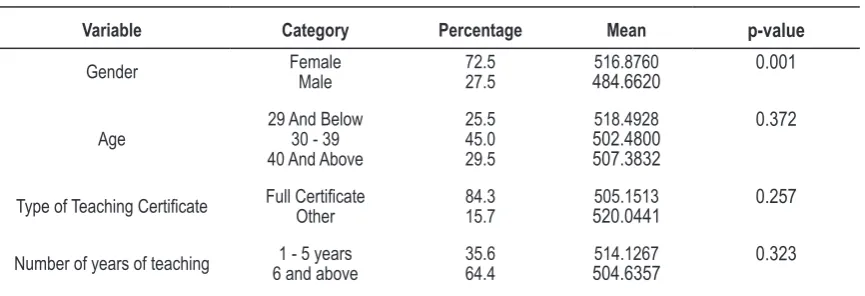
is significantly higher than those taught by male teachers.
About 45 per cent of the teachers were in their thirties and only a quarter was below 30 years old and about a third was 40 and above, indicating that there was a slow replenishing of the teaching force. However, there were no significant differences in mean scores of students who were taught by different age group of teachers.
In Malaysia, more than 90 per cent of the teachers were certified. Out of these teachers, 84 per cent of them had a full certificate. It was also found that the differences in mean scores of students taught by fully certified teachers and those who were taught by teachers with other certification were not significant.
More than 60 per cent of Malaysian students were taught by experience teacher, that is, teacher with more than five years of teaching experience. However, it was found that teaching experience does not affect mathematics scores for Malaysian eighth grade students (Table 1).
table 1. Background characteristics of teachers.
Variable Category Percentage Mean p-value
Gender FemaleMale 72.527.5 484.6620516.8760 0.001
Age 29 And Below30 - 39
40 And Above
25.5 45.0 29.5
518.4928
502.4800 507.3832
0.372
Type of Teaching Certificate Full CertificateOther 84.315.7 520.0441505.1513 0.257 Number of years of teaching 6 and above1 - 5 years 35.664.4 504.6357514.1267 0.323
Preparation for Teaching Mathematics
This section presents teacher’s reports on their preparation to teach mathematics. The informa
-tion includes highest educa-tional level of mathematics teachers, prepara-tion to teach mathematics and their participation in professional development in mathematics. Then, an investigation on how these factors associated to mathematics achievement is carried out. Table 2 shows that almost two-third of students were taught by teachers having at least a university degree or equivalent (ISCED 5A, 5B and above). Notwithstanding, the study found that education level of mathematics teacher does not affect mathematics achievement. In addition, the average mathematics score is higher for students who were taught by teachers without university education than those taught by teachers with at least a university degree. There was also no significant difference in mathematics achievement among students who were taught by teachers majoring in mathematics or mathematics education in their postsecondary education and those who were taught by teachers not majoring in either one of these areas. Table 2 also shows that less than half of the teachers studied mathematics or mathemat
-ics education.
TIMSS also presented opportunities provided to teachers in five major areas: improving content knowledge, improving teaching skills, supporting implementation of the official curriculum, using technology in mathematics teaching and participating in developing mathematics assessment. Around two-third of the teachers were involved in improving content knowledge, improving teaching skills and supporting implementation of mathematics curriculum. The percentages of those involved in using technology and participating in developing mathematics assessment are 48 per cent and 28 per cent respectively. The use of computers in school is still at an initial stage in Malaysia since there was lack of computers available in schools and the number of teachers trained in this area was not enough. Only 5 per cent of the classes had computer available in mathematics lesson.
Being taught by teachers who were involved in developing their expertise in mathematics con
106 teachers involved in developing their expertise in pedagogy, technology and mathematics assess -ment.
table 2. Preparation of teaching Mathematics and Professional development.
Variable Category Percentage Mean p-value
Highest education level of mathematics teacher ISCED 5A,5B and At most ICSED4B 36.5 498.6347 0.209
above 63.5 512.1432
Preparation to Teach Mathematics
Mathematics is the teachers’ major area of study YesNo 45.654.4 507.989508.038 0.996
Mathematics Education is the teachers’ major area
of study YesNo 48.351.7 514.714500.844 0.131 Teachers’ participation in Professional Development in Mathematics
Math Content Yes 67.1 515.902 0.013
No 32.9 491.910
Math Pedagogy Yes 63.1 513.849 0.096
No 36.9 498.036
Math Curriculum Yes 64.9 517.005 0.009
No 35.1 491.941
IT into Math Yes 48.0 510.601 0.604
No 52.0 505.783
Math Assessment Yes 28.2 514.097 0.408
No 71.8 505.623
Classroom Characteristics and Instruction
This section provides information about class size, limitations on instruction, instructional strategies and roles of homework and assessment. Teachers and the instructional approaches they use determine the mathematics students learn and may affect students’ performance in mathematics.
On average, the class size in Malaysian secondary school is 36 with standard deviation of 5.4 and a minimum of 19 students and a maximum of 49 students in a class. This average is quite big considering the average class size across countries was 30 students. Hence a small class size is defined as a class size of 30 and below, otherwise, it is considered as a large class size. It was found that there was no significant difference in average score in mathematics between small and large class size in Malaysia (Table 3). The effect of class size may be more prevalent among low-achieving students, elementary school students and students from low socio-economic background. In Malaysia, almost 55 per cent of the classes were reported as having a little or less challenging and diverse students in the class or high index of teacher’s reports on teaching mathematics classes with few or no limita
-tion on instruc-tion due to student factors (MCFL). The index is based on teachers’ responses to six statements about student factors limiting mathematics instruction: students with different academic abilities, students who come from a wide range of backgrounds, students with special needs, unin
-terested students, low morale among students and disruptive students. The results also show that the average mathematics achievement is related to the impact of student characteristics on classroom instruction, with higher achievement related to having high index of MCFL, which implies having less instructional challenging and diverse students in the class. Then low index constitutes around 8 per cent of the classroom and this is quite low as compared to an international average of 20 per cent in this category.
Table 3 also shows the use of textbook and activities most commonly encountered in mathemat
-107
IN THE 21 CENTURY Volume 6, 2008
book, however, does not affect mathematics performance of Malaysian students since all teachers using the same textbooks.
The instructional strategies in mathematics classes were also shown in Table 3. These strategies are reviewing homework, listening to lecture style presentation, working problems with teachers’ guidance, working problems on their own without teachers’ guidance, listening to teacher re-teach and clarify content or procedures, taking tests or quizzes, participating in classroom management tasks not related to the lesson’s content or purpose and any other student activities. The three most predominant activities were listening to teacher-style presentation which, on average, took up around 21 per cent of the time, work problem with teacher’s guidance around 21 per cent and student work
-ing problem on their own without teacher’s guidance around 16 per cent. The percentage time spent for each instructional strategy is divided into two categories: average percentage time and below, and above average percentage time. Having done that, it was found that only two strategies are significant. These strategies are reviewing homework and working problems own their own. A class that spend more than the average percentage time in reviewing homework had a significantly lower achievement as compared to a class that spent less than the average percentage time. On the other hand, the higher percentage time spent on working problem on own is related to higher achievement in mathematics.
Computer use in mathematics class was not popular among Malaysian students. Only 5.4 per cent of the students used computer. As mentioned earlier, this could be due to lack of availability of computers in most schools. On the other hand, more than half of the schools permitted the use of calculators in mathematics class. The use of calculator, however, does not significantly related to higher achievement in mathematics.
The amount of time students spend on homework assignments could affect mathematics achieve
-ment. Around 62 per cent of the students were in the high category of index of Teachers’ Emphasis on Mathematics Homework (EMH). However, the relationship between teachers assigning more homework and student having higher mathematics achievement was not significant.
In Malaysia, most teachers monitor whether or not the homework was complete and correct assignment and then give feedback to students but unlikely to have students correct their own home
-work in class, use home-work as a basis of class discussion and use home-work to contribute towards students’ grade or marks. Furthermore, more than 55 per cent gave mathematics test or examination on regular basis. However, none of these homework strategies had significant effect on mathematics achievement.
table 3. class size, Limitation on Instruction, Instructional strategies and Roles of
Homework and assessment.
Variable Category Percentage Mean p-value
Class size Small (30 and below) 12.1 521.5512 0.275
Large (31 and above) 87.9 506.1513 Index Of Teacher’s Reports On Teaching
Math-ematics Classes With Few Or No Limitation On
Instruction Due To Student Factors (MCFL)
High 54.4 529.6016 0.000
Medium 37.6 485.5834
Low 8.1 466.9453
Instructional Strategies
Use of Textbook As The Primary Basis For My Lessons 70.1 508.157 0.925
As a Supplementary
Resource 29.9 506.710
Reviewing Homework 12.89 and below 58.4 517.3823 0.015
Above 12.89 41.6 494.8626
Listening To Lecture Style Presentations 21.32 and belowAbove 21.32 63.136.9 505.9358511.5597 0.556
108 Variable Category Percentage Mean p-value
Working Problems On Their Own Without
Teach-ers’ Guidance 16.08 and belowAbove 16.08 56.443.6 498.6318520.1335 0.020
Listening To Teacher Re-teach and Clarify Con
-tent/Procedures 9.17 and belowAbove 9.17 43.057.0 514.0082503.4967 0.258 Taking Tests and Quizzes 8.21 and belowAbove 8.21 49.750.3 507.9081508.1139 0.982 Participating in Classroom Management Tasks
Not Related to the Lesson’s Content/Purpose 5.72 and belowAbove 5.72 75.224.8 512.9106493.1827 0.063
Other Student Activities 5.75 and belowAbove 5.75 70.529.5 510.8487501.2415 0.341
Calculator Use Yes 54.5 507.6834 0.875
No 45.5 509.1689
Roles of Homework and Assessment
Index of Teachers’ Emphasis on Mathematics
Homework (EMH) HighMedium And Low 61.738.3 508.4909507.2382 0.895 Monitor Whether or Not the Homework was
Com-plete
Always Or Almost
Always 89.9 510.5924 0.093
Sometimes 10.1 484.9579
Correct Assignments and then Give Feedback to
Students
Always Or Almost
Always 87.2 507.7258 0.778
Sometimes 12.8 503.8742
Have Students Correct Their Own Homework In
Class
Always Or Almost
Always 13.5 500.7295 0.574 Sometimes Or Never 86.5 508.2472
Use Homework As A Basis Of Class Discussion Always Or Almost Always 33.8 503.2306 0.532 Sometimes Or Never 66.2 509.2725
Use the Homework to Contribute Toward Students’
Grades/Marks Always And SometimesNever 32.467.6 510.0478505.8794 0.669
Frequency of Giving Mathematics Tests or Exami
-nation Once A Month Or MoreA Few Times A Year Or 55.4 511.4463 0.427
Never 44.6 504.0343
School Contexts For Learning and Instruction
TIMSS also collected information about the school contexts for learning and instruction. In
-formation includes the economic status of the students, the extent of school resources, the school climate, attendance problems and school safety. Table 4 presents principals’ report about the economic background of the students in their schools. More than 60 per cent of Malaysian students attended schools where the majority of the students came from disadvantaged homes. Other countries with similar situation are Chile, Ghana, Indonesia, Lebanon, Morocco, the Palestinian National Author
-ity, the Phillipines, South Africa and Tunisia. The mathematics scores are significantly higher for schools with few students (less than 10%) from economically disadvantaged homes than those with more students in this category.
Table 4 also shows the extent of school resources, perception of school climate and index of good school and class attendance. Although most of the school resources are not specific to math
-ematics, all available resources, however, can work together to support mathematics learning and instruction. TIMSS created an index of availability of school resources for mathematics instruction (ASRMI) based on school’s average response to five questions about shortages that affect general capacity to provide instruction and five questions about shortages that affect mathematics instruc
109
IN THE 21 CENTURY Volume 6, 2008
The results for the Index of Principals’ Perception of School Climate (PPSC) are shown in Table 4. The index was based on principal’s characterization of teacher’s job satisfaction, understanding of the school’s curricular goal, degree of success in implementing the schools’ curricula, expectation for students’ achievement, parental support for students’ achievement and involvement in school’s activities, students’ regard for school property and desire to do well in school. Majority of the stu
-dents were in the medium category where the principals characterized school climate as medium. In addition, high mathematics achievement was associated with high level of PPSC.
TIMSS developed an index of good school and class attendance (GSCA) in order to investigate absenteeism which can be related to less serious attitudes towards academic achievement. This index is based on schools’ responses to the seriousness of students’ absenteeism, arriving late at school and skipping class. The high level index implies schools reported that all three behaviors are not a problem. The low level indicates that two or more are serious problem, or two are minor problems and the third a serious problem. The medium category includes all other possible combinations of responses. The results in Table 4 shows around 69 per cent of students were in the medium category, indicating that student attendance is a serious problem in Malaysia. Another 19 per cent of the stu
-dents were in the high category and the rest were in low category. The result also implies that the high level of index was related to high score in mathematics.
The last factor that we are going to investigate is Index of Mathematics Teachers’ Perception of Safety in the Schools (TPSS). Since school safety is central in providing a conducive environment for learning, TIMSS asked both teachers and students to characterize their perceptions on safety in their school. We will only consider responses from teachers since this paper is only concerned with factor related to teachers and schools. Teachers were asked how much they agreed with statements: this school is located in a safe neighborhood, I feel safe at this school and this school’s security policies and practices are sufficient. If teachers agreed or agreed a lot to all three statements, then the students were placed in the high category. The low category referred to teachers disagreed or disagreed a lot to all three statements, otherwise, students were placed in the medium category. More than 83 per cent of Malaysian students were placed in the high category, indicating that teachers agreed or agreed a lot that the schools were safe. Notwithstanding, feeling safe did not relate to high achievement in mathematics.
table 4. Principals’ Report about the economic Background of the students in their
schools, school Resources, Perception of school climate and Good school and class attendance.
Variable Category Percentage Mean p-value
Students coming from economically disadvantaged
homes
0 To 10 8.0 549.3830 0.006
11 To 25 12.7 526.8228
26 To 50 16.0 513.1465
More Than 50 63.3 497.6376
Index of Availability of School Resources for Math
-ematics Instruction (ASRMI)
High 17.4 520.7601 0.441
Medium 70.5 505.6504
Low 12.1 503.5811
Index of Principals’ Perception of School Climate
(PPSC) High 17.6 537.6151 0.007
Medium 70.9 503.1126
Low 11.5 490.8208
Index of Good School and Class Attendance
(GSCA) High 18.7 531.0384 0.044
Medium 68.7 501.4766
Low 12.7 509.0602
Index of Mathematics Teachers’ Perception of
Safety in the Schools (TPSS) High 83.2 507.3910 0.764
110
conclusions and discussions
The results from this study can be summarized in Table 5. Students taught by female teachers had a significantly higher mathematics achievement and this could be one of the factors that placed
Malaysia in the 10th position since more than two-third of the students were taught by female teach -ers. Surprisingly, teachers’ maturity, certification, educational level and major of study were not significant in determining mathematics score among Malaysian students. This study also revealed that teachers’ participation in the professional in mathematics do not effect mathematics achieve
-ment except for those who were involved in developing mathematics content and curriculum. In other words, having teachers participating in these two activities would help the school to improve their students’ performance in mathematics. Hence, these two variables and gender were the only variables which are related to teachers that gave significant contribution in explaining the variation in mathematics achievement among Malaysian students.
The results also show that mathematics achievement is related to the impact of student char
-acteristics on classroom instruction, with lower achievement related to having more instructionally challenging and diverse students in the class and fortunately for Malaysia, only around 8 per cent of students are in this category as compared to 20 per cent of the students were in such classroom internationally. Class size and calculator use do not affect mathematics performance and this come as a blessing for Malaysian students as the its class size can be as large as almost 50 students and the average was 36 students per class which is relatively large as compared to the international average. The same goes for the use of calculators. Only a bit more than half of the students were allowed to use calculators in learning mathematics.
Despite of efforts of the Malaysian government in encouraging new approach in teaching, only one instructional strategy can improve the performance of students in mathematics. This strategy was asking students to work problems on their own. Spending a lot of time reviewing homework, on the other hand, had a negative relationship with having a high score in mathematics. However, it is believed that the effect of some of these strategies can only be observed in the long term. Table 5 also shows that the role of homework and assessment is not significant in determining the variation in mathematics achievement.
The other two variables related to schools that had positive relationship with mathematics achievement were Principals’ Perception of School Climate (PPSC) and Good School and Class Attendance (GSCA). For both variables, majority of Malaysian students were placed in the medium category. Hence there were still rooms for improvement in terms of job satisfaction level of teachers, commitment and motivation as well as parents’ support and involvement in students’ activities and students’ regard for school properties and desire to do well in school. Furthermore, schools or MOE should take action in improving school attendance.
table 5. summary of the Results.
Factors Significant Not Significant
Background of Teachers
Gender Age
Type of Teaching Certificate Preparation of Teaching Mathematics and Professional Development
Preparation of Teaching
Math-ematics Highest education level of mathematics teacher
Mathematics is the teachers’ major area of study
Mathematics Education is the teachers’ major area of
study
Professional
De-velopment Math Content Pedagogy
111
IN THE 21 CENTURY Volume 6, 2008
Factors Significant Not Significant
Math Assessment
Classroom Characteristics and Instruction
Index Of Teacher’s Reports On Teach-ing Mathematics Classes With Few Or No Limitation On Instruction Due To
Student Factors (MCFL)
Class Size Calculator use
Instructional
Strategies Reviewing homework Use of Textbook
Working Problems on Their Own Listening To Lecture Style Presentations Working Problems with Teacher’s Guidance
Listening To Teacher Re-teach and Clarify Content/
Procedures
Taking Tests and Quizzes
Participating in Classroom Management Tasks Not Related to the Lesson’s Content/Purpose
Other Student Activities
Roles of Home-work and Assess-ment
Index of Teachers’ Emphasis on Mathematics
Home-work (EMH)
Monitor Whether or Not the Homework was Complete
Correct Assignments and then Give Feedback to
Students
Have Students Correct Their Own Homework In Class
Use Homework As A Basis Of Class Discussion Use the Homework to Contribute Toward Students’ Grades/Marks
Frequency of Giving Mathematics Tests or Examina -tion
School Contexts For Learning and Instruction
Students coming from economically
disadvantaged homes Index of Availability of School Resources for Mathematics Instruction (ASRMI) -Index of Principals’ Perception of
School Climate (PPSC) Index of Mathematics Teachers’ Perception of Safety in the Schools (TPSS) Index of Good School and Class
Attend-ance (GSCA)
In conclusion, only nine variables had significant relationship with mathematics achievement and these variables are gender, participating in developing mathematics contents and mathematics curriculum, having few or no limitation on instruction, instructional strategies such as reviewing homework and working problem on their own, students coming from economically disadvantaged homes, perception on the school climate and good school and class attendance.
For the long term planning, the government of Malaysia should improve the standard of economi
-cally disadvantaged homes through education, training and economic activities. Since most of the students of disadvantaged homes come from rural area, the economic activities such as a well planned and structured agricultural activities should be initiated at the local governments’ level. Furthermore, economic activities should be spread over to rural areas and not concentrated in the urban area as what happened now. Furthermore, all teachers should be given a chance to be involved in designing and planning of mathematics contents and curriculum. It will not only improve the knowledge of teachers in mathematics but also boost their motivation and interest in the subject.
112
acknowledgement
The author would like to thank the TIMSS group for conducting such a comprehensive study and sharing the data with the public. However, the author bares full responsibility for any errors in this paper.
References
Angrist, J. and Lavy, V. (2001). Does Teacher Training Affect Pupil Learning? Evidence from Matched Com
-parisons in Jerusalem Public Schools. Journal of LaborEconomics, 19, 343 - 369.
Coleman, J., Campbell, E., Hobson, C., McPartland, J., Mood, A., Weinfeld, F. & York, R. (1966). Equality of Educational Opportunity. Washington D. C.: Department of Health, Education and Welfare.
Hanushek, E. (1997). Assessing the effects of school resources on student performance: An update, Education Evaluation and Policy Analysis, 19, 141 - 164.
Jacob, B. & Lefgren, L. (2002). The Impact of Teacher Training on Student Achievement:
Quasi-Experimental Evidence from School Reform Efforts in Chicago. NBER Working Paper No. 8916. Jepsen, C. & Rivkin, S. (2001). What is the Tradeoff Between Smaller Classes and Teacher Quality, Working paper, Public Policy Institute of California.
Monk, D. H. (1981). Towards a multilevel perspective on the allocation of educational resources. Review of Educational Research, 51(2), 215 – 236.
Mullis, I. V. S., Martin, M. O., Gonzalez, E. J. & Chrostowski, S. J. (2003). TIMSS 2003 International Math
-ematics Report: Findings form IEA’s Trends in International Math-ematics and Science Study at Fourth and Eighth Grades. Boston College: International Association for the Evaluation of Educational Achievement. TIMSS & PIRLS International Study Center.
Rivers, J. & Sanders, W. (2002). Teacher Quality and Equity in Educational Opportunity: Findings and Policy Implications, in Izumi & Evers (eds.), TeacherQuality, Stanford, CA: Hoover Institution Press.
Rivkin, S. G., Hanushek, E. A. & Kain, J. F. (2002). Teachers, schools, and academic achievement, Working paper, University of Texas at Dallas.
Adviced by Ali Reza Kiamanesh, Tarbiat Moallem University, Iran
Noor Azina Ismail Associate Professor at University of Malaya, Faculty of Economics and Administration, 50603 Kuala Lumpur, Malaysia.
Phone: +603 79673638. E-mail: nazina@um.edu.my