Recruitment and Professional Image
of Students at One of the Regional
Universities in Hungary
MIHÁLY FÓNAI
1Faculty of Law University of Debrecen
SÁNDOR MÁRTON
2Department Sociology and Social Politics University of Debrecen
TÍMEA CEGLÉDI
3Center for Higher Educational Research and Development University of Debrecen
Abstract
In this article we study the social recruitment and professional image of students at the University of Debrecen. Social recruitment shows significant differences between the faculties and the branches. The students in the high prestige faculties come from high-middle class and high-middle class families. The students of the faculties that were judged having average prestige are from the high-middle class and the rate of low-middle class students is significantly greater in branches with lower prestige. Important differences were found in the professional image of the students with an education major and not education majors and also in case of the „ideal professional” and the „practical, necessary knowledge”. Both are partly formed by the professional socialization of the students and partly by the stereotypes. As a consequence there are also big differences between the professional image and the future expectations of the students with an education major and with other majors attending the same faculty.
Keywords: Students, Gift Attendance Program, Recruitment, Prestige, Professional Image
In this study, we analyze some of the characteristics of the Gift Attendance Program (Talent Development Program) of the University of Debrecen4 regarding the recruitment of the students and the differences among
branches. First we introduce the purpose of the program and the mechanism of the „selection” procedures. The Gift Attendance Program of the University of Debrecen (hereinafter referred to by the Univesity abbreviation: DETEP) was launched in the 2000/2001 academic year. László Fésüs, the first rector of the integrated university5 had a decisive role in its initiation. He firmly believed
that as part of the integration, harmonization of the students’ gift attendance program (talent development program) should be very important among the faculties that formed the new institution (Balogh & Fónai, 2003, Márton et al., 2006). László Balogh, a recognized Hungarian expert became the professional leader of the program, having coordinated it until recently6.
How did the program operate? Admission into the program was an important element – our data reports on the result of this process. On the basis of the existing program until the fall of 2008, 20% of the best second year full time students based upon academic achievement were offered the possibility to participate in the selection process. This was the first screening phase of the program. During the second screening phase students had to complete psychological tests (Raven, Super work-value questionnaire), questionnaires about their opinions, information about their socio-demographic background and their professional motivation. Based on these results an index was calculated. This index formed the basis for the Faculties to be able to select those who they could „invite” to the next phase of the program. The third step was a professional interview led by the faculties. On the basis of these interviews the leaders of the faculties could decide who would get into the program. Using this process, 3650 students took part in the first step of the selection process through February 2009. Of the 3650 students, about 700 students were finally selected for the program, which means about 2% of all the second year full time students.
DETEP has dual goals. One is to help the most talented students become university professors and researchers and the other goal is to prepare excellent professionals for the sphere outside the university. The program’s most important elements are the same in each faculty: the professional, scientific work of the students is assisted by tutors, who help them form their educational studies and work with them until the realization awarding the degree. In addition, a professional translating program, career counseling, cooperation with “colleges for advanced studies” are part of DETEP. Each faculty provides important professional assistance to their students. The faculties and the university organize conferences and publish various types of publications to show the results of this professional activity. Students can obtain a scholarship and DETEP membership has other advantages as well: they have an advantage if they want to get a university grant, and they can apply for being faculty demonstrators7 and can also
enter PhD education. As a result of the professional and financial support remarkable work has been created. One of its signs is that the students of the program are succesful TDK8 (Scientific Student
Circle) contestants as well. The number of faculty demonstrators and scholarship winners is very high among them. We can say that students who were selected for the gift attendance program (Talent Development Program) became the most succesful students of the university, which proves the raison d’etre of the programme and shows its efficiency.
The program of course responds to the structural changes of higher education. As a result of the development of BSc programs and the emphasized tasks of the higher educational gift attendance programs (Talent Development Program) we have modified the program which takes the characteristcs of the BA and BSc education9 into consideration. The program has also formed
better contacts with other gift attendance programs (Talent Development Program) like “colleges for advanced studies” and TDK (Science Student Circle). Another further goal is to create a unified gift attendance program that was started in 2008. In our recent study we analyze some of the dimensions of the database of those 3183 students who took part in the selecting process in the „first phase”. Our analyses are mainly descriptive; one the comparisons was made among faculties and between students with an education and not an education major – we have other
6 Dr. Balogh László is the chair of the Hungarian Gift Attendance (Talent Development) Council and the expert of the „Gift Point” (Talent Point) of the University of Debrecen.
7 Such students who get scholarship for one semester and who take part in the educational organizational and research organizational and professional work of the faculties.
8 TDK is Science Student Circle: a professional-scientifi c competition organized in every second year, where students write studies and give conference lectures in several rounds.
comparative national data in case of student recruitment, and in other fields we have only few data (in this recent study we do not analyze the Super work-value test and the Raven test, but in these cases we might perfom comparative analyses on a certain level (see eg Fónai, Zolnai & Kiss, 2005, Fónai et al., 2010). In our further analyses referring to this topic, professionalization and career choice literature will form the interpretative frames.
Characteristics of the recruitment of students to the program
With respect to student recruitment the distributions according to faculties, genders, counties and the qualification of the fathers were analyzed. Distribution among the faculties more or less matches the rates of how many students attend each faculty. However, since the participants were volunteers the results could be distorted by the bias of the participation rates, and the fact that during the course of the research new faculties appeared (See: Appendix. Table A1). The number of the students of each faculty is modified by the time in which the faculty was established or the period for which it has been an individual faculty.
The distribution according to gender among those who got into the program and the overall number of students in the faculties (total number) shows considerable bias during the time of the study (from the 2001/2002 to the 2007/2008 school year)10. On the basis of the available
statistical data there were 27693 second year full time students during this period and of those there were 16371 women and 11322 men, that is 59.9% of the students were women and 40.1% were men. In case of the upper fifth there were 2140 women (67.4%) and 1033 men (32.6%) who were selected for the program of DETEP based upon their scholastic record.
This means that more women got into the selection process of the program than men. This phenomenon is explained by the scholastic record and the genders, and the well-known phenomenon according to which the school performance of women is better than that of men even in higher education, as well (Fényes 2010, Fényes & Ceglédi 2010). There are fewer differences in the distribution according to counties although slight differences can be seen according to the place of residence, as well (Table 1).
Table 1: Distribution of students according to counties (First seven counties)*
Counties Total number of students in a year
Those who entered the measurement process of DETEP person percentage person percentage
Hajdú- Bihar 11682 42,2 1082 39,7
Szabolcs-Szatmár-Bereg 5796 20,9 581 21,3
Borsod-Abaúj-Zemplén 3421 12,3 371 13,6
Jász-Nagykun-Szolnok 1480 5,3 156 5,7
Budapest 522 1,9 123 4,5
Békés 817 2,9 118 4,3
Heves 916 3,3 107 3,9
*N = 2728 (Not everybody gave the data of their residence)
Source: October statistics, University of Debrecen, Neptun students’ database
The University of Debrecen has strong regional ties. Six tenths of its students come from two counties and more than eight tenths are from the surrounding region. Territorial recruitment of students of course depends on the branches as well. In some cases certain branches regional ties are stronger and in other cases the schooling district is stronger. These tendencies are also prominent with the students who entered the measurement process. Only Budapest and the Békés County seem to differ slightly from this tendency. However, because of the lack of an adequate number of responses, conclusions must be carefully drawn and not infer that there was a large number of students from this area in proportion to the total students in a given year. The representation of the university in its own county given below is conspicuous. Anyway, the distribution of the sampled students according to their residence is close to that of the total number of second year students.
The difference is higher in case of the social recruitment of students. This type of secondary school seems to be definitely faculty and branch dependent. In case of branches (faculties) with higher prestige, the proportion of those who graduated from eight or six-grade secondary grammar schools is higher than in the case of the other branches, which mostly teach students from four-grade secondary gammar schools or secondary technical school. (See: Appendix A. Table 2).11
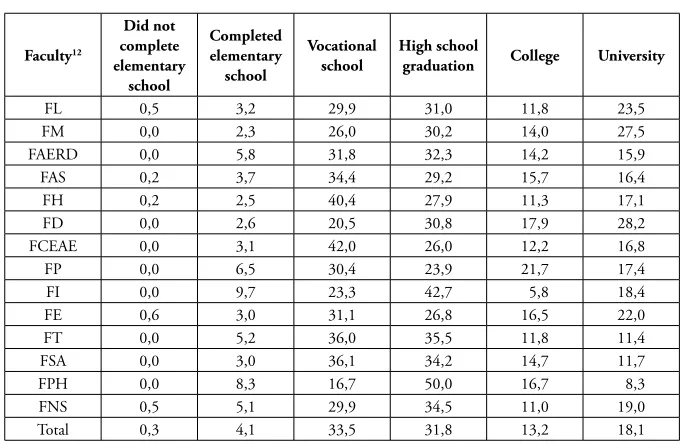
The fathers’ educational level shows the differences among faculties much more.
Table 2: Fathers’ educational level (percentage)*
Faculty12
Did not complete elementary
school
Completed elementary
school
Vocational school
High school
graduation College University
FL 0,5 3,2 29,9 31,0 11,8 23,5
FM 0,0 2,3 26,0 30,2 14,0 27,5
FAERD 0,0 5,8 31,8 32,3 14,2 15,9
FAS 0,2 3,7 34,4 29,2 15,7 16,4
FH 0,2 2,5 40,4 27,9 11,3 17,1
FD 0,0 2,6 20,5 30,8 17,9 28,2
FCEAE 0,0 3,1 42,0 26,0 12,2 16,8
FP 0,0 6,5 30,4 23,9 21,7 17,4
FI 0,0 9,7 23,3 42,7 5,8 18,4
FE 0,6 3,0 31,1 26,8 16,5 22,0
FT 0,0 5,2 36,0 35,5 11,8 11,4
FSA 0,0 3,0 36,1 34,2 14,7 11,7
FPH 0,0 8,3 16,7 50,0 16,7 8,3
FNS 0,5 5,1 29,9 34,5 11,0 19,0
Total 0,3 4,1 33,5 31,8 13,2 18,1
* Up till now 13 students participated in the measurement processes from the Faculty of Public Health – their data cannot be analized but we report them in the whole study.
11 In Hungary, eight–grade secondary grammar schools were established again in the 1990s. Before 1945 Hungary had such secondary grammar schools. Also, in the 1990s six-grade secondary grammar schools were established. Th ey are called „structure changing” schools. In secondary technical schools besides passing the fi nal exam, there is professional pre-training as well.
The rate of the fathers with vocational school is higher in the college and the agricultural faculties than in case of the other faculties. The rate of the fathers with high school graduation is the highest in the Faculty of Informatics, this is the typical educational level – in this faculty the educational level of two thirds of fathers is maximum high school graduation. The rate of fathers with college graduation is higher in the Faculties of Arts and Sciences, Economics, Dentistry and Pharmacy, while the rate of fathers with university degree is the highest in the faculties of Dentistry, Medicine, Law and Economics. It seems that there is a substantial connection between the type of the secondary school, the fathers` educational level and the faculties – children of fathers with higher educational level graduated from secondary schools with higher prestige and they attend branches with higher prestige as well.
The educational level of mothers differs from that of fathers in two ways. The rate of mothers with vocational school education is lower and the rate of mothers with high school graduation or mainly with college degree is higher, while the rate of mothers with university degree is lower than in case of fathers – these tendencies correspond to the marriage pattern of the last decades when a skilled worker father married a woman with high school graduation or when the mother with high school degree or college degree usually married a father with a university degree. The rate of fathers and mothers with high educational level is the highest in the faculties of law and medicine. These are the faculties where the difference is the smallest between the educational levels of the parents.
Table 3:Mothers’ Educational Level (percentage)
Faculty
Did not complete Elementary
School
Completed Elementary
School
Vocational School
High School
Graduation College University
FL 0,5 7,2 20,1 29,9 18,6 20,6
FM 0,0 5,5 14,2 31,4 23,4 23,0
FAERD 0,4 6,7 24,7 33,5 25,5 11,3
FAS 0,0 5,5 21,4 36,2 21,1 12,3
FH 0,0 7,1 21,7 36,8 17,8 11,5
FD 0,0 2,6 15,4 33,3 23,1 23,1
FCEAE 0,0 4,5 21,0 45,1 18,0 9,8
FP 0,0 10,4 14,6 20,8 29,2 22,9
FI 0,0 2,7 12,7 42,7 20,9 16,4
FE 0,6 3,5 16,9 36,6 21,5 18,0
FT 0,0 7,3 23,4 40,4 17,9 7,3
FSA 0,4 5,0 22,0 40,4 20,9 7,1
FPH 0,0 7,7 15,4 30,8 15,4 23,1
FNS 0,1 5,7 16,6 37,6 22,2 13,5
Total 0,2 5,7 19,0 36,5 21,2 13,7
Source: DETEP, 2002-2008
Recruitment of students with an education major
would identify if the students want to become teachers after graduation. The identificatoin of this group could only be made on the basis of their selection of their main or sub-branch area of study. In case of certain branches it was clear, but in case of other branches identification was more difficult. At the beginning of the 2000’s „having just one major” became very popular. Selection of just one major did not in istelf provide any information because the students had not picked the necessary specialization courses that were needed to become teachers and would allow for identification. Thus, the identification of students with education major remained within narrow frames, that is information about the students was investigated individually to decide whether they were students with an education major or not.
Table 4:Distribution of students according to branches
Person Percentage in the whole sample Faculty of Arts, education
major
200 6,3
Faculty of Arts, non- education major
204 6,4
Faculty of Natural Sciences, education major
104 3,3
Faculty of Natural Sciences, non-education major
467 14,7
With other majors: 2218 69,3
Source: DETEP, 2002-2008
With reference to gender it was predicted that more women will choose to become teachers than men (Figure 1). This prediction was supported. There was a significant difference (p < 0.00) in gender between students with education and non-education majors.
0 10 20 30 40 50 60 70 80
FA ed.maj
FA non ed.maj.
FNS ed. Maj.
FNS non ed.
Maj. with other majors
Total
men women
Source: DETEP, 2002-2008
Figure 1:Distribution of students according to gender (percentage)
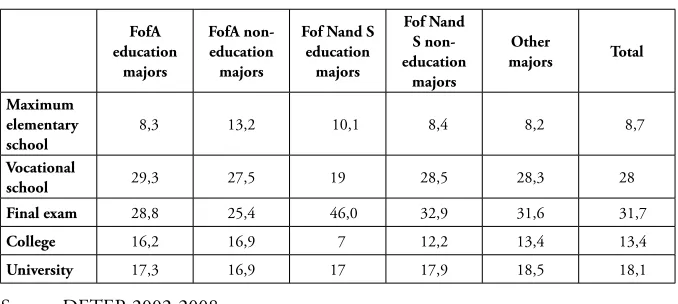
patterns of their parents including school graduation fits the pattern of the 1960s-80s. These hypotheses were partially confirmed after comparing the family background of students with an education major to other majors. It was found that more students who were not education majors have fathers with a degree. Students with an education major are more likely from (lower) middle-class (with final exam or skilled worker) families. A comparison between the Faculty of Arts and the Faculty of Natural Sciences shows that in the Faculty of Natural Sciences only a small proportion of students have fathers with college or university degrees. This is also the case for students who are not not education majors but it is more striking in the case of students with an education major (Table 4).
Table 4: Fathers’ Educational Level according to Faculties (percentage)
FofA education
majors
FofA non- education majors
Fof Nand S education
majors
Fof Nand S non- education
majors
Other
majors Total
Maximum elementary school
8,3 13,2 10,1 8,4 8,2 8,7
Vocational
school 29,3 27,5 19 28,5 28,3 28
Final exam 28,8 25,4 46,0 32,9 31,6 31,7
College 16,2 16,9 7 12,2 13,4 13,4
University 17,3 16,9 17 17,9 18,5 18,1
Source: DETEP, 2002-2008
Compared to the national average at the end of the 90’s there are more applicants to the program today in higher education with low-educated parents (Róbert Péter mentions similar processes – compare: Róbert, 2000).
The annual October statistics report of higher educational institutes refers only to the counties of the students’ residence, thus a comparative analysis can only be made on the basis of national representative examinations (Róbert, 2000). Based upon this data the rate of students with an education major whose parents completed only secondary school (with final exam) is less than the national average on Faculty of Arts and much higher on Faculty of Natural Sciences.
A significant characteristic of the students with an education major in the Faculty of Natural Science is that they belong to the non-degree holder families (middle and upper-middle class) and not to the lower social groups (who completed 8 classes of elementary school or skilled workers).
In this faculty a teacher’s career will be chosen mainly by the children of those fathers who graduated from secondary school and passed final exam. This rate is higher than in the Faculty of Arts and reflects a middle-class position. Those students who attend the Faculty of Natural Science and whose fathers are skilled workers prefer to be non-education majors. One must take into consideration that in this sample the number of students with a non-education major in the Faculty of Nature and Sciences is four times higher (467 persons) than the number of students with an education major (104 persons).
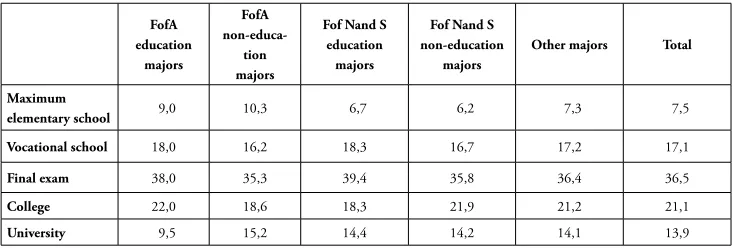
The educational level of fathers differs more between the two groups examined in this study than the educational level of mothers. It is worth pointing out the effect of the mothers’ educational level on the selection of a teaching career. Among BA students there are remarkably few students with an education major whose mothers graduated from universities (Table 5.).
Table 5: Mothers’ Educational Level according to Faculties (percentage)
FofA education
majors
FofA
non-educa-tion majors
Fof Nand S education
majors
Fof Nand S non-education
majors
Other majors Total
Maximum
elementary school 9,0 10,3 6,7 6,2 7,3 7,5
Vocational school 18,0 16,2 18,3 16,7 17,2 17,1
Final exam 38,0 35,3 39,4 35,8 36,4 36,5
College 22,0 18,6 18,3 21,9 21,2 21,1
University 9,5 15,2 14,4 14,2 14,1 13,9
Source: DETEP, 2002-2008
Students’ view of the prestige of an education major
In the assessment of their own faculty we expected that the ranks13 will be based upon the
ranks within the university and the prestige of certain branches. This rating is closely related to the prestige of those professions and the selected branches with the ranking formed by mutual perception, stereotypes and prejudices (Figure 2).
7,47
5,63
7,52
6,06
7,29
5,31
7,14
5,81
7,47 6,28
0 1 2 3 4 5 6 7 8
FofA edu.maj. Fof Art non Fof NS edu. Fof NS non Total sample
Source: DETEP, 2002-2008
Figure 2:The prestige ranking of branches - self-ranking and sensed outside ranking (on a ten-grade
scale)
There is a general tendency for students to perceive that their branches are ranked lower by others
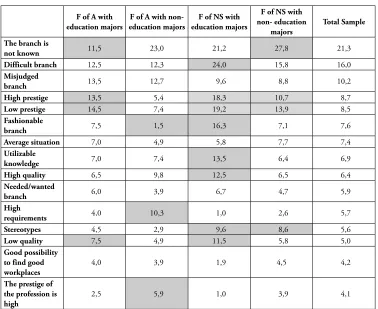
then they themselves rank the branch. It can be the perception that they as a group think that others do not know their branches and this is the reason why others do not rank them higher. In case of those branches where the professions built on the selected branch have low social prestige students believe that this is the reason of their low ranking by others. Meanwhile they themselves think that although the prestige of the selected branch is really low or moderate, the branch itself is difficult and the education is of high quality – there are few branches where students would rank themselves and their branches low as well. The summary of their opinion is that only those who can judge the situation of branches in a real way are those who are inside and part of it and that they perceive outside ratings as based upon stereotypes; it is a normal group sociological phenomenon. The justification for why others rank their branches at certain levels agrees with why and how they themselves evaluate their own branches. A common justification is that others do not know the branch, and the branch is difficult or fashionable. There are significant differences in other rankings like prestige, utilizable knowledge and how they can find good workplaces. Let’s explore to see the factors associated with the branch rankings, first of all the self-ranking (Table 6, Table 7).
Table 6:Why is your branch ranked here. Reasons of the external perceptions (answers given to open-
ended question – the first 15 statements. Percentage: the rate of those who have agreed with the given statement in percentage)
F of A with education
majors
F of A with non-education
majors
F of NS with education
majors
F of NS with non-education
majors
Total Sample
Utilizable knowledge 8,5 12,3 14,4 15,6 14,6
Th e branch is not known 7,5 10,3 18,3 13,7 13,3
Diffi cult branch 10,0 8,3 15,4 16,1 13,0
Fashionable branch 13,0 7,8 20,2 15,2 10,9
High quality 12,5 12,7 7,7 9,0 10,2
Average branch 11,5 3,9 7,7 8,8 9,9
Needed/wanted branch 14,5 5,9 9,6 10,7 9,3
Good possibilities to
fi nd good workplaces 5,0 7,4 2,9 7,9 9,1
High requirements 8,5 11,3 4,8 8,4 9,0
Low level 9,5 10,3 20,0 9,6 7,7
Profession with high
prestige 7,0 9,8 2,9 4,5 7,2
High quality education 9,0 4,9 11,5 7,9 7,0
High prestige 9,5 8,8 16,3 7,5 6,7
Recognized professors 18,5 7,8 7,7 6,4 5,7
Misjudged branch 4,0 8,8 4,8 3,6 5,2
Table 7:Why is your branch ranked here. Reasons of the external perceptions (answers given to open-ended question – the first 15 statements. Percentage: the rate of those who have agreed with the given statement
F of A with education majors
F of A with non- education majors
F of NS with education majors
F of NS with non- education
majors
Total Sample
The branch is
not known 11,5 23,0 21,2 27,8 21,3
Difficult branch 12,5 12,3 24,0 15,8 16,0
Misjudged
branch 13,5 12,7 9,6 8,8 10,2
High prestige 13,5 5,4 18,3 10,7 8,7
Low prestige 14,5 7,4 19,2 13,9 8,5
Fashionable
branch 7,5 1,5 16,3 7,1 7,6
Average situation 7,0 4,9 5,8 7,7 7,4 Utilizable
knowledge 7,0 7,4 13,5 6,4 6,9
High quality 6,5 9,8 12,5 6,5 6,4
Needed/wanted
branch 6,0 3,9 6,7 4,7 5,9
High
requirements 4,0 10,3 1,0 2,6 5,7
Stereotypes 4,5 2,9 9,6 8,6 5,6
Low quality 7,5 4,9 11,5 5,8 5,0
Good possibility to find good workplaces
4,0 3,9 1,9 4,5 4,2
The prestige of the profession is high
2,5 5,9 1,0 3,9 4,1
Source: DETEP, 2002-2008
Essential differences between their own ranking and the ranking made by others (supposed) can partly be explained by the external perceptions of the profession – one of its manifestations can be seen in the mutual ranking. If the difference can be explained by the situation of the potential professions, that is by the stereotypes and perceptions about their situations, then we can say that the ranking of students with an education major indicates that loss of status has occurred in the case of teaching profession.
self-image: besides having a high level and requirements (more characteristic), low levels appear as well. However, this bi-polar self-image is a warning sign. The question is what it is to do to about it and this study was not able to answer this question. One conclusion that may be drawn is that the more motivated students with better grades feel the problems of the scientific teacher’s education of recent years, the smaller is the students’ interest and the number of the students who can be admitted. It can probably indicate a split between the students with an education major and with other majors, and there will be a well performing and more talented group and a worse performing group. The students who are not education majors of the Faculty of Nature and Science have a more coherent self-image: they consider their branch more difficult, helping them to find better workplaces – but at the same time it is as if they felt that external ranking did not take it into consideration, and that there are many stereotypes in the judgements.
Characteristics of students with an education major and that of teachers as professionals
During our measurement procedure we examined how the students see their own profession. In the questionnaire they had to characterize the knowledge and characteristics of the „good professional” necessary to their own branch. Characterization of the “good professional” was mainly the characterization of the “ideal” professional. Moreover, students were asked to describe practical knowledge: “what characteristics and knowledge they consider to be important to their selected profession”. In both cases open-ended questions were used and were coded by about thirty key words: among them the ranking of the first fifteen will be introduced and analyzed (Appendix Tables A3 and A4).
Overall, the characteristics of the “ideal professional”, “professionally prepared” and “informed” were rated the highest by students. The practical expectation is similar with “thorough professional knowledge”, the dominant characteristic overall from all the professions and in addition general awareness and good communication had important roles. The characterization of the „ideal professional” was depicted in a more plastic way; the role of other components was more significant in this case.
Students with an education major of the Faculty of Arts characterized the “ideal professional” as being informed, flexibile, with extensive knowledge, helpful, with good interpersonal skills and empathic. For this same group, in case of „practicum” they underline communication, knowledge of languages, empathy and openness. In this group the two „images” partially coincide. The „good professional” for the students with an education major in the Faculty of Nature and Sciences is flexible, helpful, likes his profession, while “practical” knowledge and ability require awareness, language knowledge, practical skills and synthesizing ability. There are requirements that are independent of the faculties and that are equally important for students with teacher major in both the Faculty of Arts and the Faculty of Natural Sciences, such as flexibility, awareness and language knowledge.
In the “Faculty of Arts” speciality is independent of whether they are an education major or not: an „ideal professional” has good interpersonal skills, is empathic, open and man-centered. The particular view of the Faculty of Nature and Sciences is that the “ideal professional” is a good professional, well-prepared, likes their job, is practical and has the ability to synthesize. These characterisics seem to fit the real differences between the branches and the professions which are significantly modified by the stereotypes about professions.
Would students select their current branch again? Answers to this question are appropriate to the characterization of the satisfaction, the students’ expectations and their career aspirations as well. Slightly more than half (53%) of the students with an education major in the Faculty of Arts would select their branch again while the three fourths (76%) of students without an education major would select their branch again. Among students with an education major in the Faculty of Nature and Sciences, this percentage is much lower. Fourty-four percent (44%) of students with an education major and 64% of students who have another major would select their branch again. Compared to 69% of the total sample this result is distressing. Students with an education major are more dissatisfied than students with other majors and students in the Faculty of Nature and Sciences are more dissatisfied than students in the Faculty of Arts. Students with an education major had been admitted before the „Bologna system”, so their dissatisfaction was developed during the previous teachers’ training system. In addition, the loss of status of a teacher’s career must have affected their opinions as well.
The students feel it – it is supported by the university rankings and the expectations to the future of their selected profession as well (Ceglédi & Fónai, in press) Furthermore, it is also supported by the causes of the students as well (Appendix, Tables A5 and A6). Those who would select their profession again would do it because of the possibility of their profession and because they have plans for it. Students with an education major stressed the diversity of the profession and considered it important that they got what they had expected and in their case a degree itself is important as well. Those who would not select their branch emphasized the quality of the education and the low salary prospects – thus, there is a rejection of the education and not only to the profession. It is worth taking these results and students’ expectations into consideration for example in connection with the „laic” judging of the professional competencies.
What is considered to be important during university years?
The question regarding what students who would like to be teachers consider to be important during the university years was important to investigate. There are many different values that can be found within the statements listed in this block of the questionnaire. The answers to those questions help to understand the teacher’s career point of view. Statements are about human values, professional plans and individual ambitions of the future teachers. The statements that first were thought to be irrelevant brought surprising results. The students had to evaluate the following statements relevant to the univeristy years on a four point scale. The overall ratings from the most important to the least important follows: friendly relationships, good average grades, forming relationships that can be fruitful for the future, the degree itself, preparing for the profession, TDK (Science Student Circle) work, recognition from the professors, recognition from the students, the city’s opportunities, foreign scholarship, using the educational possibilities, quiet life, „just to hang on”, exciting parties (Appendix, Table A7).
From among the indicators of effectiveness rather the individual career building is stressed (TDK, Scientific Student Circle, and abroad) while the preparation to the profession relegated to a lower position. The importance of the recognition of professors and students is about average in their cases. Although the opportunities in the city were valued important by all students who were non-education majors in both faculties rated “exciting life and parties” higher than non-education majors. They use the educational possibilities less than their fellows in the faculty but the difference in comparison with the Faculty of Arts is larger: future teachers learning at the Faculty of Arts evaluated this statement about 0.4 higher. The preference for a classical art education can be well observed in the case of a student in the Faculty of Arts and mainly in the case of students with a non-education major. Friendly relations are more important for liberal arts students than natural science students.
As regards free time we can say that students with education major are more inclined to have a „quiet life, just hang out” attitude and against „exciting life and parties” than students with a non-education major. The importance of friendly relations is about average or lower among students with non-education majors (the judgment of professional relationship building is similar to friendly relations).
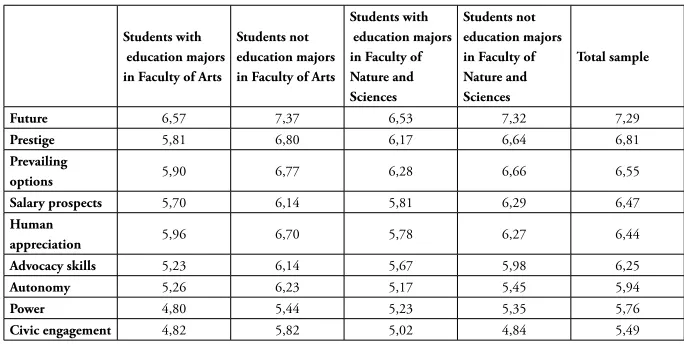
The situation of the profession
It appears that students with an education major expect relatively low prestige and income and little power from the profession. But at the same time the following question arises: „OK, it is bad but does it have any future?” Why do those who select the more and more depreciating teacher’s career evaluate higher than those who select other careers? This study has tried to bring some light to the issues of ambivalency and incongruency in the teacher career’s image.
Table 8:”What do you see the professions’s …”(on a ten point scale)
Students with education majors in Faculty of Arts
Students not education majors in Faculty of Arts
Students with education majors in Faculty of Nature and Sciences
Students not education majors in Faculty of Nature and Sciences
Total sample
Future 6,57 7,37 6,53 7,32 7,29
Prestige 5,81 6,80 6,17 6,64 6,81
Prevailing
options 5,90 6,77 6,28 6,66 6,55
Salary prospects 5,70 6,14 5,81 6,29 6,47
Human
appreciation 5,96 6,70 5,78 6,27 6,44
Advocacy skills 5,23 6,14 5,67 5,98 6,25
Autonomy 5,26 6,23 5,17 5,45 5,94
Power 4,80 5,44 5,23 5,35 5,76
Civic engagement 4,82 5,82 5,02 4,84 5,49
Source: DETEP, 2002-2008
Summary
Social recruitment shows significant differences between the faculties and the branches. The students in the high prestige faculties come from high-middle class and middle class families. The students of the faculties that were analysed having average prestige are from the middle class and the rate of low-middle class students is significantly greater in branches with lower prestige. This has significant impact not only on the judgment of the faculties and branches, but on the career image as well – the career image of those students who come from higher status families is less ambivalent and incongruent. These processes can substantially be altered by the real situation and the contradictions of the profession itself. The best example of it is the situation of the medical students.
References
1. Balogh, L., & Fónai, M. (2003). Tehetséggondozási formák a Debreceni Egyetemen [Talent Development Forms at the University of Debrecen]. Magyar Felsőoktatás, 13 (4-5-6), pp. 13-15.
2. Balogh, L. (2009). A Debreceni Egyetem Tehetséggondozó Programja 2001-től napjainkig [Talent Development Program of University of Debrecen from 2001 to the present year].
Educatio, III, pp. 174-187.
3. Ceglédi, T., Fónai, M. A tanári szakma értéke – tanár és nem tanár szakosok véleménye. III. [The Value of the Teaching Profession–Opinion of Students with an Education Major]. Miskolci Taní-tani Konferencia, Miskolc (in press).
4. Fényes, H. (2010). A nemi sajátosságok különbségének vizsgálata az oktatásban. A nők hátrányainak felszámolódása?[Investigation of Gender Peculiarities and Differences in Education. Elimination of Disadvantages of Women?] Debrecen: Debreceni Egyetemi Kiadó.
5. Fényes, H., Ceglédi, T. (2010). Fiúk és lányok iskolai eredményességének különbségei [Differences in School Efficiency of Boys and Girls]. In A. Buda, & E. Kiss (Eds.),
Interdiszciplináris pedagógia, tanárok, értelmiségiek. Kiadja a Kiss Árpád Archívum Könyvsorozata (VI. kötet) és a Debreceni Egyetem Neveléstudományok Intézete.
6. Fónai, M. (2009). A Debreceni Egyetem Tehetséggondozó Programjába került hallgatók rekrutációja és a szakok értékelése [Recruitment of Students Admitted to the Talent Development Program of the University of Debrecen and Evaluation of Branches]. In J.-T. Karlovitz (Ed.), Speciális kérdések és nézőpontok a felsőoktatásban. (pp. 49-65). Budapest: Neveléstudományi Egyesület.
7. Fónai, M. (2009). Students’ Stereotypes and Elements of Views of Profession at the University of Debrecen. In Á. Ferencz, & F. Erdei (Eds.), V. Tudományos Konferencia (pp. 1049-1054). III. kötet, Kecskemét, Kecskeméti Főiskola Kertészeti Főiskola Kar.
8. Fónai, M. (2010). Hallgatók professzió-képének elemei [Elements of the View of Profession of Students]. In T. Kozma, & I. Perjés (Eds). Új kutatások a neveléstudományokban. Többnyelvűség és multikulturalitás (pp. 227-246). Budapest: Aula Kiadó.
9. Fónai, M., Kiss, J., Márton, S., & Zolnai, E. (2010). Characteristics of Work Value Choices of University Students. In A. Anita, & I. Semsei (Eds). Twenty Years of Health Care Education and Social Sciences at the Faculty of Health Medical and Health Science Center University of Debrecen (pp. 38-60). Nyíregyháza, Faculty of Health Medical and Health Science Center University of Debrecen.
11. Fónai, M., Márton, S. (2010, January 29). Tanár szakos hallgatók professzió-képének elemei [Elements of View of Profession of Students with an Education Major]. Miskolc: III. Miskolci Taní-tani Konferencia (forthcoming).
12. Fónai, M., Zolnai, E., & Kiss J. (2005). A hallgatók munkaérték preferenciái. [Work value preferences of Students], In G. Pusztai (Ed.). Régió és oktatás európai dimenzióban. (pp. 190-205). Debrecen: Doktoranduszok Kiss Árpád Közhasznú Egyesülete.
13. Márton, S., Mező Ferenc, Balogh, L., & Fónai, M. (2006). A Debreceni Egyetem Tehetséggondozó Programja és beválogatási szempontjai [The Talent Development Program of the Univesity of Debrecen and their Selection Criteria]. In L. Balogh, F. Mező, & L. Tóth (Eds.), A Debreceni Egyetem Tehetséggondozó Programjának II. Konferenciája. Tanulmányok
(pp. 7-12). Debrecen: Debreceni Egyetem.
14. Róbert, P. (2000). Bővülő felsőoktatás. Ki jut be? [Expanding Higher Education. Who does get in?], Educatio, pp. 79-94.
Annexes
Table A1: The distribution of students who were in the first phase of DETEP according to faculties*
Faculty Person Pecentage
Faculty of Agricultural Economics and
Rural Development, 239 7,5
Faculty of Law 195 6,1
Faculty of Medicine 274 8,6 Faculty of Arts and Sciences 511 16,1 Faculty of Health 253 7,9 Faculty of Dentistry 39 1,2 Faculty of Children’s Education and
Adult Education 133 4,2
Faculty of Pharmacy 48 1,5 Faculty of Informatics 110 3,5 Faculty of Economics 172 5,4 Faculty of Sciences of Agriculture 283 8,9 Faculty of Technology 220 6,9 Faculty of Public Health 13 0,4 Faculty of Natural Sciences 689 21,37
Total 3183 100,0
Table A2: The distribution of the students accoring to the type of the secondary school (percentage)
Faculty
Four grade secondary grammar school
Six-grade secondary grammar school
Eight-class secondary grammar school
Secondary
technical school Youth division
FAERD 38,8 31,8 9,3 18,7 0,5
FL 48,5 35,5 8,3 4,1 1,2
FM 46,4 36,5 12,9 0,4 0,0
FAS 44,4 36,5 8,8 6,8 0,9
FH 54,0 17,4 5,4 24,1 3,1
FD 51,4 29,7 8,1 0,0 0,0
FCEAE 41,9 24,8 2,9 23,8 1,9
FP 54,5 31,8 11,4 4,5 0,0
FI 45,5 17,3 2,7 31,8 0,0
FE 44,3 26,4 9,3 17,1 3,6
FSA 39,5 36,3 4,9 14,4 0,8
FT 33,1 8,4 2,8 52,2 2,2
FPH 76,9 0,0 0,0 15,4 7,7
FNS 41,7 36,7 9,2 8,0 0,9
Total 43,8 30,6 7,8 14,4 1,2
Source: DETEP, 2002-2008
Table A3: „What makes a good professional?” (answers to open-ended question – the first 15; percentage; those who agree with the given statement)
Students with education major in Faculty of Arts
Students not education major in Faculty of Arts
Students with education major in Faculty of Nature of Sciences
Students not education major in Faculty of Nature and Sciences
Total sample
Professionally
prepared 31,0 42,6 32,7 40,0 39,7
Informed 40,0 27,5 26,0 26,1 30,0
Flexible 26,5 19,6 26,9 16,3 17,9
Dedicated 12,5 14,7 13,5 14,6 11,9
Extensive
knowledge 13,5 7,4 8,7 15,6 10,6
Preceise 4,0 1,5 2,9 15,2 9,3
Helpful 8,0 6,4 9,6 5,1 9,3
Empathic 8,0 17,6 8,7 3,0 8,6
Able to develop 7,0 11,8 2,9 11,8 8,2
Likes his job 9,0 7,4 16,3 11,6 8,0
Good interpersonal skills
11,5 11,8 8,7 3,9 7,9
Purposeful 8,0 5,9 6,7 7,5 7,4
Creative 6,5 11,8 8,7 6,4 6,5
Reliable 2,0 3,9 ─ 2,4 3,9
Determined 4,0 2,0 ─ 1,5 3,0
Table A4: “Knowledge and abilities” (answers to open-ended question – the first 15; percentage; those who agree with the given statement)
Students with education major in Faculty of Arts
Students not education major in Faculty of Arts
Students with education major in Faculty of Nature of Sciences
Students not education major in Faculty of Nature and Sciences
Total sample
Th oroughful
professionaal 44,5 55,9 49,0 60,0 57,0
General
awereness 9,0 10,8 14,4 11,1 10,9
Good
communication 11,5 18,1 9,6 3,0 10,0
Language
knowledge 12,0 7,8 10,6 9,2 8,5
Empathy 9,5 16,2 3,8 1,1 8,1
Practicality 2,0 4,4 8,7 9,2 7,0
Advanced logic 0,5 2,0 1,9 2,8 4,5
Opennes to the
new 6,5 8,3 1,0 3,4 4,5
Self-developing 2,0 3,9 3,8 4,9 4,4
Synthesizing
abi-lity 1,0 2,9 6,7 9,0 4,3
Application of
knowledge 5,0 5,9 1,9 4,5 4,3
Open-mindedness 4,0 7,8 2,9 4,7 4,2
Precision 1,0 2,9 1,0 3,6 3,9
Legal knowledge 1,0 1,5 ─ 1,1 3,6
Man centered 5,5 4,4 3,8 0,4 2,5
Table A5: Would you select your major again – the judgments of the yes answers (those who agree with the question in percentage)
Students with education major in Faculty of Arts
Students not education major in Faculty of Arts
Students with education major
in Faculty of Nature of
Sciences
Students not education major
in Faculty of Nature and
Sciences
Total sample
Bacause of the
possibilities 23,5 36,8 36,5 43,3 35,2
He has plans with
the branch 37,5 17,2 55,8 30,2 23,9
He got what he
had wanted 13,5 18,6 11,5 15,2 14,9
Multicolored 20,0 4,4 21,2 10,9 10,6
Because of the
degree 18,5 14,7 9,6 8,1 8,0
He has always
wanted it 4,0 3,9 2,9 3,6 3,8
High quality
education 3,0 3,4 1,9 1,1 1,8
It has future ─ 1,0 ─ 0,4 1,0
Source: DETEP, 2002-2008
Table A6:Would you select your major again – the judgments of the no answers
(those who agree with the question in percentage)
Students with education major in Faculty of Arts
Students not education major in Faculty of Arts
Students with education major in Faculty of Nature of Sciences
Students not education major in Faculty of Nature and Sciences
Total sample
Because of the low level 25,5 12,3 12,5 12,6 14,0
Low income 8,5 7,8 10,6 8,4 7,8
He changed his mind 3,5 3,9 1,9 2,4 3,3
Th e investiment is not commensure with the results
2,0 3,4 1,9 1,1 1,9
He had failures 2,5 0,5 3,8 0,6 1,0
It was not what he had
expected 1,0 0,5 ─ 1,3 1,2
Table A7:What do they consider to be important during the university years (on a four point scale)
Students with education major in Faculty of Arts
Students not education major in Faculty of Arts
Students with education major in Faculty of Nature of Sciences
Students not education major in Faculty of Nature and Sciences
Total sample
Friendly relations 3,54 3,64 3,40 3,10 3,52
Good grades 3,58 3,53 3,59 3,44 3,49
Forming
relations-hips for the future 3,31 3,37 3,49 3,44 3,41
Degree itself 3,31 3,27 2,91 3,28 3,28
To prepare for the
profession 2,96 3,37 2,62 2,95 3,11
TDK (Science
Stu-dent Circle) work 3,18 3,02 3,40 3,10 3,05
Recognition from
the professors 3,04 3,09 3,03 3,14 3,04
Recognition from
the students 3,15 2,94 3,08 3,03 3,02
Opportunities in
the city 3,11 2,94 3,32 2,98 3,01
Scholarship abroad 2,93 2,87 3,06 2,81 2,86
To use the
educati-onal opportunities 3,02 3,09 2,68 2,77 2,84
Quiet life, „to just
hang out” 2,34 2,11 2,58 2,27 2,28