Designing Simulator for Irrigation
Management
Rajesh Kumar
1, Dilbag Singh
21 Student M.Tech. Dept. of Computer Science & Applications, Chaudhary Devi Lal University, Sirsa, Haryana,
India
2Prof. Dept. Of Computer Science & Application, Chaudhary Devi Lal University, Sirsa, Haryana, India
Abstract— Water is the most important resource of life, so it becomes important to ensure the optimal usage of water. In 1960, various tools and policies have been formulated to ensure the optimal use of water. Various studies have been conducted to point out the need of water so as to ensure the efficient use of water can be made. A serious problem is also being faced in Haryana is the decreasing level of water and excess use which dilute its properties. So it is important to ensure the effective use of water. Various techniques have been suggested for water resource optimization based on linear programming, dynamic programming and simulation .Simulation models are often used with previous records or critical period of records. Generally, simulation models permit detailed and realistic representation of the complex physical, economic characteristics of a reservoir system
.
This paper presents the study of irrigation system in haryana and designs a simulator to minimize the loss of water.Keywords - Submersible Pump, Flow rate, Seepage, Evaporation
I- INTRODUCTION
After the formation of the State of Haryana in 1966, one in all the priority work of the authorities is to form infrastructure to satisfy the need of agriculture water. There are 47 percent area of Haryana have problem of irrigation water. A long work done year to year to make irrigation network consisting of fifty nine main canals having a length of 1500 kilometer and 1326 Distributaries and Minor having a length of 12328 kilometer. Out of a total covered area of 4.421 Million Hectare (Mha) of Haryana State, 3.819 Mha is used for agriculture, of which 3.048 Mha is covered by irrigation. Most of this area has been covered after the formation of Haryana. The irrigation network in Haryana can be as given below. [3]
Bhakra canal system covering north-western and north-western parts of Haryana.
Western Yamuna canals system covering the north-eastern and central parts of Haryana.
Lift canal system covering the south-western parts of Haryana bordering Rajasthan.
Gurgaon canal and Agra canal systems covering south-eastern parts of Haryana.
The tilt between Haryana and geographic region over the Sutlej Yamuna link, which could bring further water to the state, has not but been settled however the state providing tubal system to the farmers for his or her agriculture need.
The State undertook implementation of the six-year Haryana Water Resources Consolidation Project from 1994-95. The project objectives are to manage the total water resources efficiently and economically to spice up equally distribution of water amongst the beneficiaries by rehabilitating the current canal and system.
The Jui, Sewani, Loharu and Jawahar lal Nehru lift irrigation schemes have helped to carry irrigation water against gravity flow to arid areas. This has served as a good check against the advance of the Rajasthan desert. Techniques of sprinkler and Drip Irrigation are introduced within the extremely undulating and sandy tracts of Haryana.
To check over-exploitation of water in the dark zone areas of the state, the Haryana government has decided to extensively promote micro irrigation by providing incentives to the farmers. This shift in the irrigation system would not only help in maintaining eco-balance but also lead to energy conservation.
Irrigation Techniques
One meets all irrigation systems in Haryana. It is surface irrigation that comes first, followed by sprinkler irrigation and drip irrigation. The system the most practiced in terms of area irrigated and people involved, is surface irrigation.
comparatively uniform tract with slopes but 2-3% (FAO, 1974). Surface irrigation is that the most typical technique of irrigation and might be the foremost inefficient.
Sprinkler irrigation system generally includes sprinklers, laterals, sub mains, main pipelines, pumping plants and boosters, operational control equipment and other accessories required for efficient water application. Sprinklers are efficient irrigation systems in terms of application efficiency and have spread over the past 15 years in Haryana. When it compared with surface irrigation then it is found that Sprinkler to be 70 % more efficient than the surface irrigation system as the water requirement per irrigation is quite less than that of the surface irrigation without considering conveyance losses. However if include conveyance which is nearly 20-40% in case of surface irrigation the saving could be much more.
Drip irrigation, additionally referred to as trickle irrigation or localized irrigation, the water is discharge to the field through a pipe system. On the field, next to the row of plants or trees, a tube is installed. At regular intervals, close to the plants or trees, a hole is formed in the tube and equipped with an emitter. The water is supplied slowly, drop by drop, to the plants through these emitters. To promote drip irrigation in southern Haryana, the state government will provide pipes and other equipment at subsidized rates to ensure conservation of water.
II. RELATED WORK
This section presents the review of work done by various researchers that provides a useful insight for calculating exact requirement of water by the crops and its use properly. These works are very helpful in understanding what has been done in the field of effective use of water resources and how it can be improved.
Smajstrla et al., (2010) pointed out that in Florida seepage losses from reservoirs is the major cause of Reservoirs storage efficiency. They suggested that seepage losses may be reduced by lining reservoirs with impermeable soils or manmade liners such as plastic sheets, metal, plastic or fiber glass and tanks may be used as reservoirs to eliminate seepage losses. Transpiration losses from reservoirs occur as a result of vegetation growth in and around the reservoir. [9]
Ortega et al. (2004) analysed the effect of distribution uniformity of sprinkler irrigation water. The irrigation depths that maximize the gross margin of four crops in a semiarid territory in order to determine the best method of water use in sustainable agriculture. In many areas, the production is increased using excess water, but it
also take problem in long term such as water logging and salimoenization. [6]
Simonovic (1993) used the simulation model for the reassessment of management strategies for Wonogiri reservoir based on the continuity equation and the set of probabilistic criteria. This model use of a direct method for finding the answer of the question that is “What is the minimum capacity of the reservoir “ The user provide the initial storage value , then the monthly operation of the reservoir is studied. By simulating the reservoir operation under given input and demand conditions, four reliabilities were calculated and compared with the desired values. Four probabilistic criteria used were 1) reliability of reservoir water supply 2) yearly reliability 3) yearly vulnerability 4) monthly vulnerability of the reservoir water supply. If these four criteria were not met, the reservoir size was increased by a step size. The output of the model was to obtain a value of optimally required reservoir storage capacity. Similar simulation studies were performed on the Nile river basin also. [10]
Houck et al.(1980) and Neelakantan and Pundarikanthan (1999, 2000) used the reservoir storage as a trigger for operating rules. The total available water which consists of reservoir storage plus inflow can be used as a prompt to start hedging (Bayazit and Unal, 1990; Srinivasan and Philipose, 1998). Shih and Revelle (1994, 1995) mentioned the complexity that how much water release for irrigation and how much store for future use due to uncertain future inflows and nonlinear economic benefits for released water. Hill et al.(1996) presented a graphical calendar which guide to the farmer about the scheduling of irrigation for crop.[2]
much demand and therefore the draft are to be reduced during each time period?[5]
Rippl (1883) developed a simple and earlier
technique for analysing the relationship between reservoir inflows, desired draft rate and the storage capacity. This mass curve technique is known as Ripple‟s mass diagram. This mass diagram analysis is still used today by many water resources planners. Different draft rates can be tried with this model. In this technique, the cumulative inflows and the cumulative desired outflows are plotted in a time chart. These plots are commonly called „mass curves‟. The minimum capacity of the reservoir is calculated by maximum difference between total inflow and total outflow. The main disadvantage is that some time difference may be negative. [7]
Issues Covered in Literature Review
The various algorithms regarding the efficient use of water is taken out by using modern tool and management policies in past and a lot of researches has been done and it is still going on. Literature review gives clear idea of issue covered on this topic in previous researches and papers.
(i) The issue about the minimum capacity of the reservoir is done in previous researches by calculating the maximum gap between total outflow and total inflow.
(ii) The issue about indefinite inflows in the future has been solve in previous researches by calculating the volume of water resources used for irrigation, and how much stored for future use.
Issues Not Covered In Literature Review
Still there are some issues not carried out and more work is needed to be done on those issues. Issues not covered by above literature are given below.
(i) There is no proper method of irrigation to minimize the loss of water.
(ii) There is no proper method to calculate the size of the reservoir, so that the minimum land is required. (iii) There is no proper method for calculating the input of tube well system for the reservoir
Problem Statement
The present paper is entitled as “Designing of a Simulator for Irrigation Management”. The common method of irrigation in Haryana is the surface irrigation which covers 80% irrigation area. However, Sprinklers are efficient irrigation system in terms of application efficiency and have been spread over the past 15 years in Haryana. When, it has been compared with surface irrigation then it is found that Sprinkler are more efficient than the surface irrigation system as, the water requirement per irrigation is quite less than that of the surface irrigation without considering conveyance loss.
However if include conveyance which is nearly 20-40% in case of surface irrigation the saving could be much more. Secondly, Rain water harvesting is one of the most effective methods of water management and water conservation. It is the term used to indicate the collection and storage of rain water used for human, animals and plant needs. It involves collection and storage of rain water at surface, before it is lost as surface run off. The augmented resource can be harvested in the time of need. Hence, a Simulator is proposed which find out the exact requirement of water for irrigation by using sprinkle method of irrigation, manage water resources (rain and others) for every Month by using water reservoir, and manage irrigation throughout year successfully.
III. DESIGING OF SIMULATOR
This research has been used on a simulator which is built on the programming language. This study analysed the rainfall decline and its average figure of the last three years also. Calculating the evaporation factor of different months and have an average address. These two, average rain fall and evaporation factor delivered as input to the simulator. For a price of irrigation area, this simulator provides the size of the reservoir, water overflow and pump capacity. This research methodology is primarily a concern with the issue related to the performance of irrigation management.
Yes
yes
Stop pumpFig: 1 Irrigation System
Parameters affecting the irrigation system using water reservoir
The parameters that affect the irrigation system are as given below.
Input to the reservoir, there are three different ways to give input to the water reservoir that is from the canal, tubal and
Water Reservoir Rain
Canal
Tubal
Water loss Seepage/evaporation
Irrigation
If overflow
rain. The input from the canal is once in the month.
Water losses from the water reservoir, there are two different kinds of water losses from water reservoir, one of them are seepage and other is evaporation.
Output from the water reservoir that is how much water is used for irrigation from water reservoir.
Canal water calculation
Input from the canal is once in one month. The district canal situation in Bhiwani and Mahendergarh is not so much good, so on average, the reservoir once a month to get water from the canal. Approximately one hour is allocated for an acre and the diameter of the pump is 8 inches. For example
Diameter of the pump =8 inch Velocity-11.949 inch per second
Flow rate= (1/4)*pie*(pipe diameter) 2*velocity = (1/4)*3.14*64*11.949
=600.317 cubic inch per second Change it into gallon per second
Flow rate=2.6gallon per second (One cubic inch=0.004329 gallon)
Now change gallon into the litre 1gallon =3.78541 litre
2.6 gallon=9.842 litre per second
Now calculate how much water gets in one hour=3600*9.842=35431 litre
Hence Total input of water from canal in one month is 35431 litres
Rain water calculation
Rain water is calculated in mm. Now consider the length of the tank is 5 meters and the width is 5 meters and depth is 5 meters. When the rain came then the tank investigated and counted the depths of the water. Suppose it comes to 5 mm. It means that there is 5mm in surrounding area.
Volume of water (m3) =length*width*depth
= (5*5*5)/1000=.125 m3=125 litres (one meter cube=1000 litre) [4]
Tubal water calculation
The aim of the study is optimal utilization of water resources. Therefore, the objective of the study is to take minimal water from tubal to meet the irrigation requirement. There are two types of submersible motor that are used 3HP, 5HP. One of them is used for input water for the tank. The submersible used for irrigation has the potential of 5HP.
The term that is used in the table for the 3HP Submersible motor is given below.
Input Powers: - It used for the power of solar panels in the form of watt.
Head (m):- It returns the value from which the water is pulled out from the tubal.
Flow Rate (Litres/Minute):- It returns the value of water as a litre that is taken by the pump in a minute.
A table for 3HP Submersible pump for different head and different inputs power is given below. The Head used in Haryana is maximum 40 meter and approximately 3000 watts solar panel is used for 3HP pump.
Input Power (WATTS)
3000 2750 2500 2250 2000 1800 1600
Head(m) Flow Rate (Litres/Minute)
40 130 122 113 104 94 84 73
60 116 108 99 90 80 80 70
80 102 94 85 76 66 56 45
100 88 80 71 62 52 42 31
Fig: 2 3HP Submersible motor description (Source: www.shaktipumps.com)
The term that is used in the table for the 5 HP Submersible motor is given below.
Input Powers: - It used for the power of solar panels in the form of watt.
Head (m):- It returns the value from which the water is pulled out from the tubal.
Flow Rate (Litres/Minute):- It returns the value of water as a litre that is taken by the pump in a minute.
A table for 5HP Submersible pump for different head and different inputs power is given below. The Head used in Haryana is maximum 40 meter for water and approximately 5000 watts solar panel is used for 5HP pump.
Input Power (WATTS)
5000 4500 4000 3500 3000 2700 2500
Head(m) Flow Rate (Litres/Minute)
20 613 568 515 455 390 354 315
30 543 491 432 372 306 270 230
40 442 392 338 278 209 174 137
100 613 568 515 455 390 354 315
Fig 3: 5HP Submersible motor description
(Source: www.shaktipumps.com)
The study is carried out in input Power is 3000 watts and head 40m for 3HP submersible pump and for 5HP the input power is 5000 watts .In summer, the solar panel works approximately 10 hours a day from April to June, the rainy session says it is approximately half or 5 hours and about 6 hours in winter session. The Method used for calculation for Total input of water for the reservoir is given below:
Total Water (input to the reservoir) =Flow Rate * Motor (Hr)
Total Water (input to the reservoir) =7800*180=1404000 litres
Case 2: Pump Capacity = 5HP Flow Rate= 26520 litre/hour Motor (Hr) =180 Hr (in January)
Total Water (input to the reservoir) =26520*180=4773600 litres
Water Description for 5HP submersible motor used for irrigation
The 5HP solar pump used for irrigation from the tank. As the depth of the tank is maximum 10 meter so use the 20 meter height of head and 5000 watt solar panel is used for working of submersible
pump. . Flow Rate = 613 litre per minute=36780 litre per
hour as the sprinkle technology is used, so approximately 80 percentage of water saved, only 20 percent of
water is used. So Flow Rate using sprinkle technology=
(20/100)*36780=7356 litres per hour.
A table is drawn using this method for different month of the year for 3HP and 5 HP pump as given below for input from the tubal system to the water reservoir.
Fig: 4 Input to the reservoir using 3HP Submersible
Pump
Fig: 5 Input to the reservoir using 5HP Submersible Pump
Seepage Calculation
Water storage reservoirs are created by just making a reservoir to store the water resources supplied from various sources. The idea behind constructing water storage reservoirs is for doing
irrigation at minimum wastage. The size of the reservoir may be depending on how much acre to irrigate. Seepage is the process in which water is released through small holes. In water reservoirs, ooze is that the main crucial issue behind water losses. Ooze usually happens once the water escapes from the horizontally from the water reservoir base and vertically from the each wall of the water reservoir. The water releases through such conditions is named ooze water. For effective water management of reservoirs, ooze ought to be Minimum. Therefore perpetually study the calculation of ooze throughout the study of water reservoir.
There are many parameters that affect amount of seepage water from the reservoir. These parameters are sand used for water reservoir, pressure at that time and volume of the water. There are two major types of seepage occurring in the water reservoirs. One of them is horizontal seepage and other one is vertical seepage. The soil used for the water reservoir mainly affects the seepage amount. The table below gives the rate of seepage losses in millimetres per day from various soil types. [8]
Sr.no Natural Soil Type Water loss (in mm/day)
from seepage
1 Sand 25-250
2 Sandy loam 14-76
3 loam 8-20
Fig: 6 Seepage losses in millimetres per day from various soil types
To calculate quantity of water escaping as seepage, following formula can be used;
Seepage (in m3/Day) = Seepage losses (in m/Day) X Surface area of the tank/reservoir (in m2). Example Let take an example that reservoir has 1000000 litre of water from various source. Now first change it volume of the water reservoir.
Volume of the water reservoir =1000000/1000=1000 m3 (one litre=0.001 cubic meter)
Now that reservoir length is 20 meter and depth is 5 meter.
Use the formula of volume of the water reservoir. Volume of the water reservoir=length*width*depth
1000 =20*width*5 Width of the reservoir=10 meter
Surface area of the water reservoir=20*10=200 m2 The soil type is Sandy Loam than by taking average of 14 and 76 which is 45 so.
Seepage losses=45 mm
Seepage water (in m3/Day) = surface area of the water reservoir*seepage looses
=(200*45)/1000=9 m3/Day Now change the (m3/Day) into litre =9*1000
=9000 litres per days
Multiply this with 30 which give about total seepage loss in one month.
Month Head(m) Motor
(hr)
Flow Rate(L/Hr)
Total Water
January 40 180 26520 4773600
February 40 180 26520 4773600
March 40 180 26520 4773600
April 40 300 26520 7956000
May 40 300 26520 7956000
June 40 300 26520 7956000
July 40 150 26520 3978000
August 40 150 26520 3978000
September 40 150 26520 3978000
October 40 180 26520 4773600
November 40 180 26520 4773600
December 40 180 26520 4773600
Month Head
(m)
Motor (hr)
Flow Rate(L/Hr)
Total Water
January 40 180 7800 1404000
February 40 180 7800 1404000
March 40 180 7800 1404000
April 40 300 7800 2340000
May 40 300 7800 2340000
June 40 300 7800 2340000
July 40 150 7800 1170000
August 40 150 7800 1170000
September 40 150 7800 1170000
October 40 180 7800 1404000
November 40 180 7800 1404000
=9000*30=270000 litres
Evaporation calculation
Evaporation is the process of in which a liquid state is changed into the gaseous state as temperature increase. Evaporation is a basic part of the water cycle and is regularly occurring throughout nature. So from the definition there is a loss of water from the water reservoir in the form of evaporation. There is different kind of methods to find out the evaporation loss one of them is given below
To calculate evaporation losses, multiply the water surface area (in m2) by the corrected evaporation rate (in m) for the length of time your pond will be in use.
Calculate average evaporation rates (in mm) for each month for your place of reservoir from an appropriate meteorological station.
The average monthly evaporation rates needed for this example are as shown below:
Month Evaporation
Rate(mm)
Month Evaporation
Rate(mm)
April 45 October 35
May 55 November 30
June 55 December 26
July 45 January 20
August 45 February 20
September 43 March 23
Fig: 7 Average monthly evaporation rates
Multiply each month evaporation rate with correction factor which is .75.
Divide this corrected evaporation (in mm) by 1000 to calculate the evaporation in meters.
Multiply this value (in m) by the water reservoir surface area (in m2) to find the total water losses by evaporation (in m3) for the months. Change meter cube to litre by multiplying 1000. [1]
Total hours required for irrigation
It has been observed that the total area of the one acre is 220x200 ft and the sprinkler length is 20 ft, so there are required of 5 lines each of the 10 sprinklers for irrigation of one acre. Each line uses 3 hours for one-time irrigation. It is also that irrigation for summer from April to June is twice in a month and in rainy and winter single in a month.
IV OUTPUT OF SIMULATOR
This study analyzed the rainfall decline and its average figure of the last three years also.
Calculating the evaporation factor of different months and have an average address. These two, average rain fall and evaporation factor delivered as input to the simulator.
Input for first run of simulator
Area=3 acre
The average evaporation rate for Months is
Month Evaporation
Rate(mm)
Month Evaporation
Rate(mm)
April 45 October 35
May 55 November 30
June 55 December 26
July 45 January 20
August 45 February 20
September 43 March 23
The Rain in mm
Output for first run of the simulator
These two, average rain fall and evaporation factor delivered as input to the simulator. Now the simulator is ready for experiment which shows its experimental nature. For a price of irrigation area, this simulator provides the size of the reservoir, water overflow and pump capacity.
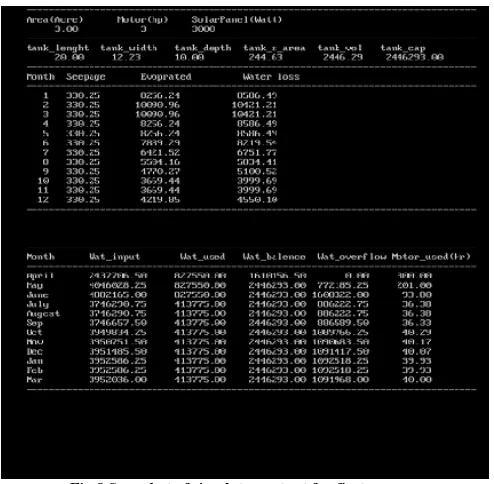
Fig 8 Snapshot of simulator output for first run
The output of simulator shows the water losses in different month from seepage and evaporation. It also shows the maximum size of the water reservoir and capacity of the reservoir. The second table shows the input to the water reservoir in different months of the year, the water used for irrigation in different month of the year.
Month Rain(mm)
July 132
August 132
Input for second run of the simulator
Theinput for second run given as below
Area=10 acre
The average evaporation rate for Months is
Month Evaporation
Rate(mm)
Month Evaporation
Rate(mm)
April 45 October 35
May 55 November 30
June 55 December 26
July 45 January 20
August 45 February 20
September 43 March 23
The Rain in mm
These two, average rain fall and evaporation factor delivered as input to the simulator. Now the simulator is ready for experiment which shows its experimental nature. For a price of irrigation area, this simulator provides the size of the reservoir, water overflow and pump capacity.
Outputfor second run of the simulator
These two, average rain fall and evaporation factor delivered as input to the simulator. Now the simulator is ready for experiment. For a price of irrigation area, this simulator provides the size of the reservoir, water overflow and pump capacity, reservoir volume , total input to the reservoir in different month of the year, total water used in different month, total losses in different month. It also gives the value of total working hour of pump in one month.
Fig: 9 Snapshot of simulator output for second run
As from the output when land size is 3 acres, the surface area of the water reservoir is also minimum, when it compares with 10 acres land. This study gives that size of the water reservoir is small as possible to full fill the irrigation requirement.
The problem that is raised in the previous study that the capacity of the reservoir some time may negative is solved through this simulator. Output has clearly shown that when irrigation land is increased, the capacity of the pump also increases.
The problem regarding water losses must also be solved with this simulator. As from the output of the simulator the overflow water is found out, then stop the motor pump if the overflow is greater than zero.
V. CONCLUSIONS
This research proposes a simulator which helps for effective utilization of water for the purpose of irrigation. This research gives clear idea about the requirement of water in different months of the calendar. It also provide the minimum capacity motor that is used for irrigation that play important role for example if 10 HP motor is used in place of 3HP motor (if that is sufficient for our need), it wastes thousands of litre of water per day. It also decreases water level that is very dangerous for future.
This research gives a clear picture for a full year that how much capacity motor is sufficient for irrigation, the seepage, and evaporation in a different month as an output of run. It is also concluded that if any output comes in negative values it suggests that there needs additional water to fulfil the irrigation requirement.
Now comparing the output of above two run for 3 acre and 10 acre the following conclusion are find out.
1. It is clearly seen from output when the irrigation land is smaller; the size of the water reservoir is even smaller. So saves land using this simulator. As from the output the capacity of the water reservoir for 3 acre is 2446293 litres and for 10 acre it will be 8310309.5 litres.
2. It is clearly seen from the output when the overflow takes place, the simulator which stops the solar water pump.
3. The objective of the dissertation is the effectively use of water, which is achieved through this simulator. As from output the values of the overflow is the value that is saved. This overflow value is increased when the irrigation area is increased.
Month Rain(mm)
July 132
August 132
ACKNOWLEDGMENT
The authors would like to thank the publishers, researchers for making their resources available and Dr.Dilbag Singh, Chairman, Deptt. Of Computer Science & Applications, CDLU, Sirsa for their guidance. We would also thank the dept. Authority for providing the required infrastructure and support. Finally, we would like to extend heartfelt gratitude to friends and family members.
REFERENCES
[1] A. V. SHNITNIKOV (1974) Current Methods For This Study Of Evaporation From Water Surfaces and Evapotranspiration, Hydrological Sciences Bulletin, 19:1, 85-97
[2] Houck, M.H.; Cohon, J.L.; ReVelle, C.S. Linear Decision Rule in Reservoir Design and Management: 6. Incorporation of Economic Efficiency Benefits and Hydroelectric Energy Generation. Water Resource. Res. 1980, 16, 196–200.
[3]
http://www.indiawaterweek.in/pdf/haryana_irrigation_de pt.pdf
[4] http://www.fao.org/docrep/r4082e/r4082e05.htm [5] Maass, A., et al. (1962), Design of Water-Resource
Systems, Harvard Univ. Press, Cambridge
[6] Ortega Alvarez JF, Tarjuelo Martin-Baito JM, De Juan Valero JA, Perez PC (2004).Uniformity distributionand its economic effect on irrigation management in semi-arid zone. J Irri Drain Eng. 130:112-120
[7] Rippl, W. "The Capacity of Storage Reservoirs for Water Supply," Proceedings of the Institue of Civil Engineers, Vol. 71, 1883
[8] Shailesh In Environment Tagged Seepage, Soil Type , Water losses , Water reservoir
[9] Smajstrla, Resource Uses Efficiency Particularly in Irrigated Area, Indian Journal of Agriculture Economics, Vol-61, No-1, Jan-March pp85-57