Optimization of Coal Mines using Data
Envelopment Analysis
Dr.G.Thirupati Reddy 1, Dr.J.Kanna Kumar 2 1
Associate Professor & Vice Principal, Dr.K.V.Subba Reddy Institute of Technology, Kurnool 2
Associate Professor & HoD, Dr.K.V.Subba Reddy Institute of Technology, Kurnool
ABSTRACT
Productivity improvement and cost control have become key objectives of SCCL coal mines in recent years. Data Envelopment Analysis (DEA) and Bench marking etc are very popular tools in productive improvement which can aggregate the input and output components in such situations for obtaining an overall performance measure to improve productivity. Selected various coal mines in SCCL and calculated relative efficiency of mines by using Data Envelopment Analysis (DEA) which helps to rank them based on their efficiency score. Discussed and analyzed the improvement areas of in-efficient coal mines.
I.INTRODUCTION
Singareni Collieries Company Limited (SCCL) is a public sector mining organization is the largest producer of coal in India after coal India Limited (CIL) with manpower of 77,000 and catering the energy needs of southern part of India. The company is now operating 42 Underground (UG) mines and 15 Open Cast (OC) mines.
This paper provides to evaluate the performance of the Coal mines to establish the bench marking of Open Cast (OC) mines using Input-oriented CRS model. Identified the best mines in each category is used as bench mark for improvement productivity of corresponding inefficient coal mines. Virtual efficient inputs or output and target production of mines are calculated for improvement by reducing slacks and reducing inputs.
Methodology
The Constant Returns to Scale Model (CRS)
The following discussion of DEA begins with a description of the input-orientated CRS model was the first to be widely applied.
CRS Input- oriented Model
In all variations of the DEA models, the DMU(s) with the best inherent efficiency in converting inputs X1, X2,…,Xn into outputs Y1, Y2,…,Ym is identified, and then all other DMUs are ranked relative to that most efficient DMU. For DMU 0, the basic CRS Input Oriented model (so-called CCR after Charnes, Cooper, and Rhodes) is calculated as follows:
The interpretation of ur and vi is that they are
Data Collection and Preparation for the Model
For the empirical application we worked with data on a survey of 15 Open Cast (OC) mines of SCCL.For our analysis, we have chosen four input variables namely, Wage Cost (In Lakhs rupees per year), Store Cost (In Lakhs rupees per year),OBR Cost (In Lakhs rupees per year), Other cost (In Lakhs rupees per year) and one output variable namely Production (in Lakh Tonnes per year).
Table I: Input and Output Variables used in the analysis
Input/output variable Open-Cast mines
Wage Cost (Input) It includes all the wages paid to the employees
Store Cost (Input) Cost of Explosives, spares and other maintenance items used
Other cost (Input) Cost of Capital equipment, Depreciation.
OBR cost (Input) Cost of over burden removal from above coal seams
Production (output) Saleable Coal
II. ANALYSIS OF OC MINES
OC mines with Input – oriented CRS model
Using CRS algorithm for every single DMU a linear program with one objective function and 16 side conditions was designed. These 16 linear programs were solved using TORA package and DEAP.
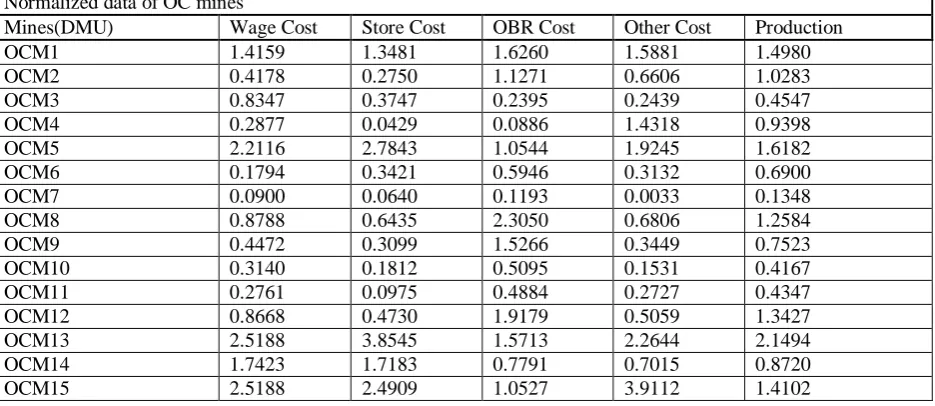
Table VI : Normalized Data for Open-Cast mines
Normalized data of OC mines
Mines(DMU) Wage Cost Store Cost OBR Cost Other Cost Production
OCM1 1.4159 1.3481 1.6260 1.5881 1.4980
OCM2 0.4178 0.2750 1.1271 0.6606 1.0283
OCM3 0.8347 0.3747 0.2395 0.2439 0.4547
OCM4 0.2877 0.0429 0.0886 1.4318 0.9398
OCM5 2.2116 2.7843 1.0544 1.9245 1.6182
OCM6 0.1794 0.3421 0.5946 0.3132 0.6900
OCM7 0.0900 0.0640 0.1193 0.0033 0.1348
OCM8 0.8788 0.6435 2.3050 0.6806 1.2584
OCM9 0.4472 0.3099 1.5266 0.3449 0.7523
OCM10 0.3140 0.1812 0.5095 0.1531 0.4167
OCM11 0.2761 0.0975 0.4884 0.2727 0.4347
OCM12 0.8668 0.4730 1.9179 0.5059 1.3427
OCM13 2.5188 3.8545 1.5713 2.2644 2.1494
OCM14 1.7423 1.7183 0.7791 0.7015 0.8720
DEA Linear Programming Formulation for OC Mines
Max 1.4980 u1
Subject to
1.4159 v1 + 1.3481 v2 + 1.6260 v3 + 1.5881 v4 = 1
1.4980 u1 - 1.4159 v1 - 1.3481 v2 - 1.6260 v3 - 1.5881
v4 <= 0
1.0283 u1 - 0.4178 v1 - 0.2750 v2 - 1.1271 v3 - 0.6606
v4 <= 0
0.4547 u1 - 0.8347 v1 - 0.3747 v2 - 0.2395 v3 -
0.2439 v4 <= 0
0.9398 u1 - 0.2877 v1 - 0.0429 v2 - 0.0886 v3 -
1.4318 v4 <= 0
1.6182 u1 - 2.2116 v1 - 2.7843 v2 - 1.0544 v3
-1.9245 v4 <= 0
0.6900 u1 - 0.1794 v1 - 0.3421 v2 - 0.5946 v3 -
0.3132 v4 <= 0
0.1348 u1 - 0.0900 v1 - 0.0640 v2 - 0.1193 v3 -
0.0033 v4 <= 0
1.2584 u1 - 0.8788 v1 - 0.6435 v2 - 2.3050 v3 -
0.6806 v4 <= 0
0.7523 u1 - 0.4472 v1 - 0.3099 v2 - 1.5266 v3 -
0.3449 v4 <= 0
0.4169 u1 - 0.3140 v1 - 0.1812 v2 - 0.5095 v3 -
0.1531 v4 <= 0
0.4347 u1 - 0.2761 v1 - 0.0975 v2 - 0.4884 v3 - 0.2727
v4 <= 0
1.3427 u1 - 0.8668 v1 - 0.4730 v2 - 1.9179 v3 - 0.5059
v4 <= 0
2.1494 u1 - 2.5188 v1 - 3.8545 v2 -1.5713 v3 - 2.2644
v4 <= 0
0.8720 u1 - 2.5188 v1 - 2.4909 v2 - 1.0527 v3 -
3.9112 v4 <= 0
u1, v1, v2, v3, v4 ≥ 0
Ranking of OC mines based on their efficiency scores and also mentioned the peer count means how many times efficient mines referred as a Bench mark for other in-efficient mines? This will helps to takes bench marking as a reference for further improvement of low performing coal mines.
TableVII: Efficiency Scores, Peer weights and peer groups for OC mines after solving Input – oriented CRS model
OPEN CAST MINES
Mines (DMU)
Efficiency
Score Shadow Values Benchmark or Peer groups
OCM1 54.96% 0.5792 4
OCM2 100.00% 1.0000 2
OCM3 100.00% 1.0000 3
OCM12 92.19% 0.1628, 4.3572, 1.3535 2, 7, 11
OCM13 68.06% 1.0897, 0.8812, 6.1311 3, 4, 7
OCM14 64.22% 1.0914, 0.1257, 1.9125 3, 4, 7
OCM15 39.68% 0.7226, 0.9589, 1.3411 3, 4, 7
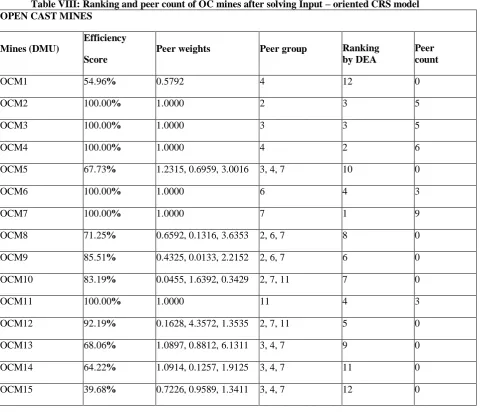
Table VIII: Ranking and peer count of OC mines after solving Input – oriented CRS model OPEN CAST MINES
Mines (DMU)
Efficiency
Score
Peer weights Peer group Ranking
by DEA
Peer count
OCM1 54.96% 0.5792 4 12 0
OCM2 100.00% 1.0000 2 3 5
OCM3 100.00% 1.0000 3 3 5
OCM4 100.00% 1.0000 4 2 6
OCM5 67.73% 1.2315, 0.6959, 3.0016 3, 4, 7 10 0
OCM6 100.00% 1.0000 6 4 3
OCM7 100.00% 1.0000 7 1 9
OCM8 71.25% 0.6592, 0.1316, 3.6353 2, 6, 7 8 0
OCM9 85.51% 0.4325, 0.0133, 2.2152 2, 6, 7 6 0
OCM10 83.19% 0.0455, 1.6392, 0.3429 2, 7, 11 7 0
OCM11 100.00% 1.0000 11 4 3
OCM12 92.19% 0.1628, 4.3572, 1.3535 2, 7, 11 5 0
OCM13 68.06% 1.0897, 0.8812, 6.1311 3, 4, 7 9 0
OCM14 64.22% 1.0914, 0.1257, 1.9125 3, 4, 7 11 0
OCM15 39.68% 0.7226, 0.9589, 1.3411 3, 4, 7 12 0
Fig: Ranking of Opencast Mines for Input – oriented CRS model (OC Mines)
Virtual Efficient Inputs of OC Mines
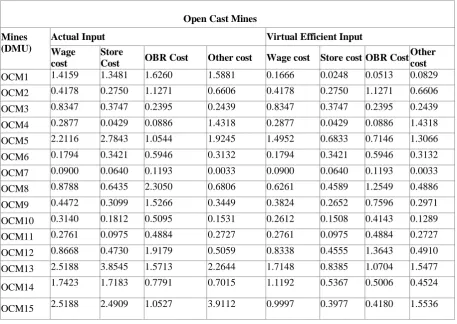
Every DMU beneath this efficient frontier is inefficient among the efficient mines. The usage of combinations of efficient DMUs is called virtual producers corresponding to the inefficient ones. The “shadow values” and “peer groups” are helpful in constructing the virtual producers. For example mine OCM5 has got efficiency score less than 1. OCM3, OCM4 and OCM7 are in the peer group of OCM5 and their corresponding shadow values are 1.2315, 0.6959 and 3.0016 respectively. Its virtual producer is a linear combination of inputs or outputs of efficient mines of OCM3, OCM4 and OCM7 (peer group which have a relative efficiency 1 with respect to OCM5). This efficient wage cost for OCM5 is 1.2315*0.8347+0.6959+0.2877+3.0016*0.0900.Simi larly, the efficient store cost is 1.2315*0.3747+0.6959*0.0429+3.0016*0.0640.Simil
arly, the efficient OBR cost is
1.2315*0.2395+0.6959*0.0886+3.0016*0.1193 and
other cost is
1.2315*0.2439+0.6959*1.4318+3.0016*0.0033. These virtual producers provide a direction to improve the efficiency. In input orientation measure indicates how much the existing input to be reduced to produce a given level of output.
Table XI: Virtual Efficient Inputs Calculated for OC Mines after solving Input – oriented CRS model
Open Cast Mines
Mines (DMU)
Actual Input Virtual Efficient Input
Wage cost
Store
Cost OBR Cost Other cost Wage cost Store cost OBR Cost
Other cost
OCM1 1.4159 1.3481 1.6260 1.5881 0.1666 0.0248 0.0513 0.0829
OCM2 0.4178 0.2750 1.1271 0.6606 0.4178 0.2750 1.1271 0.6606
OCM3 0.8347 0.3747 0.2395 0.2439 0.8347 0.3747 0.2395 0.2439
OCM4 0.2877 0.0429 0.0886 1.4318 0.2877 0.0429 0.0886 1.4318
OCM5 2.2116 2.7843 1.0544 1.9245 1.4952 0.6833 0.7146 1.3066
OCM6 0.1794 0.3421 0.5946 0.3132 0.1794 0.3421 0.5946 0.3132
III. CONCLUSIONS
DEA efficiency ranking finds that 6 DMUs out of 15 DMUs have emerged as benchmarking units for the other 9 DMUs. The benchmarking units are listed as OCM2, OCM3, OCM4, OCM6, OCM7 and OCM11 as shown in table VIII (OC Mines). The efficiency score for these DMUs approaches unity while that of DEA-inefficient DMUs is less than unity. For example, OCM5 having efficiency score of 67.73% can refer OCM3, OCM4 and OCM7. OCM5 can assign a weightage of 1.2315 to OCM3, 0.6959 to OCM4 and 3.0016 to OCM7 to become a benchmark unit. One DMU (e.g. OCM7) have become the peer unit nine times while OCM4 becomes the referring institute for six times, respectively. OCM2 and OCM3 becomes the referring institute for five times whereas OCM6 and OCM11 for three times respectively. Six mines ranked as 1 have become efficient units. However, there is a scope for improvement of Open cast mines because mean efficiency score for all DMUs shows 0.8178 (81.78%).
After Benchmarking it is found that there is sufficient scope for improvement in coal mines .The fruits of process benchmarking could bring in substantial savings by way of overall cost reduction and cycle time which improves the Productivity of Coal mines.
IV. REFERENCES
[1] Charnes, A., Cooper, W. W., & Rhodes, E. (1978). Measuring the efficiency of decision making units. European Journal of Operational Research, 2, 429-444.
[2] Srinivas Talluri, Data Envelopment Analysis: Models and Extensions, 2000, the journal of Production/Operations management.
[3] Banker, R.D., Charnes, A. and Cooper, W.W. (1984), „Some models for estimating technical and scale inefficiencies in data envelopment analysis‟, Management Science, Vol. 30, No. 9,pp.1078-1092. [4] M. Yasin, “The theory and practice of benchmarking:
then and now,”Benchmarking: An International Journal, vol. 9, iss. 3, pp. 217-243, 2002.
[5] K. Tone, “A slacks-based measure of efficiency in data envelopment analysis,” European Journal of Operational Research, vol. 130, iss. 3,pp. 498-509, 2001.
[6] Andersen P and Petersen NC (1993). A procedure for ranking efficient units in Data Envelopment Analysis. Mngt Sci 39: 1261–1264.