2019; 8(2): 69-80
http://www.sciencepublishinggroup.com/j/earth doi: 10.11648/j.earth.20190802.11
ISSN: 2328-5974 (Print); ISSN: 2328-5982 (Online)
Physical Properties of the Earth Crust Within the Joint
Zone Between Turan Platform and Orogenic Structures of
Tien-Shan
Dilshot Atabaev
1, *, Oleg Mordvintsev
3, Dmitriy Mordvintsev
2, Nasiba Atabaeva
11Geophysics Department, National University of Uzbekistan, Tashkent, Uzbekistan
2
Geophysics Lab., Institute of Geology and Geophysics, Tashkent, Uzbekistan 3
Lead Geophysics, JVC Uzbekgeophysica, Tashkent, Uzbekistan
Email address:
*
Corresponding author
To cite this article:
Dilshot Atabaev, Oleg Mordvintsev, Dmitriy Mordvintsev, Nasiba Atabaeva. Physical Properties of the Earth Crust Within the Joint Zone Between Turan Platform and Orogenic Structures of Tien-Shan. Earth Sciences. Vol. 8, No. 2, 2019, pp. 69-80.
doi: 10.11648/j.earth.20190802.11
Received: January 22, 2019; Accepted: March 2, 2019; Published: March 20, 2019
Abstract:
The main aim of the study, presented in this article was to precise the deep geological structure of joint zone between the Tien-Shan orogenics and Turan platform. Within this research we have determined the petrophysical features of the pre-Mesozoic sections of this zone. These data will help us in the further prospecting works for minerals searching. The principal method of study was the seismic-density modelling data complex interpretation, bonded to the geological and subsurface information from the previous works. The modeling was provided along the lines in the South-Western Gissar region, Uzbekistan. The main features, we paid attention, were rocks density, seismic wave velocity and magnetic features. As a result, deep geological structure and petrophysical features of different pre-Mesozoic formations of the study area were obtained.Keywords:
Model, Structure, Crust, Density, Electric Resistance, Magnetic Susceptibility1. Introduction
The density modeling is one of the important methods for the deep geological structure researches. Also, this method is very widespread in prospecting works for different minerals [19, 20]. For example, there are a lot of works by this method in Russian hydrocarbon provinces [26, 27].
Density modeling was provided for studying geodynamical and tectonic processes within the zones of the modern tectonic activity in different countries [19, 20, 30, 32].
In Uzbekistan we have 5 oil and gas provinces, and plenty of geological structures different age and forms – from pre-Palaezoic to Cenozoic. One of the most important are the Turan platform and Tien-Shan orogeny [3, 13, 18, 21, 28, 33].
The first stage of the orogeny mode in the geomorphological plan corresponds to the Nurata ridge,
Northwest spurs of the Turkestan and Zeravshan ridges, the Surkhandarya and Fergana basins [7, 8, 10, 18, 25, 33, 34].
Actually, these areas are active fields of transition from a platform to orogeny modes.
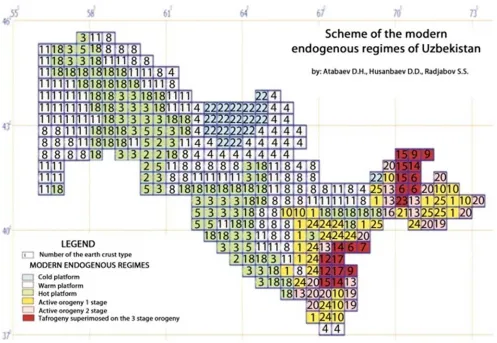
The second stage of the active orogeny mode is developed in the western termination of the Zeravshan ridge, southwest spurs of the Gissar Range, and, fragmentally, in Chatkal-Kurama and Turkestan-Alay system of raisings (types of crust 13, 16, 19, 20) – see figure 1.
The tafrogeny mode (types of crust 6, 7, 9, 12, 14, 15, 17, 23) is imposed on the orogeny mode of the third – closing – stage within the western Tien Shan.
Figure 1. Scheme of the modern orogeny modes of Uzbekistan.
The provided data shows that in a southeast part of Uzbekistan (the Western Tien Shan) the combination of the different modern endogenous modes and their imposing on earlier developing is noted. Processing of earlier created orogenic structure by the modern tafrogeny mode works, apparently, by capturing of its separate parts which does not change its place in relation to nearby blocks, what is confirmed by preservation of its uniform structure.
Many researchers, at different times, are considered the existence of a tafrogenesis in the earth crust under these mountain formations [1, 2, 14, 17, 21- 24].
In difference from it, within the Turan plate exists only the platform mode, which characterized by generally high values of a heat flow that testifies by big power and consequently, the endogenous and tectonic potential of earth crust of this territory, which is ready to transformations [31, 33, 34].
2. Geological and Tectonic Models of the
Central Asia Earth Crust
The model of the structure of the deep layers of the earth's crust at the initial stage is hypothetical and, as a rule, can be confirmed or disproved only at the final stage of modeling. At the same time, a version of its radical change is probable, which, as a consequence, will entail a review of the entire
interpretation, i.e. a special role is played by the verification of the model (with the forecasting of the material composition) in the early stages of studying the lithosphere.
The comparative abundance of petrological information in Central Asia (relative to other regions) gives, in principle, the possibility with a certain degree of certainty, to carry out such an assessment at the very beginning of the research.
At the same time, the ambiguity of the results of the interpretation of geological and geophysical materials, the solutions of geophysical inverse problems, as well as the various geological viewpoints of the authors, sometimes quite thoroughly divergent, have led to the fact that at present time there are many elaborately developed models of the deep geological structure of the earth's crust of the Central Asia.
in our work [2, 6, 12, 21, 31, 33, 34].
3. Structure and Composition of the
Earth Crust
As a basis, we accepted the information on the structure and classification of the crustal types given in the works of [22, 21, 33], taking into account the materials of the publishings of [2, 13, 24].
When assessing the structure of the earth's crust and upper mantle, we will proceed from the recognition of only two support boundaries recognized as interregional: the mantle surface (the Moho boundary) and the foundation surface. Considering the structure of the consolidated crust as block-layered, we nevertheless allow, in a number of cases, to talk about the assignment of layers, in particular "sedimentary", "granite", transitional, “basaltic” and crustal-mantle, only for the convenience of reducing the averaged petrophysical characteristics and allocation of types of the earth's crust.
According to Khamrabaev and Gordienko, variations in the total thickness of the earth's crust, its individual layers, the presence or absence of some of them made it possible to distinguish in Europe its 5 types. They were determined from the velocity sections associated with the zones of various endogenous modes. At the next stage, the other physical properties of the rocks were determined, the average composition for each type of crust and origin in the development of the continent was revealed.
Earth crust type I - platform, which is common in regions not affected by the geosyncline processes of the Phanerozoic.
Type II - geosyncline - implies geosyncline processing of the Earth's crust type I and its varieties.
Because of destruction in the process of tectono-magmatic activisation of the crust of types I and II, type III and type IV crusts formed.
Type V - the extreme variety of destructive processes of the continental crust.
For the territories under consideration in the central part of Central Asia, the crust type II (the Kuramin-Fergana middle massif, the South Tien Shan geosynclinal-folded region) and crust type III (the Karakum-Tajik edge massif) are common.
The predicted composition of the consolidated earth crust based on materials of Khamrabaev and Gordienko, based on the data of deep petrology, leads to the following: in the upper part of the "granite" layer, rocks are developed in the vast majority not older than the Lower Proterozoic rocks.
Archean complexes belonging to the bottoms of this layer are metamorphosed in the granulite facies. The degree of metamorphism increases according to depth. Also, there may be exist a significant change of physical properties with an unchanged chemical composition [2, 21, 23, 24].
The rocks of the lower crust are formed in the granulite and eclogite facies [24; “The structure and evolution of the tectonosphere”, 1987], probably on the basalts and the products of their disintegration, by the intercalation of gabbro.
In general, taking into account all the data given in the literature [22], granulites (formed from basic and primary sedimentary rocks with a high alumina content),
garnet-distene granulites, eclogites, garnoliths, intrusive
hyperbasites, garnet-plagioclase and hypersthene gneisses, pyroxenites, enderbites are most common for the lower floors of the earth's crust.
Petrophysically Riphean-Vendian and Paleozoic rock complexes of middle part of the Kuramin-Fergana massif are almost identical and differ significantly from the underlying Early Proterozoic rocks. Sedimentary metamorphic rocks are weakly magnetic: most of them have a magnetic susceptibility (χ) within tens of 10-6 GHS, the average value for the region is (20-30) x 10-6 GHS. Even less is the residual magnetization. As an exception, some metamorphic rocks (schists with magnetite mineralization) are distinguished, as well as formations that are in the zone of active contact with igneous rocks (skarned, hornfels, etc.) or ore-bearing, enriched with ferromagnetites. The magnetic susceptibility of these rocks can reach tens of thousands x 10-6 GHS.
The magnetic properties of igneous rocks depend on their composition: the magnetization increases within increasing basicity. Effusive formations of acid composition are usually weakly magnetic: more basic (diabases, spillites, basalts, etc.) can be referred to magnetic - their (χ) reaches - 1200 x 10-6 GHS or more. However, among the main effusives, along with magnetic spacing, non-magnetic ones are encountered.
The intrusive rocks of the basic and ultrabasic composition (pyroxenites, serpentinites, gabbros) are magnetic and strongly magnetic: reaches 15,000 x 10-6 GHS. Among the granitoids are usually weakly magnetic granites, alaskits, some varieties of granodiorites. The remaining petrophysical differences refer to magnetic differences. In a number of cases, acid differences are magnetic too: χ of Angren leucocratic granites is 800 × 10-6 GHS. In Mogoltau, a large part of the granodiorites is strongly magnetic - χ is 2300 x 10 -6
GHS, but along with them a group of practically nonmagnetic granodiorites is distinguished, geologically not differing from the first ones and making up 22% of the studied ones. The reason for such a sharp divergence of properties, according to N. B. Dortman, is the tectonic mode in the period of their formation; in the opinion of P. G. Akhmatov - the earlier (Caledonian) age of non-magnetic igneous rocks.
group belong syenites (σ = 2,61 g/cm3). The intrusive rocks with an average density include granodiorites (σ = 2.64-2.66 g/cm3); The syenite-diorites, diorites, effusives of medium and basic composition (σ = 2.70-2.75 g/cm3) have an increased density. The densest rocks have the basic and ultrabasic composition: gabbro, peridotites, pyroxenites (σ = 2.80-3.10 g/cm3).
Geoelectric section of the region has not been studied
enough. In general, pre-Mesozoic formations are
characterized by relatively high resistance values, which, in comparison with the Mesozoic-Cenozoic, can be considered practically infinitely high. The electrical resistance of the pre Mesozoic rocks is determined mainly by the lithological composition: the degree of metamorphism also actively influences them. Carbonate rocks have the highest resistances (apparent resistivity) - limestone from 500 to 15,000 ohms, dolomites - 3,000 to 2,000), not so high - crystalline shales (600-2,000 ohms) and rocks of different composition (300 + 2000 ohms). The average position is occupied by sandy-shale and volcanogenic strata (150-700 ohm). The smallest resistivity (100 ohm) is found in argillaceous shales. With an increase in the sandy material, the resistance rises and reaches its highest values in the sand-conglomerate strata. Effusives of various compositions have an average of about 500 ohm, an effusive-sedimentary sequence - from 100 to 1000 ohm.
One of the main factors determining the velocity properties of pre-Mesozoic rocks is their lithological composition. The highest velocity (5800 - 6000 m/s and more) is observed in carbonate rocks, as well as amphibolites and igneous rocks of the main series. Sand-shale formations in the carbonate layer reduce its velocity; Dolomites on the contrary, lead to an
increase. The complex, represented by magmatic,
metamorphic and sedimentary rocks, is characterized by velocities from 5000 to 6000 m/s. In the sandy-shale strata, as well as in acid granitoids, this index is heavier to the lower limit and rarely exceeds 5000 m/s. The Upper Paleozoic volcanogenic rocks represent a very heterogeneous stratum, characterized by a wide range of velocities - from 3,500 to 6,000 m/s. The lowest velocities are in tuffs, the biggest are in andesite-dacitic porphyries from the bottoms of the Akchin suite. In general, effusives can be considered as medium-velocity at a medium-velocity of 5250 m/s.
The elastic properties of rocks are significantly influenced by fracture, leading to a sharp decrease in speed, which usually in fractured rocks is no higher than 4,500 m/s. That is why the minimum velocity values characterize the zones of faults (3500-4500 m/s).
The rocks of the Mesozoic Cenozoic, lying on the eroded Paleozoic surface and represented by Cretaceous, Paleogene, Neogene, Quaternary deposits, composed of clays, sandstone siltstones, gravelites, have a density σ = 1.8-2.3 g/cm3, (σaverage = 2.2 g/cm3) are practically non-magnetic, Vp = 2800-3500 m/sec, ρapparent = 50-300 ohm. The total thickness of these deposits is from 0 to 1000 m and more.
Within the South Tien-Shan geosyncline, the Lower Paleozoic deposits are represented by rhythmically
alternating shales, sandstones, siltstones with individual interbeds of gravelites and conglomerates, limestones, siliceous rocks, basic porphyries, quartz albitophyres and their tuffs are usually weakly magnetic (χ on average 0-30 х 10-6 GHS), they have a sufficiently high apparent resistance (ρapparent = up to 500 ohms) and the boundary velocity (Vg = 5300-5400 m/s), the average density (σaverage = 2.68 g/cm3).
Middle Paleozoic formations are mainly represented by limestones and dolomites, in Karatube - marl and marbleized limestones of Llandovery and Venloka, as well as siltstones with siliceous inclusions. This section is characterized by a slightly increased density σav = 2.69 g/cm3, velocity Vb = 5600 m/s, average resistance ρapparent = 800 ohms, practically non-magnetic χav = 20х10-6 GHS. Carbonate formations of the Upper Silurian-Lower Devonian age were widely spread. In Kuldzhuktau (the Jangeldin suite, the Boshgumdan suite, the Turkmengau suite), they are composed of limestones, dolomites, marbled limestones with sparse interbeds of siltstone and siliceous rocks (σaverage = 2.72 g/cm3, χ av = 0-20 x 10-6 GHS, Vb = 5700 m/s., ρapparent up to 1000 ohms) and include a full age interval. The apparent thickness is up to 2000 m. The averaged petrophysical characteristics of the deposits of the Upper Paleozoic age are greatly influenced by the presence of carbonates in the section, the average density of 2.68 g/cm3, non-magnetic - χ = 0-20 × 10-6 GHS, sufficiently high-speed Vb -5600 m/s, apparent resistance with ρapparent = 300 ohms (reaching 1000 ohms).
The Lower Permian formations end the Upper Paleozoic complex. They consist mainly of argillaceous shales, arkose sandstones, coarse-grained and gravel conglomerates. These deposits are distinguished by low petrophysical parameters (for pre Mesozoic formations) – σaverage = 2.65 g/cm3, χav 20 x 10-6 GHS, Vb 5200 m/s, with ρapparent = 100 ohm. The apparent resistance directly depends on the content of the clay fraction and, with its large amounts, may drop to 30 ohms.
Intrusive rocks play an important role in the structure of the upper part of the earth's crust. They were studied by a number of researchers. The results of the studies are summarized in the monograph "Petrography of Uzbekistan", which is taken as a basis in this description. In addition, the materials of R. N. Abdullaev, M. A. Akhmedjanov, A. A. Bakirov, V. S. Knyazev, V. A. Khokhlov and others were used.
In the territory of the South Tien Shan geosyncline, a number of different intrusive complexes are distinguished. The most ancient - Riphean - intrusive formations include individual xenoliths of granitoids in the Kittarmaian suite of the Zirabulak-Ziaetdin mountains (σaverage = 2.85 g/cm3, χ av = up to 1000 x 10-6 GHS, Vb = 5700 m/s, ρapparent = 1500 ohm) and gabbroids (σaverage = 2.8 g/cm3, χ av up to 700 × 10-6 GHS, Vb = 5500 m/s, ρapparent = up to 1000 ohms) are identified in Kuldzhuktau and Zirabulak mountains.
the rock composition - it increases from acidic (practically non-magnetic) to ultrabasic (strongly magnetic) rocks. However, in a number of cases this regularity breaks down, so granites and granodiorites exposed to the south of
Kuldzhuktau have up to 1000 x 10-6 GHS, while
nonmagnetic differences are sometimes found among the main rocks. The boundary velocity and the apparent resistance also generally increase with increasing basicity.
In the Karakum-Tadjik territory, the Lower Paleozoic formations begin with the Lower Silurian formations and are composed of sedimentary-metamorphic rocks (ortho-amphibolites interbedded with shales, sandstones, marbles). According to petrophysical properties, the formation data are not particularly distinct among the remaining Paleozoic formations: σaverage = 2.67 g/cm3, χav = 20 × 10-6 SI, Vb = 5500 m/s, ρapparent = 300 ohm, although rocks, similar to the composition of the Sarytuz suite, can differ somewhat in elevated values of density and magnetic susceptibility, which may be due to the presence of ortho-amphibolites.
The Lower Carboniferous formations are represented by the carbonate-volcanogenic type of the section with a total thickness of up to 2200 m. The physical properties of this complex are directly depend on the presence of the carbonate component, but on the whole they have somewhat increased density and magnetic susceptibility: (σaverage = 2,68 - 2,7 g/cm3, χav = 30 - 70 x 10-6 SI units). In the territory under consideration, these formations were discovered by drilling in the northwestern part of the Bukhara step and south of the Zirabulak-Ziaetdin mountains.
The carbonate-terrigenous section, belonging to the Upper Bashkir and Moscow Stages, is developed mainly in the Southwestern spurs of the Hissar Range and is represented by alternating sandstones, siltstones, mudstones with tuff layers and limestone lenses, gravelites and conglomerates. Above them overlap layered and massive limestones, followed by a bundle of mudstones, siltstones with lenses of clay limestone and sandstone. The upper part of this section refers to the Alachapa suite. The physical properties of the flysch and terrigenous-carbonate sequences have average values for the Paleozoic formations (σaverage = 2.67 g/cm3, χav= 20 x 10-6 SI units, Vb= 5600 m/s, ρapparent = 500 ohms). Volcanogenic and volcanogenic-terrigenous sequences with effusives of medium and basic composition have an increased density σaverage = 2.72 g/cm3 and a magnetic susceptibility χav = 150 x 10-6 SI units, the boundary speed Vr = 5600 m/s, the apparent resistance ρapparent = up to 700 ohms.
The whole complex of Mesozoic-Cenozoic sedimentary rocks is practically non-magnetic or weakly magnetic. The magnetic susceptibility fluctuates within the limits of the first tens of 10-6 SI units and, on the average, χ does not exceed 5-10 x 5-10-6 SI units, which practically does not affect the nature of the magnetic field.
The density of the Mesozoic-Cenozoic cover on this territory varies from 1.7 g/cm3 to 2.94 g/cm3 (for anhydrite), averaging 2.1 to 2.3 g/cm3. The density depends on the lithologic composition and depth of occurrence of rocks (at depths of 3-3.5 km it reaches the average density of
Paleozoic complexes - 2.67 g/cm3). In addition, there was an increase in density (for the same lithological differences) in the southeast direction, towards the Tajik depression. The presence of salt (σaverage = 2.15 g/cm3), which reduces the average density for the Upper Jurassic (in spite of the anhydrite interlayers) to 2.3 - 2.4 g/cm3, strongly affects the average density value (Akhmatov G. P.).
The boundary velocity in the Mesozoic-Cenozoic deposits varies on average from 1500 m/s to 4,600 m/s. They are distinguished by the anomalous velocity of the limestone of the Bukhara horizon (Vb up to 4000 m/s) and anhydrite and carbonate of the Upper Jurassic (Vb 5000 - 6000 m/s).
The geoelectric section of the sedimentary cover has not been fully studied, but on the whole it can be said that it is characterized by low resistance values (the first tens of ohms).
Late Precambrian rocks are mostly metamorphosed to not above the amphibolite facies, have a significantly varying Vp, depending on the composition of rocks and the degree of metamorphism; the density is more conservative and, therefore, there are practically no direct dependences between Vp and σ. In complex, according to Gordienko, it is possible to roughly outline two main groups of values of 2.71 g/cm3 and 6.3 km/s for carbonate differences and 2.77 g/cm3 and 6.2 km/s for gabbro-diorites.
The Early Precambrian formations of the amphibolite facies were reliably characterized under laboratory conditions for only one group of samples: σ = 2.83 g/cm3, Vp = 6.4 km/s (with an allowance for 0.3 km/s for heat).
The rocks of the deep horizons of the earth's crust (at normal core temperatures) have an average density of 2.99 g/cm3 at a longitudinal wave velocity of up to 7.05 km/s with a range from σ = 2.81 g/cm3, Vp = 6.41 km/s to 3.22 g/cm3 and 7.8 km/s. The latter values are most typical for ultrabasites and garnet granulites. All these values fit perfectly into the empirical dependence σ = 2.74 + 0.25 (Vp-6), which makes it possible to use it to construct density models based on seismic data.
4. Density Modelling
The specifies of the geological and tectonic structure of the joint zone between the Turan Platform and the Tien Shan orogeny create troubles for interpretation of geological-geophysical data in this area. For example, CDP, electric survey and drilling data not always respect to conditions, which are necessary for high-quality research of the earth crust deep structure. CDP lines are often no longer than 8-10 km and this is not allow us to obtain data neither from the deeper layers of the sedimentary cover nor from the crystalline basement. Hard geological-mountainous and seismological circumstances created heavy troubles for researchers. That is why most part of researches is concentrated in the local areas.
lack of information and offer to give a look on the earth crust deep structure from the slightly another viewpoint.
To construct our models we used the data of gravity, magnetic, seismic surveys (CDP, DSS, ECWM) with materials of geological mapping and deep drilling.
The use of gravitational anomalies (in the Bouguer reduction, σ = 2.3 g/cm3) for geological constructions was preceded by the analysis of the distribution of rock density in the Mesozoic-Cenozoic cover. The point was, that the density increase with depth. The influence of the earth surface is defined within a radius of 150 km. In gravity modeling, the density of deep horizons was calculated from its dependence on velocity according to the formula σ = 2.7 + 0.25 (Vp-6), and the density of the upper part of the geological section was taken from the data of near-surface petrophysical studies. The model versions were calculated, both taking into account thermal decompression, and without it. Information about the rate of the heat flow is taken from the data of [21, 22, 24, 33]. The analysis of the obtained results showed a relatively small effect of thermal decompression on the rate of the gravitational field of the area, it has the character of a more or less constant component.
Models of the first approximation for geo-density modeling included a full volume of the results of studies on the consolidated crust upper part, namely, the surface structure of the crystalline basement, the material composition of the pre-Jurassic complexes. The basis for deep construction was given by the interpretation materials of regional seismic profiles (DSS, ECWM). The density characteristics were determined (where data were available) by the propagation velocities of longitudinal seismic waves σ = 2.7 + 0.25 (Vp-6). Information on the deviations of this type of connection (Khamrabaev, “Structure and evolution of the tectonosphere”, Tal-Virsky) proved to be of little use for practical application in the studied region. As far as possible,
the distorting effect of crustal temperature in determining the density by velocity was taken into account, as noted above. According to the data (“Structure and evolution of the tectonosphere”, 1987), the decompacting effect does not exceed - 0.03 g/cm3 at the Moho surface in the activated regions. The construction of the model along the seismic profiles (and further modeling) necessarily took into account the three-dimensionality of the crustal objects. The transverse dimensions of the bodies were justified by the available geological and geophysical information. At the same time, the difficulties of calcuating the real form of geological structures, normal and anomalous temperatures can give, according to estimates (“The structure and evolution of the tectonosphere”, 1987), increase of error in calculating the gravitational field, compared to the usual, up to 15-20 mg for hard massif.
Further calculations were carried out using the software of Y. G. Bulakh, M. N. Markova (1982, 1989), Y. G. Bulakh, S. P. Levashov (1992). The selection algorithm based on the principle of minimizing the divergence of the input values of the field ∆gremanent with the calculated anomalies from the approximately constructed model. The program provides a solution to a direct problem, the geometrization of interfaces or the definition of excessive density (depending on which of the parameters is fixed when entering information).
The geological model is approximated by a set of bodies of an arbitrary geometric shape (up to 70 bodies in the model, the number of points characterizing the body is up to 40). Each body is described by parameters: excessive density (usually considered a fixed parameter), dimensions across the strike, in addition, excessive body density is indicated outside the actual model, and an approximate center of gravity is also noted. With this input data, the configuration of the bodies was done, but if necessary, a density selection program was used.
5. The Nature of Density Models of the
Joint Zone Between the Turan
Platform and Orogeny Structures of
the Tien Shan
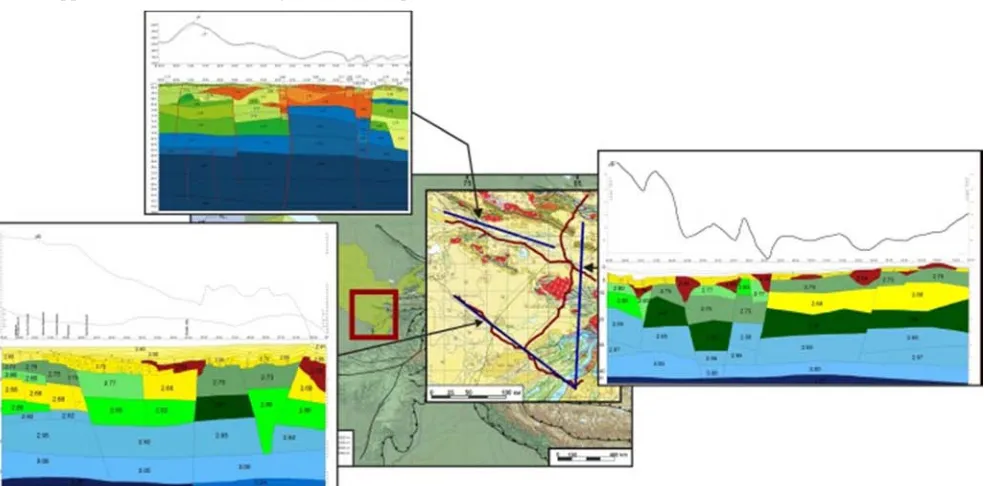
To study the deep structure of the area, density models were constructed using the lines of the ECWM data (figure 2). The basis of these models of the first approximation were seismo- geological sections according to the DSS, ECWM, the features of the upper part of the section were justified by the results of geological surveys, drilling, and the available materials of geological and geophysical studies carried out in previous years.
5.1. The Structure of the Earth's Crust Along the Profile I-I (Beshagach-Samarkand-Navoi-Dul-dul)
Profile I-I corresponds to the geotraverse Samarkand-Sarykazgan. The general character of the structure of the geo-density section is layered-block; conditionally, in the first approximation, it can be divided into the upper and lower crust (the boundary between them passes at depths of 20-22 km) (Figure 3).
The Moho surface sinks to the east from 40 to 43 km. We distinguish the Moho transition zone (σef = 3.10 g/cm3), whose thickness also increases in the east direction from 3.5 to 5.0 km.
LEGEND. 1 – Limestone; 2 – Carbonate-clayey rocks; 3 – Pz metamorphic rocks; 4 – Granites; 5 – Granodiorites; 6 – Crystalline shales
Figure 3. Density model along the I-I profile. (Atabaev and Mordvintsev, 2014).
In general, a rather heterogeneous structure of the upper crust (deeper than the roof of the crystalline basement), where geoblocks with completely different horizontal dimensions (10-50 km) and effective density (σef = 2.62-2.90
density coexist with dense and anomalously dense (for the depths under consideration). Particular attention should be paid to the eastern part of the profile, where sharply decomposed bodies (σef = 2.65-2.70 g/cm3) are distinguished at depths that
are not characteristic of them - 10-25 km, at the same time, abnormally dense and fairly extended blocks are fixed at the mark of 4-6 km, which is also not typical for them.
The established distribution of the density along the section is indirectly confirmed by materials along the DSS profile of Karabekaul-Koytash where, within this territory, a waveguide is depicted at comparable depths, characterized by sharply reduced values of reservoir velocity and effective density (Babadjanov, Mordvintsev).
The lower crust characterized by a more consistent structure, a general increase in density with a depth - from 2.9 up to 3.1 g/cm3 is recorded. The size of the outlined geoblocks is 50-90 km, their thickness is from 3 to 11 km.
A peculiarity of the structure of the upper part of the section (above the surface of the crystalline basement) is a fairly calm, monotonous occurrence of Paleozoic formations, represented on the basis of effective petrophysical parameters, mainly by carbonate, terrigenous-carbonate and metamorphic complexes (σef = 2.68-2.72 g/cm3) with an abundance of intrusive bodies of acid composition (granites σef = 2.56-2.6 g/cm3, granodiorites σef = 2.6-2.64 g/cm3). Intrusions, in some cases, do not reach the Paleozoic surface, located near the roof of the crystalline basement. The thickness of intrusive formations reaches 5.5-5.0 km, horizontal dimensions up to 40 km.
Bodies of increased basicity in the section are practically not mapped. The exception is a small object, supposedly of medium composition (σef = 2.72 g/cm3), with horizontal dimensions up to 6.0 km and a power of about a kilometer. The absence of bodies of increased basicity is indicated by the nature of the change in the magnetic field, which is negative on a large part of the profile, and its maximum values do not exceed 25 gammas. By the way, even above the selected object there is practically no magnetic anomaly, which makes it possible to assume that the object is strongly eroded.
Within the considered part of the geotraverse, several large discontinuous disturbances are distinguished, probably intersecting the entire earth's crust and serving as boundaries for geoblocks. In the central part, two parallel faults are fixed, which practically divide the profile into two parts: the western and the eastern ones. A feature of this zone of faults is that the area between them is unconsolidated and can serve as a favorable channel for the penetration of deep fluids.
From the perspective of oil and gas potential and the detection of other types of minerals, taking into account modern views [12, 15, 16] the sections of the profile are the most favorable where the contacts of abnormally dense and decompressed geological bodies are marked, regardless of their depth of location. These are, first of all, the central and eastern parts of the profile, where objects with σef = 2.65-2.70 g/cm3 and σef = 2.90-2.95 g/cm3 come into contact at
different depths. This dependence is established for many regions of Uzbekistan [12, 15, 16, 29]. This conclusion is also facilitated by the fact that the Paleozoic section over these sections of the profile is composed of limestones and carbonate-terrigenous rocks that can have the necessary filtration-capacitive properties and structure for the formation of oil and gas traps. The presence of large disruptive violations within these territories is an additional favorable factor.
5.2. The Structure of the Earth's Crust Along the Profile II-II (Guzar-Shakhrisabz-Samarkand-Chelak-Uchkulach)
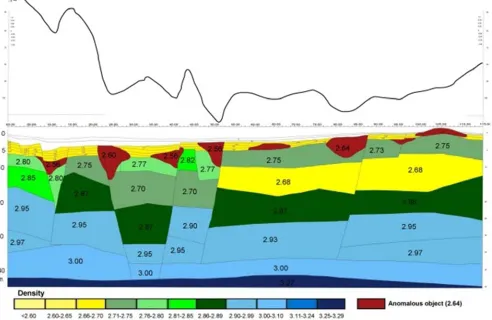
The obtained geological-geophysical model has a pronounced layered-block structure [4]. The section along the profile can be conditionally divided into 3 layers differing in their petrophysical parameters (Figure 4).
The roof of the lower layer under Baysuntau and in the southwestern end of the Hissar range passes at a depth of 8-10 km gradually decreasing to the center of the profile in the northern direction (≈ 14 km). In the south, at an depth of 16 to 20 km, an abnormally dense block is plotted (σef = 2.95
g/cm3). Under the Uchbash-Karshi Flexure Fault Zone
(UKFF), the lower layer is submerged to a depth of 22-25 km. In the middle part of the profile (the western spurs of the Zeravshan Range and below the hollow to the Gobduntau Mountains), this layer lies at a depth of 16-18 km and has a density of σef = 2.87 g/cm3, further to the north the boundary of this layer rises sharply to a depth of 12-13 km. The total range of variation of the effective density over the layer considered is σef = 2.87-2.95 g/cm3.
According to the interpretation above, the next powerful horizon stands out. In the south of the profile, its boundary runs at depths of 3-6 km gradually sinking towards the UKFF zone, where it reaches a depth of up to 8 km. At the center of the profile, starting from the northern boundary of the UKFF zone and to the end of the profile, the boundary of the middle layer begins to gradually rise to the north from 5 km to the surface (σef = 2.65-2.70 g/cm3). The range of density variation over this horizon is σef = 2.65-2.77 g/cm3. In this layer several anomalous objects are distinguished. One of them is an irregular shape up to 10 km in size, in the south of Baysuntau at a depth of 8-12 km with an abnormally low density σef = 2.56 g/cm3. Another area under the UKFF is at a depth of 5 to 11 km with an anomalously high density σef = 2.82 g/cm3 with dimensions up to 10 km. It is necessary to note in the central part of the profile a layer with a lower density for its depth, σef = 2.68 g/cm3, which extends north to the end of the profile. Above this layer, σef = 2.75 g/cm3, and below σef = 2.87 g/cm3. The depth of this layer under Gobdntau is from 7 to 14 km, under the Zeravshan depression from 10 to 15 km.
of the profile, nonmagnetic layers with an effective density of σef = 2.67-2.7 g/cm3 are mapped, which corresponds to carbonate-terrigenous rocks. Deeper, below them, the supposedly Lower Paleozoic metamorphosed rocks with an effective density of σef = 2.68 g/cm3 are distinguished.
Contacts between the blocks are predominantly tectonic. According to the interpretation, 5 major discontinuous disturbances are outlined forming the block structure of the obtained profile.
In addition to the described layers, some vertical zoning in the section of the earth's crust is also clearly visible on the model, when geological objects with increased density values are adjacent to objects with a slightly lower density. This type of crustal section is typical for the western immersion of the
Southern Tien Shan, in particular, for example, for the Central Kyzyl Kum.
The upper part of the section, corresponding to the Paleozoic formations, has a distinct stratified structure. Its lower boundary fluctuates at a depth of 4-2 km. A characteristic feature of the Paleozoic is the presence of numerous intrusive complexes that map along the entire profile. In the upper part of the section, limestones σef = 2.68-2.70 g/cm3, sedimentary rocks (clay, sandstone) σef = 2.67 g/cm3, metamorphosed complexes σef = 2.68 g/cm3, as well as magmatogenic. The granite grades σef = 2.50-2.58 g/cm3, granodiorites σef = 2.62 g/cm3. Thus, the range of density variation in the upper part of the section fluctuates σef = 2.30-2.72 g/cm3.
Figure 4. Geo-density model for profile II-II. (Atabaev and Mordvintsev, 2014).
5.3. The Structure of the Earth's Crust Along the Profile III-III (Mubarek-Guzar-Boysun)
Profile III-III has a NW-SE direction and it is located in the tectonic plan completely within the boundaries of the Karakumo-Tajik edge massif [11].
The general character of the structure of the geo-density section is the same as in the other profiles considered above -
Figure 5. Density model for profile III-III. (Atabaev and Mordvintsev, 2014).
The roof of the upper crust (deeper than the base of the Paleozoic basement), on the NW of the profile in the Bukhara tectonic stage from 4.5 to 6 km., Further, with the profile transition to the Chardzhou step, it extends from 6.6 to 8 km. After the KLFF zone, it is traced again at depths from 4.5 to 6 km to the end of the profile.
In general, we should note a rather heterogeneous structure of the upper crust, where geoblocks with completely different horizontal dimensions (10-50 km) and effective density are plotted (σef = 2.68-2.92 g/cm
3 ). For this part of the section, the rule of general increase in density with depth is not maintained. On the contrary, we note a certain alternation of blocks with different density, when objects with low density lie under dense and anomalously dense (for the depths under consideration). On the very SE of the profile, in the roof of this upper layer, a block with an abnormally low density σef = 2.50 g/cm
3 is allocated at a depth of 5 to 10-15 km.
Particular attention should be paid to the central part of the profile corresponding to the Karshi trough, where the block with σef = 2.68 g/cm
3
goes to a depth of 17 km. Under the Mubarek uplift to Kassantau at depths of 10 to 17 km, a decompact layer consisting of several blocks with σef = 2.68 g/cm3 is allocated. This layer is overlapped and lined with layers with σef = 2.8-2.85 g/cm
3
. The lower crust characterized by a more consistent structure, the total density increase with depth is fixed from 2.92 to 3.1 g/cm3. The size of the allocated geoblocks is 40-70 km, their thickness is from 3 to 11 km.
A peculiarity of the structure of the upper part of the section (above the surface of the crystalline basement) is the fairly monotonous occurrence of the Mesozoic and Paleozoic formations, represented mainly by carbonate, terrigenous-carbonate and metamorphic complexes (σef = 2.68-2.72 g/cm3), in the SE part of the profile there are intrusive bodies
of acid composition (granites σef = 2.56-2.6 g/cm
granodiorites σef = 2.6-2.64 g/cm3). Intrusions do not reach the Paleozoic surface, located near the roof of the crystalline base. The thickness of intrusive formations reaches 5.5-5.0 km, horizontal dimensions of 40-60 km.
Within the framework of the profile, several large discontinuous disturbances are distinguished, probably cutting the entire earth's crust and serving as boundaries for geoblocks. The border of the Bukhara and Chardzhou Steps passes under Kasantau, it is divided by a deep fault. In the central part of the profile, the KLFF zone is fixed, the main fault of which reaches the mantle. Other faults, identified by geo-density modeling, divide the layers into blocks and have a shallow laying. Some of them cross the upper layer and reach the lower layer, others stand out only within the Paleozoic.
6. Conclusion
The petrophysical characteristics of the intrusive rocks of the edge massif and the geosyncline system are similar in many respects. Exceptions are magnetic properties, in particular, magnetic susceptibility. Its meanings are larger in those intrusive formations that are located within the marginal massif.
The geological structure and petrophysical features of the pre-Mesozoic formations of Turan platform and Tien Shan orogeny is precise below:
6.1. Density Features
The most consistent boundaries in the pre Mesozoic section are:
(a)the surface of the crystalline base ∆σaverage = 0.18 g/cm3;
(b)the surface of the pre Mesozoic formations (relative to the Mesozoic-Cenozoic strata) ∆σaverage = 0.32 g/cm3. (c)Inside the Riphean-Paleozoic formations there are: (d)carbonate complex (∆σaverage= 0,03-0,05 g/cm3); (e)volcanogenic and volcanogenic-terrigenous complexes
with effusives of medium and basic composition (∆σaverage = 0,02-0.06 g/cm3);
(f)Upper Paleozoic molass sequences (∆σaverage = 0.05 -0.07 g/cm3);
(g)intrusive formations of ultrabasic, basic and average composition (∆σaverage = 0.15-0.2 g/cm3, σaverage = 0.1-0.18 g / cm3, σaverage = 0.07 g/cm3, respectively); (h)acid intrusive and effusive formations (σaverage =
0.05-0.12 g/cm3).
6.2. Magnetic Features
1. The most magnetic are the intrusive rocks of the basic, ultrabasic composition and effusives of the basic composition (up to 1500 x 10-6 SI units).
2. Metamorphic rocks of the crystalline base
(amphibolites, amphibolite schists, etc.) χaverage = up to 200х 10-6 units SI - for the edge massif; xaverage = 150 x 10-6 units SI of the geosyncline-fold system.
6.3. Velocity Characteristics
High and elevated boundary velocities are possessed by:
1. The metamorphic rocks of the crystalline base are Vgr
= 6200 m/s.
2. Carbonate formations, Vb= 5800-6000 m/s.
3. Basic and ultrabasic intrusive rocks. Vb= 5600 - 6000 m/s.
Reduced boundary velocities are noted:
1. Upper Paleozoic (Permian) terrigenous formations
(Vb= 5200 - 5400 m/s).
2. Zones of breaking disorders. Vb= 3800 - 4800 m/s.
According to results of surveys by earthquake converted-wave method, geodensity modeling and to geological and geomorphological data the explored territory is characterized by a layered and block structure. The position of the Karail-Lyangar flexure-fault zone is précised: it is located in the southern end of the Northern regional fault, which, according to B. B. Tal-Virsky divides Tien Shan orogen from the Turan platform.
A lot of zones with abnormal seismo-density parameters is established. Practically on all profiles exist the extensive zones of demultiplexing, to which there correspond the lowered velocities of distribution of elastic waves, allocated at the different hypsometric levels, on average an interval of depths of 10-24 km. The arrangement of such zones to several floors is frequent. Effective density at the same time changes from 2,6 to 2,8 g/cm3 (the last are inherent in deep levels).
Thus, in the explored territory within the Turan plate the platform mode is developed now. Under mountain constructions of the Western Tien Shan exists the orogeny mode of development with elements of a rifting.
Acknowledgements
In the end we would like to grace our colleagues Abdullaev R. N., Dalimov T. N., Babadzhanov T. L., Atabayev R. H., Hasanov R. R., Radjabov Sh. S., Yuldashev G. Yu., for their support during this work, their wise advices and for providing a lot of data about deep structure for this research of Western Tien-Shan.
References
[1] Abdullaev R. N., Dalimov T. N., Mukhin P. A., Bazarbayev E. R. The rifting processes in the development of Paleozoic folded areas. - Tashkent: Fan, 1989.
[2] Akhmedzhanov M. A., Baratov R. B., Bakirov A. B., Borisov O. M., etc. Precambrian of Central Asia. - Moscow: Science, 1982.
[3] Akhmedzhanov M. A., Borisov O. M. Tektonic of premesozoic formations of Central and Southern Tien Shan. - Tashkent: Fan, 1977.
[5] Atabaev D. H. The oil and gas perspectives of the Southern Tien-Shan geosyncline fold system. Abstract of the "Moredn forecast of the hydrocarbon potential and progressive tecnologies of the oil and gas prospecting works" conference, Tashkent, 17-18.11.2016.
[6] Atabaev D. H., Atabaeva N. E., Yanbukhtin I. R. Tectonic collisions of the Southern Tien-Shan. NUUz news, 3/2, 2016.
[7] Atabaev D. H., Gaipov A. B., Radjabov Sh. S., Nurkhodjaev A. K. The complexing of the subsurface and cosmogeological data for the lineament tectonic analysis and its correlation to the hydrocarbon perspectives. UUz news, 3/2, 2017.
[8] Atabaev D. H., Husanbaev D. D. The joint zone between the Turan platform and Tien-Shan orogen. Abstract from the "Actual problems of the modern seismology" conference, Tashkent, 12.10.2016.
[9] Atabaev D. H., Husanbaev D. D., Atabaeva N. E. The results of the earth crust copmlex research within the joint zone between the Turan platform and Tien-Shan orogens. NUUz news, 3/2, 2016.
[10] Atabaev D. H., Husanbaev D. D., Atabaeva N. E., Abdullaeva M. A. Oil and gas perspectives of the Middle Syr-Darya basin. Abstract of the "Moredn forecast of the hydrocarbon potential and progressive tecnologies of the oil and gas prospecting works" conference, Tashkent, 17-18.11.2016.
[11] Atabaev D. H., Yanbukhtin I. R. The density model of the eath crust along the line Mubarek-Guzar-Boysun. NUUz news, 3/2, 2016.
[12] Babadzhanov T. L., Kim G. B., Rubo V. V., Mordvintsev O. P., Hasanov R. R., Sidorova I. P. Abnormal lithospheric geoblocks and their connection with oil and gas and ore formation (on the example of the central regions of Central Asia)///Geophysics of the XXI century: 2003-2004 - M.: Scientific world, 2005. - Page 219-226.
[13] Babadzhanov T. L., Kunin N. Ya., Luk-Zilberman V. I. Structure and oil-and-gas content of the deep-shipped complexes of Central Asia according to geophysical data. - Tashkent: Fan, 1986.
[14] Babadzhanov T. L., Mordvintsev O. P. Features of the crust structure of Southwestern Uzbekistan.//Geologiya va mineral resurslar. 2001. No. 4. Page 42-46.
[15] Babadzhanov T. L., Mordvintsev O. P. To a question of hydrocarbons genesis at the choice of strategy of exploration works//Uzbek journal of oil and gas. - 2009. - No. 6.
[16] Babadzhanov T. L., O. P. Mordvintsev, D. O. Mordvintsev. A deep geological structure as a basis for forecasting of mineral deposits placement in the Central Asian region. Materials IGIG. 2012. Tashkent. 160 pages.
[17] Belousov V. V. Endogenous modes of continents. M, "NEDRA", 1978
[18] Butovskaya E. M., Atabayev H. A., Flenova of M. G. The crust structure of Eastern Uzbekistan and adjacent areas according to a seismological data. From the book. “Deep structure of crust of the territory of Uzbekistan”. Tashkent, 1971.
[19] Florian Wellmanna Guillaume Caumonb 3-D Structural geological models: Concepts, methods, and uncertainties Advances in Geophysics Volume 59, 2018, Pages 1-121
[20] G. Caumon P. Collon-Drouaillet C. Le Carlier de Veslud S. Viseur J. Sausse Surface-Based 3D Modeling of Geological Structures Mathematical Geosciences November 2009, Volume 41, Issue 8, pp 927–945
[21] Gordiyenko V. V., Zunnunov F. H., Tal-Virsky B. B, etc. Tectonosphere of Central Asia and Southern Kazakhstan. - Kiev: Naukova Dumka, 1990.
[22] Gordiyenko V. B., Buryanov V. V. Geophysical model of European tectonosphere. Kiev, "Naukova dumka", 1987.
[23] Hamrabayev I. H. (eds.) Crust and upper mantle of Central Asia. - Moscow: Science, 1977.
[24] Hamrabayev I. H. et al. Nature of layers and borders of a lithosphere of Central Asia. - Tashkent: GFNTI. 1998.
[25] Husanbaev D. D., Atabaev D. X., Radjabov S. S. The statistic model of the modern endogenous modes of Uzbekistan. “Geodynamics, magmatism and ore processing of Western Tien-Shan” conference, Tashkent, 2016
[26] Isaev V. I. The forecast of the oil and gas accumulation zones along the Krasnoleninskiy dome-Lyapinskiy mega trough traverse line (by the geodensity modelling data) Tomsk Politech University News, 2008, Vol.312, №1.
[27] Lobova G. A., Isaev V. I. Geodensity model and zones of the oil and gas accumulation of the pre-plate complex of the Yugorsk dome (Western Siberia). Tomsk Politech University News, 2009, Vol.315, №1
[28] Mirkamalov R. Kh. et al. The atlas of the Uzbekistan ore fields models. T: GP "NIIMR", 2010-100s.
[29] Mordvintsev O. P., Atabayev R. H., Hasanov R. R. Some features of the correlation of premesozoic formations petrophysical parameters in Southwestern Uzbekistan.//Problems of geology of the Phanerozoic of Tien Shan, Issue 1. Papers compilation of NUUz. - Tashkent, 2003. P. 193-196.
[30] Onno Oncken, Guillermo Chong, Gerhard Franz, Peter Giese, Hans-Jürgen Götze, Victor A. Ramos, M. R. Strecker, Peter Wigger The Andes: Active Subduction Orogeny.
[31] Structure and evolution tectonosphere. Papers compilation, - Moscow: IFZ Academy of Sciences of the USSR, 1987
[32] Sungchan Choi Chang, Whan Oh, H. J. Götze. Three dimensional density modeling of the EGM2008 gravity field over the Mount Paekdu volcanic area Volume118, Issue7 July 2013, Journal of geophysical research. Solid Earth.
[33] Tal-Virsky B. B. Geophysical fields and tectonics of Central Asia. - L.: NEDRA. 1982.