Published online November 26, 2014 (http://www.sciencepublishinggroup.com/j/ijmsa) doi: 10.11648/j.ijmsa.s.2014030601.11
ISSN: 2327-2635 (Print); ISSN: 2327-2643 (Online)
Exploration of the thermally prepared Iridium oxide (IrO
2
)
and tantalum pentoxide (Ta
2
O
5
) coated titanium anode in
the oxygen evolution reactions (OER)
Gracien Ekoko Bakambo, Joseph Kanza-Kanza Lobo, Omer Muamba Mvele
*,
Jérémie Muswema Lunguya
*, Jean-Felix Yamambe Senga, Peter Mangwala Kimpende
Chemistry Department, University of Kinshasa, P.O. Box 190, Kinshasa XI, Democratic Republic of Congo
Email address:
omer.mvele@unikin.ac.cd (O. M. Mvele), jeremie.muswem@unikin.ac.cd (J. L. Muswema)
To cite this article:
Gracien Ekoko Bakambo, Joseph Kanza-Kanza Lobo, Omer Muamba Mvele, Jérémie Muswema Lunguya, Jean-Felix Yamambe Senga, Peter Mangwala Kimpende. Exploration of the Thermally Prepared Iridium Oxide (IrO2) and Tantalum Pentoxide (Ta2O5) Coated Titanium
Anode in the Oxygen Evolution Reactions (OER). International Journal of Materials Science and Applications. Special Issue: Materials Science. Vol. 3, No. 6-1, 2014, pp. 1-6. doi: 10.11648/j.ijmsa.s.2014030601.11
Abstract:
A coat consisting of IrO2-Ta2O5 as a catalytically active layer on a titanium substrate was prepared by the thermaldecomposition method followed by the anodic electrolysis process in an aqueous solution of H2SO4 0.5 mol.dm-3 at 4 A.Cm-2
current density. The morphology and the composition of the coating were investigated both by the field emission scanning electron microscope (FE-SEM) coupled with the energy dispersive X-ray spectrometer (EDS), X-ray diffraction (XRD), and by X-ray photoelectron spectroscopy (XPS). The XRD and the XPS experimental results revealed that some of the texture coefficients of IrO2-rutile crystal preferentially grown and the crystal lattice changes with aging time in air furnace at 100 °C. It
was observed that at 4 A.Cm-2, this coated material behaves as a good catalytically active layer for oxygen evolution reactions (OER). The OER process leads to the corrosion of the surface banks layer by layer, and consequently the cracks appeared and expanded, resulting in fragmentation and further peeling. The EDS results revealed that during the electrolysis of the coated electrode there was a selective consumption of the iridium oxide. The presence of titanium metal was detected in the outermost coating. This might be originated from the titanium foil dissolved and diffused through the coated layer defects during the electrolysis process.
Keywords:
Iridium Oxide (IrO2), Tantalum Pentoxide (Ta2O5), Ti Metal, OER1. Introduction
Dimensionally stable anode (DSA) made of RuO2 and
TiO2 as a catalytically active layer coated on a titanium
substrate was prepared by the thermal decomposition method and successfully used for chlorine evolution reactions (CER) in the chloralkali industry [1]. Since then, many oxide mixtures and their different applications and properties were presented in the literature [2,3,4]. Thermally prepared IrO2
-based coatings deposited on titanium metal supports are the most promising anodes for electrometallurgy. Cheaper cost materials such as lead alloys are environmentally undesired materials and have been dismissed, even though they have application in the OER such as electroplating, electro-winning, electro-floatation, electrosynthesis, cathodic protection, and wastewater treatment. To be used as anodes
for the OER, the anode stability and the service life of these materials have to be deeply explored [4-9].
It is well known that the traditional DSA has a very limited service life in the OER due to the serious corrosion of RuO2 which is an active component in the oxide mixture.
Iridium dioxide (IrO2) has become an indispensable active
component for high performance anodes owing to its good activity of OER and better corrosion resistance compared to other precious metal oxides. The stability of IrO2 can be
further improved by the addition of inert components such as TiO2, SnO2, Ta2O5, or Nb2O5 in order to form mixed metal
oxides. It was reported that the mixed metal oxide anode with a composition of IrO2-Ta2O5 (Ir/Ta being in 7:3 in mole
For a non-consumable coated anode used for the electrogalvanization of a sheet of steel with high current density exceeding 100 A.Cm-2 of the OER in an aggressive medium (H2SO4, pH=1~2), it is necessary to understand the
deactivation process of the oxide in order to further improve the anode stability and consequently increase its service life [11].
Some researchers have reported on the degradation mechanism of an IrO2-Ta2O5 coated titanium oxide anode in
different media [12-13]. They observed that the process with very little amount of initial oxide loading leads to significant changes of the electrochemical parameters, especially above the critical loading for OER. In the case of a thick layer (often used for commercial application), the degradation mechanism seems difficult to establish because of the long time scale during practical use in electrochemical processes, resulting from slow deterioration. The degradation mechanism of a thick layer is crucial for the control and for the assurance quality of the commercial anodes.
In the present work, the IrO2-Ta2O5 coated titanium anode
was synthetized, and accelerated electrolysis tests were run. The morphology and the composition of these oxide anodes were investigated in detail.
2. Experimental
2.1. Preparation of the Titanium Supports
Titanium substrates were prepared from 2 mm thick titanium plates containing Ti (≥ 97%), N (≤ 0.012%), C (≤ 0.02%) and Fe (≤ 0.06%); they were cut into pieces of dimensions 100 × 100 × 2 mm3.
Prior to the oxide layer deposition, the titanium sheets were treated by sandblasting with surface roughness equal to 3.0 µm to 3.5 µm. The foils were then cleaned in chloroform and etched in the boiling oxalic acid (10 %) for a period of 60 minutes. They were rinsed in deionized water, and then ultrasonically cleaned in acetone before being immediately dried in air furnace at 100 °C and analysed.
The average roughness parameter used in the present study was calculated using the Equation proposed in the literature [14].
2.2. Preparation of the Coating
A typical synthesis of coatings made of the IrO2-Ta2O5
with 70 % IrO2 concentration on a titanium foil was
performed as follows: an aqueous solution was prepared in a 50 mL glass bottle by mixing (in a mole ratio of 7:6 respectively) appropriate analytically pure precursors of hydrated hexachloro iridic acid, H2IrCl6.6H2O (dissolved in
HCl) and pentachloro tantalum, TaCl5 (dissolved in
methanol).The prepared titanium film was immersed in this mixed solution. To improve the adhesion of the oxide on the titanium surface, a three steps procedure was designed. Firstly, the solution was maintained at 40 °C and heated at 150 °C for 10 min in air furnace; secondly, the electrodes were treated in air furnace at 300 °C for 30 min, and finally
the electrodes were treated at 500 °C in muffle furnace for 60 min. In each step of the calcinations, 4 g.m-2 of the oxide mixture deposited on the titanium foil was obtained. The calcinations were carried out in static atmosphere. Enough loading (ca.30 g.m-2) of Iridium oxide was attained eventually.
2.3. Accelerated Lifetime Tests (ALT)
To record the change of the cell voltage with electrolysis time, an accelerated electrolysis test of the samples was performed by using a DDG-3D constant potentiometer instrument. The produced electrode was mounted in the PTFE holder, having an exposed surface area of 1 cm2 for anodic electrolysis. A platinum inert plate counter electrode and the electrolytic solution containing 0.5 mol.dm-3 H2SO4
were used. The anodic current density was maintained at 4A .Cm-2, and electrolysis carried out at 50 °C. The potential (E) as a function of time (t), E = f(t) curves, were then recorded simultaneously, bearing in mind that the service life of the electrodes varies with electrolysis time.
In our experiment, it was observed that although the coated anodes were employed several times, they were still keeping their good catalytically active properties (not shown here). This phenomenon proved the stability of the produced electrodes.
2.4. Physical Characterizations
It is well known that the growth speed of a crystal is normally proportional to 1/d (hkl), where d is the interplanar distance of (hkl) planes [15].
The texture coefficients, TC (hkl), of IrO2 rutile crystal,
can be calculated by using the measured integrated intensities from the equation suggested by J.M. Hu et al. [12]:
( )
( )
( )
( )
( )
11 1 −
= o
∑
n Io hkl hkl I n hkl I hkl I hklTC (1)
where I( )hkl is a measured intensity of
( )
hkl plane, Io( )hkl isthe referenced intensity from the ASTM standard powder pattern diffraction data,
n
is the total number of reflections and( )
hkl are the Müller indexes.The microstructures of the products were measured by field emission scanning electron microscopy (FE-SEM; JEOL JSM-6700F) and the average micro-composition was analysed using energy dispersive X-ray spectrometer (EDS) coupled with the FE-SEM. The X-ray fluorescence (XRF) instrument was used to measure the coat loading. The phase identification of the coating layer was carried out on X-ray powder diffraction (XRD) patterns, using a D/MA2550 X-ray diffractometer with Cu-Kα radiation (λ=1.54056 Å) and nickel filter (Rigaku Co., Japan).
3. Results and Discussion
3.1. The Curve Voltage Against Time Curve, E= f(t)
Figure 1. Variation of cell voltage with electrolysis time for IrO2-Ta2O5
oxide anodes at 4 A.cm-2 in 0.5 mol.dm-3 H
2SO4 solution, (A: the one
reported in the literature [12]).
The experimental results show that the change of the cell voltage as a function of electrolysis time during the accelerated life test has the similar characteristic. From Figure 1, it can be clearly seen that the cell voltage firstly decreases during the initial stage of the electrolysis. This could be attributed to the wetting of the small accessible inner surface of the oxide electrode due to its porous nature [6,11]. For a long period of time, the cell voltage is generally stable. Finally, the cell voltage rises abruptly; this phenomenon suggests the complete deactivation of the anode. The service lifetime of the anode is expected to be about 4000 hrs.
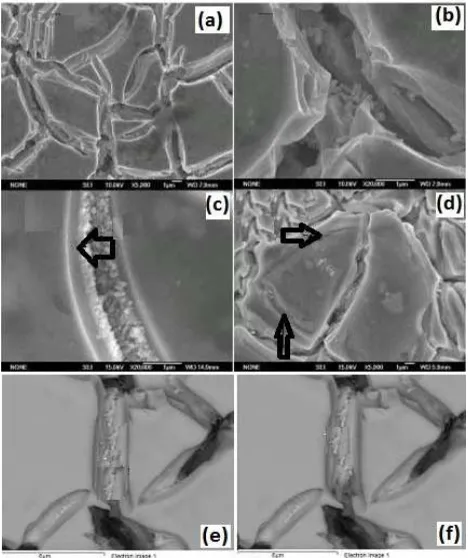
3.2. The Morphology
From Figure 2a and Figure 2b, one can observe that the surface with a well-defined “cracked mud” structure is formed, consisting of flat areas. There were no aggregations of IrO2 particles. The surface morphology observed in the
present investigation was different from the one reported in the literature [16]. The morphology of the coating significantly depends on the preparation procedures such as the pre-treatment of the substrate and the painting method of the coating solution. The micrographs shown in Figure 2 were taken from different coat loadings. From these micrographs, it is noticeable that at a low loading (less than 5 g.m-2) similar structures were obtained but with less deeper cracks (refer to Figure 2a and Figure 2b for the fresh samples, and to Figure 2c and Figure 2d corresponding to the samples obtained after 2000 hrs electrolysis).
It is well known that a good active coating should always be brittle and porous in order to ensure good contact with the electrolyte. From the micrographs displayed in Figure 2, it can be seen that there are lots of surface and interface such as
holes and moreover, on the bed of the cracks, one can observe the generation of rodlike particles (Figure 2e and Figure 2f). These kindf of generated particles have excellent active and very larger surface areas compared to the one reported in the literature [16]. The number of these fine particles on the areas offers the catalytic activity. Figure 2 also shows that no IrO2 aggregates on the flat areas,
assuming that the cracks have an effective influence on the catalytic activity. However, the IrO2-Ta2O5 anode deactivates
with electrolysis lifetime. The latter is influenced by the composition of the coating.
The characteristic in morphology shows the oxygen evolution corroding mechanism of the oxide anodes, which is still in the stable flat period at E = f(t) curves and the activation of the anode with electrolysis time (Figure 2c and Figure 2d). The mechanism in the oxide anodes can be summarized as follows: the oxygen evolution proceeds just like the stormy waves corroding bank in a lake, in which oxygen evolution is due to no additional stirring in electrolyte, and occurring layer by layer. The layer thickness depends on the coating deposition procedures. It can be deduced that the lost mechanism of oxide layer in the region results in the loss of IrO2 and Ta2O5 component together. The
characteristic in morphology also reveals that it is important that the OER takes place in the sites with cracks produced during the thermal decomposition process.
Figure 2. FE-SEM surface secondary electron images of oxide coating (a) and (b): the as-prepared materials; (c) and (d): materials prepared after 2000 hrs electrolysis; (e) and (f): formation of rodlike particles.
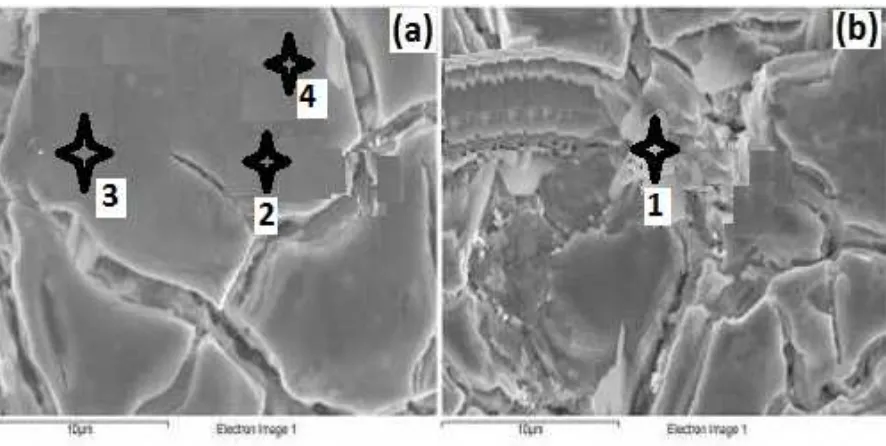
which are indicated by a mark in Figure 3.
Figure 3. SE-SEM surface secondary electron images of oxide layer after 2000 hrs electrolysis, (a) cracks generation and development; (b) fragmentation and peeling.
3.3. The Oxygen Evolution Corroding Process
Some deeper insight into the oxygen evolution corroding process taking place on the coating layer was investigated by using a FE-SEM coupled with EDS microanalyser. The characteristic in morphology (Figure 2c) reveals that when the corroding process is occurring on one side, there is generation of cracks with simultaneous expanding of the coating layer on the other side. The oxygen evolution reaction occurred on the interface (or surface), especially on the bed of the cracks. The great pressure brought forth in the holes under the bed of the cracks resulting from the OER can break up the coating layer; hence causing the titanium substrate passivation and the passive film, once dissolved in an aggressive media (such as the sulphuric acid solution). This process produces the fragmentations and peelings at a higher current density.
3.4. The Composition
The initial load of the coating layer made of the Ti/IrO2
-Ta2O5 was determined by XRD using a calibration curve data.
The initial load of the coating layer reached 30 g.m-2 of the Iridium eventually after 5 min calcination. In each step of calcination, an average concentration of the oxide mixture of about 4g.m-2 was obtained.
The composition of the as-prepared samples was examined by XRD. Typical XRD patterns of the as-prepared layer and of the one prepared at 100 °C in air furnace at different aging times (8 hrs, 16 hrs, 32 hrs) are shown in Figure 4. Compared with the standard diffraction patterns of the ASTM, no characteristic peaks from impurities were detected. The experimental results show that the coating layer is constituted only of TiO2 (rutile) and IrO2. Peak
related to the amorphous Ta2O5 are absent.
Figure 4. XRD patterns of the coating layer of Ti /IrO2-Ta2O5 electrodes
with different aging times in air furnace at 100 °C. The Bragg peaks are followed by the Müller indexes.
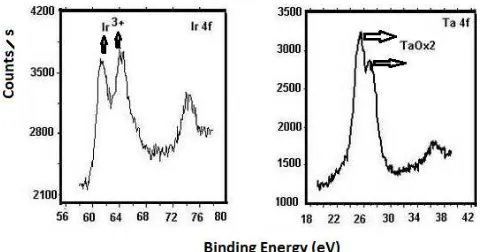
To verify the formation of the tantalum oxide, Ta2O5, the
X-ray photoelectron spectroscopy pattern was taken as shown in Figure 5. From this figure, it is shown that the amorphous Ta2O5 (accurately at higher oxidation state, Ta2OX)
is present, as previously reported by Roginskaya for β-tantalum pentoxide at 420 °C [17].
The XPS spectrum related to Iridium oxide was fitted with three peaks and the chemical shift relative to the third peak is quoted in parentheses: Ir2O3 or Ir3+ (simple bond: -O-) at 61
eV (13 eV shift), Ir3+ (simple bond: -O-) at 64 eV (10 eV shift), and IrO2 or Ir 4+ (double bond: O=) at 74 eV (0 eV
shift). The first two peaks are associated with Ir3+ oxidation state (Ir3+ 2P3/2) and (Ir3+ 2P1/2), and the third one is
associated with Ir4+ oxidation state (Ir4+ 2P3/2). The
quantity of Ir 3+ is increased. The presence of the Ir 3+ state on the oxide surface is important; it can play a similar role as observed in titanium dioxide doped with metal atoms, which can trap the photo-generated electrons, leaving behind unpaired charges to promote photo-activity [18].
Figure 5. XPS spectra of as-prepared coating layer.
The 2θ and the texture coefficients TC (hkl) of IrO2 rutile
crystal were analysed. Figure 4 shows that when working in air furnace at 100 °C, the deviation of 2θ angle with different aging times is noticeable. The position of 2θ decreases when the aging time increases. Taking into account the Bragg diffraction law [19]:
λ θ n dsin =
2 (2)
where θ is diffraction angle, λ is radiation wavelength (
λ
= 0.154 nm for Cu Kα) and d the interplanar distance of( )
hkl planes. It is observed that there is a crystal lattice change (d
increasing or θ diminution) resulting from the compression stress in coating layer or atomic interactivity during the aging time.Figure 6 reveals that the interplanar distance (d) of some of the texture coefficients TC ( )hkl of Ti/IrO2 rutile crystal, such as TC (110), TC (101) increased. As presented in Figure 7, the interplanar distance of TC (110) is the longest with a relative loosening of bond linkages, whereas the ones of TC (002), TC (200), TC (211) and TC (220) decreased. The TC (220) plane is the shortest. This observation is in perfect agreement with the one reported in the literature when using sulphuric acid solution (0.5 mol.dm-3 H2SO4) as electrolyte [12].
Figure 6. Deviation of 2θ with different aging times in air furnace at 100°C.
Figure 7. Texture coefficient variations of the various crystallites planes Ti/IrO2 with different aging time in air furnace at 100°C
The EDS results are displayed in Table 1, where it is shown that there is a little difference on the bed flat areas by comparing the rodlike particles on the bed of cracks, which have some single iridium but not iridium oxide (IrO2)
aggregates. The experimental result shows that a selective consumption of the iridium oxide in the outermost layer of the coating and the titanium oxide doping takes place. This is due to the electrochemically dissolved titanium substrate through defects of the coating layer in contact with electrolytic solution. The XRD results show the presence of titanium oxide in the layer after the anodic electrolysis and the intensity of TC (002) reflection plane increases with electrolysis time.
Table 1. Surface composition analysis for the fresh (as prepared) materials
Number Spectrum Atomic %
Ta Ir O Ti Others
1 Fig.3(b):1 15.38±0.12 31.09±0.12 75.26±0.18 - -
2 Fig.3(a):2 18.78±0.15 12.83±0.11 68.44±0.15 - -
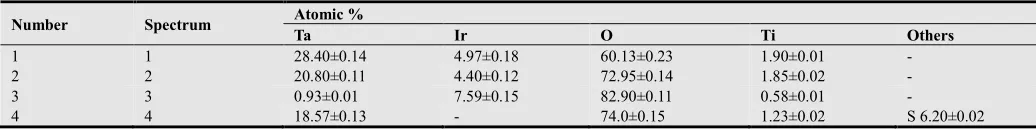
It can be deduced that the loss mechanism of the oxide layer in the stable region results mainly from the electrochemical process, which dissolves layer by layer the coating oxide, generating cracks (defects) and titanium substrate passivation. The passivated film is then dissolved.
Table 2. Surface composition analysis after 2000 hrs electrolysis process
Number Spectrum Atomic %
Ta Ir O Ti Others
1 1 28.40±0.14 4.97±0.18 60.13±0.23 1.90±0.01 -
2 2 20.80±0.11 4.40±0.12 72.95±0.14 1.85±0.02 -
3 3 0.93±0.01 7.59±0.15 82.90±0.11 0.58±0.01 -
4 4 18.57±0.13 - 74.0±0.15 1.23±0.02 S 6.20±0.02
To avoid the build-up of non-conductive TiO2 between the
base component and the coating in anodes used in zinc plating of steel strip, where very high current densities are employed, a thin intermediate layer such as platinum is usually suggested.
4. Conclusion
The experimental results obtained in this work indicate that the morphology of the coat layer made of Ti/IrO2-Ta2O5
anode consists of flat areas, deeper cracks but no IrO2
aggregates. Holes and some particles with rodlike morphology are generated on the bed of the cracks. The deterioration process of oxide coating during continuous anodic electrolysis are bubbling, corroding the surface banks layer by layer, which results in residual loading decrease, and appearance and expansion of cracks. This leads to fragmentation and peeling. The anodic electrolysis of the electrode causes the selective consumption of iridium oxide in the outermost layer of the coating. The electrochemical process dissolves the titanium substrate through defects of the coating layer in contact with electrolytic solution, hence directly inducing the titanium oxide doping.
References
[1] Beer HB, J. Electrochem. Soc. 1980; 127, 303C.
[2] Trasatti S, Electrochim. Acta. 1991; 36: 225.
[3] Trasatti S, in: Lipkowski, J, Ross PN. The Electrochemistry of Novel Materials,VCH, Weinheim. 1994: 207-295.
[4] Trasatti S, Electrochim. Acta. 2000; 45: 2377-2385.
[5] Cardarelli F, Taxil P, Savall A, Comninellis Ch, Manoli G, Leclerc O, J. Appl. Electrochem. 1998; 28: 245.
[6] Morimitsu M, Tamura H, Matsunaga M, Otogawa R, J. Appl. Electrochem. 2000; 30 : 511.
[7] Kulandaisamy S, Rethinaraj JP, Chockalingam SC, Visvanathan S, et al., J. Appl. Electrochem. 1997 ; 27: 579.
[8] Mraz R, Krysa J. J. Appl. Electrochem. 1994; 24: 1262.
[9] Bock C, Spinney H, MacDougall B. J. Appl. Electrochem. 2000; 30: 523.
[10] Comninellis Ch, Vercesi GP. J. Appl. Electrochem. 1991; 21: 335.
[11] Kamegaya Y, Sasaki K, Oguri M, Asaki T. Electrochim. Acta. 1995; 40(7): 889-895.
[12] Hu JM, Meng HM, Zhang JQ, Cao CN. Corrosion Science. 2002; 44: 1655-1668.
[13] Xu LK, Scantlebury JD. Corrosion Science. 2003; 45: 2729-2740.
[14] Seitavuopio P, Heinämäki J, Rantanen J, and Yliruusi J. Monitoring Tablet Surface Roughness during the Film Coating Process, AAPS Pharm.Sci. Tech. 2006; 7(2), Article 31.
[15] Vere AW, in: Crystal Growth: Principles and Progress. Dobson PJ, Ed. Plenum Press, New York. 1987: 17-18.
[16] togawa R, Morimitsu M, Matsunaga M, Electrochimica. Acta. 1998; 44: 1509- 1513.
[17] Wachtman JB, Kalman ZH, in: Characterization of materials, Butterworth- Heinemann. Manning, Greenwich. 1993: 305.
[18] Ekoko GB, Lobo JK-K, Mvele OM, Muswema JL, and Yamambe, J-FS. Effect of an External applied potential on the photocatalytic properties of manganese-doped titanium dioxide. American Journal of Physical Chemistry. 2014; 3(4): 41-46.