Fluid Flow, Heat Transfer, Mixing Time and
Inclusion Motion in Molten Steel Continuous
Casting Tundish
Abdelbagi Mohamed Abdalla#1, Omer Ahmad Altohami #2
1 #
Mechanical Engineering Department, University of Kordofan, Sudan
2 #
Mechanical Engineering Department, University of Karary, Sudan
Abstract
The project of “Investigation to improve the secondary steel manufacturing process by adopting mathematical models“ was considered to contribute to the Strategic Steel Research in Sudan. The project was suggested as a close collaboration between Depart of mechanical engineering-University of Karrary and the steel factories in Sudan. Steel cleanliness, which is aim of this project, is a focal point for Sudan young steel industry in order to maintain and strengthen their in-market and global competitiveness. The steady velocity and temperature fields were obtained by computationally solving,the Reynolds-Averaged Navier-Strokes (RANS) equations together with the energy equation, using the standard k-ε model of turbulence. These flow fields were then used to predict the inclusion removal by numerically solving the inclusion transport equation. For the mixing time characteristics transient solution was performed. The calculations were carried out using the commercial Computational Fluid Dynamics (CFD) software ANSYS-FLUENT 6.3.26.
The models results were compared and validated with experiments results, plant measurements and models reported in the open literature. The predicted inclusion separation fractions to the top surface (slag) were compared and well agreed with the results from [1]& [2]. Also a change of the inlet position is compared due to inclusion removal and mixing time. The inclusion removal efficiency increases with an increase in the distance between the inlet gate and outlet gates. The mixing time spent was longer by the far inlet gate, which was explained the better inclusion removal efficiency. Temperature distribution analysis was performed under steady state conditions for the constant heat fluxes from walls and from free surface of the tundish. The computed temperatures fields of steel melt in the tundish interior were showed approximately equalized temperature distribution, which was agreed well with the results from [1].
The project findings considered as first step and intended to be hopefully applied in the steel factories in Sudan.
Key words: Steel cleanliness; Tundish; Turbulent flow;Mixing time; Inclusion separation; Temperature distribution;Model validation;CFD.
I.Introduction
Steady 3-D flow of steel in the continuous casting tundish is simulated with finite-volume based software (fluent), the turbulence model used is the standard k-ε, Inclusion trajectories are calculated by integrating each local velocity, considering its drag and buoyancy forces. A “random walk” model is used to incorporate the effect of turbulent fluctuations on the particle motion. For the mixing time curves and its data, unsteady 3-D flow is used, to explore the fluid flow mechanism [2] [13]. Plant observations and final products mechanical properties tests in GIAD steel factory in Sudan have found that a serious quality problems, mainly brittleness of the final product (building bars), which may be as the results of many factors, including inclusion entrapment, slag entrapment in the steel melt and flow pattern in the tundish. As the results, these problems affect the productivity so as the improvement of the final product quality, which are permanent requirements concerning the continuous casting process, this was the motivation signal to conduct this research.
Sometimes the facilities to carry out experimental work may not (yet) available, in such case the CFD user must depend on among other on comparisons with high-quality data from closely related problems documented in the literature [15]. Therefore the validation and verification of the present models are carried out using results from experimental and modeling results from other researchers.
In the present work, fluid flow and inclusion separation as well as heat transfer analysis has beencarried out on a six-strand tundish without use of any flow modifiers.
II. Model description& Pre-processing: geometry and grid generation
A. Model description
The geometry of the multi-strand Tundishes (which, is used to be a guide of the setting of CFD model for the use of the practical investigation in the targeted factories in Sudan) considered in the present study was the same as that used by Merder et al. [1] and Gupta and Dewan[2], which is a six-strand trough-type tundish designed for casting ingot employed for small cross-section rolled products, such as wire, rods, etc. Symmetry relative to the transverse plane passing through the inlet of the tundish is depicted in fig, 1. The detailed constructional parameters are: L1 = 2785 mm, L2 =
2700 mm, L4 = 500 mm, L5 = L6 = 1000 mm, W1 =
1040 mm, W2 = 850 mm, W3 = 640 mm, W4 = 450
mm and steel bath height H = 740 mm. The inlet and outlet dia- meters of the gate are taken as 66 mm and 14 mm, respectively [1] [2]. The following properties of liquid steel were taken: specific
density equal 7010 kg/m3, specific heat equal 821J/kg.K, thermal conductivity 30.5 W/m.K, and viscosity 0.007 kg/m.s[1] [2].
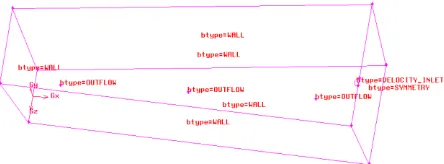
Fig.1. Schematic illustration of geometric and dimensions for the tundish (symmetric half of the
tundish) employed in the numerical calculations. B. Pre-processing: geometry and grid generation Symmetry assumed:
In the present work, symmetrical flow is presumed. Therefore Fig. 3 depicts a 3D half model of the tundish, which is also indicating boundary conditions.
For any CFD flow problem to be solved, Pre-processing is needed, to comprise the preparation of the geometry as well as dividing the domain of the flow into cells (grid). Pre-processing can be described as process of geometry and initial generation of the grid.
Pre-processing generates and initialize grid before the CFD solution process is commenced and taking place. Most CFD codes consist of an option to alter the grid based on the solution in progress, also recognized as solution adaptive-gridding. These grid refinement or coarsening,occur during the solution procedure and are clearly not part of pre-processing in CFD models. The pre-processor used in the present research is ANSYS-GAMBIT 2.4, which is the pre-processor for ANSYS-FLUENT[16].
Fig.2 Illustrate the grid distribution in half of the tundish.
L2 W
1
W 2 W3
W4
L5
L4 L
Ш. Quantitative indicators of tundish performance
To predict tundish performance, one should know the exact behavior of a tundish, what is happening inside it or how the fluid element is passing through it. This can be done by one of the two ways [22]:
a) By directly knowing how the fluid is passing through the tundish, ie. the complete velocity distribution of the fluid within the tundish.
b) By studying the flow characteristics of the system in terms of some defined parameters, which can give the idea of the flow behavior inside the tundish and its performance. ie. Quantification of performance in terms of some defined parameters like ‘mixing time characteristics curves‟, „Residual ratio of inclusions‟ etc. So the performance indicating parameters like „mixing time characteristics curves‟ and „Inclusion separation‟ are carried out in the present work.
IV. General Formulation of Flow Phenomena in Tundishes Fluid Flow
A 3D fluid flow model is founded on the continuity equation and Reynolds-averaged Navier-Stokes (RANS) equations for incompressible steel melt, conserving mass (one equation) and momentum (three equations) in addition to the energy equation at every point in a computational domain [4] [5] [8].
For most of the CFD problems, in addition to solve the above mentioned equations, in its original form, turbulence modeling is incorporated to capture the critical effects of turbulent flow without having to resolve the actual small length and time scales of turbulent motion[21] [23].
A. Governing Equations
The mathematical equations, which govern the computed fluid flow and inclusion separation are developed, and are solved by ANSYSFLUENT. The equations are represented in the Cartesian coordinate system and index notation. For a steady flow, these equations can be expressed as follows[4] [5]:
The continuity equation has the following form: Continuity:
𝜕
𝜕𝑥𝑗 (ρuj) = 0 (4.1)
The momentum conservation equation is to be expressed as follows:
𝜕(ρ𝑢𝑖) 𝜕𝑡 + 𝜕(ρ𝑢𝑖𝑢𝑗) 𝜕 𝑥𝑖𝑗 = - 𝜕𝑃 𝜕𝑥𝑖 + 𝜕 𝜕𝑥𝑗(𝜇eff
𝜕 𝑢𝑖
𝜕𝑥𝑗+ 𝜕𝑢𝑗 𝜕𝑥𝑖) + ρgi
(4.2)
μeff is the "effective viscosity" defined in the
following equation[4] [5] [7] [10]: μeff. = μ + μt( 4.3)
Here, i and j each represent the 3 coordinate directions, (x,y,z) and repeated indices imply summation. The effective viscosity,µeff, depends
mainly on the turbulence parameters K and ε,found by solving two further transport equations.
The effect of thermal convection on the flow is accounted for with the Boussinesq approximation, which accounts for thermal buoyancy forces via the last term in Eq. 4.2
The effective viscosity appeared in Eqs. (4.2) has to be represented in terms of a turbulence model. In the present case, we have used the version of the K -Ɛ model of Launder and Spalding [17]in which K is the specific turbulence energy and Ɛ is the rate of turbulence energy dissipation. In many cases of turbulent flows, this model yields results close to experimental results, with limited computational outlays[1][4] [5] [8] [12] [23]
The associated relationships and the method of calculating K and Ɛ are as follows [4] [5] [8] [12]:
Turbulent kinetic energy [5, 6, 8, 14]: 𝜕(ρk) 𝜕𝑡 = 𝜕 𝜕𝑥𝑖 [(𝜇 + μt 𝜍𝑘) 𝜕𝑘
𝜕𝑥𝑖)] + G - ρ Ɛ (4.4) Dissipation rate of the turbulent kinetic energy: 𝜕(ρ Ɛ) 𝜕𝑡 = 𝜕 𝜕𝑥𝑖 [(𝜇 + μt 𝜍 Ɛ ) 𝜕 Ɛ 𝜕𝑥𝑖)] +
(𝐶1 Ɛ Ɛ𝐺−𝐶2 Ɛ 𝜌Ɛ2) 𝑘
(4.5)
Where the generation of turbulence kinetic energy:
G = μt 𝜕𝑈𝑗 𝜕𝑥𝑖 [(
𝜕𝑈𝑖 𝜕𝑥𝑗 +
𝜕𝑈𝑗 𝜕𝑥𝑖)](4.6)
Empirical constants used in k- Ɛ model [3] [4] [6]are as follow:
𝐶1 Ɛ 𝐶2 Ɛ C𝜇 𝜍𝑘 𝜍 Ɛ
1.44 1.92 0.09 1 1.3
In this model, the effective viscosity is calculated from the relations:
μeff
(4.7) Where:
μt = C𝜇 ρ𝐾 2
Ɛ[4] [5] [8] [9] (4.8)
The conservation equations (4.4) and (4.5) can be solved in order to calculate K and Ɛ. Since these equations involve velocity terms, which are unknown at this stage this involves a lengthy iterative procedure.
In order to determine the distribution of temperature fields inside the tundish, mathematical model include the general equation of energy conservation for an incompressible Newtonian fluid, in the following form [1] [2] [16]:
𝜕(ρT) 𝜕𝑡 + 𝜕(ρ𝑢𝑗𝑇) 𝜕𝑥𝑗 = 𝜕 𝜕𝑥𝑗( 𝑘𝑒𝑓𝑓 𝑐𝑝 𝜕T
𝜕𝑥𝑗) (4.9) The effective thermal conductivity coefficient can be written as follows:
Keff = ʎ + kt(4.10)
And the turbulent thermal conductivity is termed as:
Kt =
𝑐𝑝 𝜇 𝑡
𝑃𝑟𝑡 (4.11)
B. Tracer Dispersion
Because of the practical difficulties in obtaining and interpreting detailed knowledge of fluid flow pattern experimentally, an alternative approach to obtain the knowledge of how long different fluid elements remain in the tundish is obtained using a mixing time characteristics curves[1].
Tracer dispersion is an important tool in tundish characterization, used in the present work for steel grade change in order to estimate the mixing characteristics[1][2]. Tracer dispersion may be represented by
𝜕
𝜕𝑡((ρc) + 𝜕
𝜕𝑥𝑖(ρ𝑢𝑖𝑐)+ 𝜕 𝜕𝑥𝑖(ρ𝐷𝑒𝑓𝑓
𝜕c
𝜕𝑥𝑖) = 0 (4.12) In which Deff is an effective diffusivity is the sum
of the molecular diffusion coefficient and the turbulent diffusion coefficient
Deff = Dm + Dt(4.13)
The turbulent diffusion coefficient is determined from the following relationship (as summing that the turbulent Schmidt number is equal to unity)
𝜌𝐷𝑒𝑓𝑓
𝜇𝑒𝑓𝑓 ≅ 1(4.14)
The presented system of equations was solved numerically by the control volume method in the three-dimensional (3D) domain.
A zero-flux condition is imposed on Eq. (4.12) on all solid surfaces, symmetry planes, and free surface.
C.Concentration (species) conservation equation
In steel process non-metallic inclusions enter the tundish as deoxidization products together with steel from the ladle or slag re-entering the melt or are the product of tundish lining erosion. In this research only the first type considered. In the numerical simulations thus onlythe inclusions come to the tundish with liquid steel, with the same initial velocities as steel, were tracked [11]. The transport of disperse phase can be treated on pre-calculated flow and turbulence field. There are two ways of modeling the discrete phase transport. The first approach is Langrangian particle tracking method, which is a full trajectory calculation. In this approach, each particle is treated separately and its trajectory is calculated by integrating local velocity. The differential equation, describing the motion of particles in the liquid, considers the different forces acting on particle, such as buoyancy force,drag force, added mass force and additional forces, but in this work only the drag-, buoyancy forces were considered, because the of negligible effect of other forces as reported in the literature [11] [20]. The second approach is the simple diffusion/convection approach. The particle concentration movement, due to turbulent transport and diffusion, is modeled by solving a transport equation, with the particle rise velocity as an extra convective component in the upward direction. When particle concentration is the dependent variable, the terminal rising velocity of particle is added to the velocity of the fluid[11].
In the present work inclusions trajectories were calculated using the Langrangian particle tracking method (discrete random walk model), which solves a transport equation for each inclusion as it travels through a previously calculated velocity field [11].
𝑑𝑙𝑝𝑖
𝑑𝑡 = 𝑢𝑝𝑖(4.15)
Where lpi is inclusion location at any time in m.
The inclusion velocity equation can be derived from the force balance. Here the drag force, Fd,
and the gravitational force, Fg, are considered. Thus
the total force acting on the inclusion, F, is represented by
F= 𝑚𝑝𝑎𝑝= 𝑚𝑝 𝑑𝑢𝑝
𝑑𝑡 = 𝐹𝑑 + 𝐹𝑔 = 𝜋 8𝑑𝑝
2𝜌𝐶
𝐷 (𝑢𝑝- 𝑢)2 - 𝜋
6𝑑𝑝 3𝑔 (𝜌 - 𝜌
𝑝)(4.16)
This yields the following: inclusion velocity equation 𝑑𝑢𝑝𝑖 𝑑𝑡 = 3 4 1 𝑑𝑝 𝜌 𝜌𝑝𝐶𝐷 (𝑢𝑝𝑖- 𝑢𝑖) 2 - (𝜌−𝜌𝜌 𝑝)
where mp is particle mass; ap is particle acceleration
rate; u is known liquid velocity; ρ is inclusion and liquid densities, kg·m−3; g is gravity acceleration, 9.8 m/s2 along the vertical directions and zero at other directions; CD is drag coefficient as a function
of inclusion Reynolds number [11], given by 𝐶𝐷 = 𝑅𝑒24
𝑝 (1+ 0.186 Rep 0.653
) (4.18)
The effect of the turbulent fluctuation on the motion of inclusions can be modeled crudely from a κ-ε flow field by adding a random velocity fluctuation at each step, whose magnitude varies with the local turbulent kinetic energy level. Stochastic model [11]: The instantaneous fluid velocity can be represented by
U = 𝑢 + uꞌ (4.19)
uꞌ = ξ uꞌ 2 = ξ 2𝑘 3(4.20)
Where u is instantaneous fluid velocity, m/s; u is average fluid phase velocity, m/s; u is random velocity fluctuation, m/s; ξ – random number.
The separation rate of the particles from the tundish due to flotation is calculated with the formula: β = 𝑁𝑖𝑛− 𝑁𝑜𝑢𝑡
𝑁𝑖𝑛 x 100% (4.21)
Where: Nin is the number of particles at the inlet of
the tundish and Nout is the number of particles at
the outlet of the tundish.
D.Assumptions and boundary conditions
A symmetry boundary condition is given at a symmetry plane, which implies a zero gradient condition for all variables normal to the plane. Steel-slag interface is modeled as a frictionless wall. The Tundishwallswere considered stationary (the so called “standard wall function”) for the velocity components and the turbulence quantities.Figure 3 illustrate different boundary conditions employed for the computations of the liquid steel flow through the tundish. The inlet velocity of liquid steel is equal to 0.9 m/s, which is equivalent to mass flow rate of 22.2 kg/s. The value of the turbulence intensity of entered flow was I =5 %. The hydraulic diameter 0.04 m corresponds to the internal diameter of the shroud.For the heat transfer calculation, the boundary conditions include the incoming liquid steel temperature as 1850 K. The heat losses were supposed to be taking place through the walls, bottom and free surface of fluid in the tundish. The top surface heat loss was taken as 15,000 W/m2 and from the tundish bottom
and walls the heat loss was taken as 2600 W/m2 [1].
For the inclusion separation four different inclusion sizes (20 μm, 40 μm, 60 μm, 100 μm) and density 5000 kg/m3 were considered in the present study. The inclusions were insertedhomogenously throughthe inlet gate (520 inclusions per injection) and each inclusion‟s trajectory was tracked untilexited from the tundish outlets or it got trapped at the top wall[2] [12].
Fig.3Geometry of the multi strand tundish showing different boundary conditions
Computer characteristics
The computer used of this work has the following characteristics:
Table 1: Computer characteristics
CPU Intel ® Core ™ i3 CPU
M330 @ 2.13 GHz
Memory 4 GB of RAM
Mass storage service 500 GB
Operating System Microsoft Windows 7 64 bits
V. Solution Procedure
Equations (4.1) to (4.11) (see section IV-A ) represent the whole description of the problem. Because of the nonlinearity of the turbulent Navier-Stokes equations, numerical methods have to be used in order to obtain a solution. This model is simulated by the programs:ANSYSGAMBIT 2.4 and the commercial CFD software ANSYS-FLUENT 6.3.26.
ANSYS-FLUENT 6.3.26 as stated above. The partial differential equations are solved with the help of the explainedboundary conditions in IV (D) for all control volumes. To provide solution accuracy a QUICK scheme was implemented, to discretize the momentum, energy, turbulent kinetic energy and turbulent dissipation rate equations. SIMPLE algorithm was used to resolve the pressure-velocity coupling in the momentum equation. During iteration, the convergence was assumed to reach a point where the residualsare smaller than 10-3 for continuity, momentum, kinetic energy and kinetic energy dissipation rate, only for the energy is 10-6.
VI. Results and Discussions
A. Mixing time characteristics
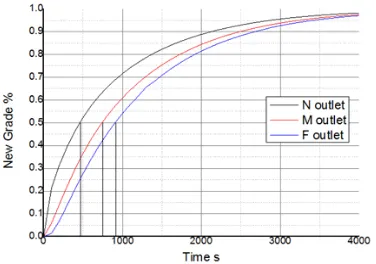
For assessing the present model, a validation study was carried out against the computational results reported by Merder et al. [1] and Dewan [2].They generated mixing time characteristics curves of a bare six-strand trough-type tundish by casting two different grades of steel in a single sequence, for the evaluation of the transition zone during casting. in the present work the same procedure is followed, firstly a steel grade is casted by using unsteady casting process for some time (till steady flow), and then replaced by new grade (having the same physical properties) with mass fraction unity through the inlet, followed by generation of a characteristics plot for the new grade steel until its mass fraction became unity at the outlets and the average mass fraction of the new grade steel against the flow time for each outlet strand is studied. Figures(4a, b, c, d) compares the mixing time characteristics for three outlet strands from the present computationscase 1 & Case 2 (In the present work a change of the position of the inlet of the tundish is considered, in case1 , the position of the inlet gate is, in the middle of the transverse plane of symmetry and in case2, which is similar to the configuration of [1] [2], at 0.35W1 from left. Fig. 1) and those reported by Merder et al. and Dewan[1] [2]. A good agreement is observed between the three (Figure 4b, c, d).It can read out from the curves in which period of the process (for each of the outlets) the steel grade being currently cast, as defined in terms of chemical composition is predominant [1].
Fig. 4a (Case 1) mixing time characteristics of the present work {N (near).M (Middle), F (far) with respect to the inlet gate of the tundish}
Fig. 4b(case2)Mixing time characteristics of the present work {N (near) M (Middle), F (far) with respect to the inlet gate of the tundish.
Fig. 4c Mixing time characteristics determined for three nozzles of the tundish [1]
Fig. 4d A comparison of the mixing time characteristics reported by Merder et al and Dewan for the Far outlet (a), middle outlet (b) and near outlet (c) with those reported [2].
B. Velocity field.
Calculations were carried out for both steady and unsteady (transient) conditions. Unsteady calculations are only performed to determine the curves of steel mixing time characteristics. The solution of the model (steady state) with satisfactory convergence was obtained after performing many hundreds iteration by using pressure based solver- gradient option (Green Gauss node based) which is give a quick solution in comparison to Green Gauss cell based, when the grid type used is tetrahedralaccording to (FLUENT 6.3.26 user's manual) [16]. In the present work a change of the position of the inlet of the tundish is considered, in case1 (fig 5a, b, c), the position of the inlet gate is, in the middle of the transverse plane of symmetry and case2, which is the similar to the configuration of [1] [2], at 0.35W1 from left, (fig. 6a,b,c). Every case is represented in three control planes, for case1, indicated in (fig 5a,b,c). Fig.5a represent a plane crosses the tundish lengthwise passing through the inlet, while the plane in fig. 5b passes through the outlets and the plane in fig. 5c is the tundish symmetrical transverse plane. Fig. 6a, b, c are illustrated also in same sequence. The distribution of the velocity vectors in fig. 5c (through the inlet) indicate two distinct vortices of oppositely oriented rotation are observed. Such their arrangement should have a favorable effect on nonmetallic inclusions removal to the surface plane ie. the slag. The flow pattern in case2 is similar to case one, the difference is in the inclusions removal, case 2 gave quite similar removal efficiency as [2] [12]. It's clear, the diagrams of this work show identical flow pattern as from [1]. The facet average velocity of the outlets is about
3.95m/s for the two cases.
Fig.5a(Case 1) velocity vectors(colored by velocity magnitude) through a plane crosses the tundish lengthwise passing through the inlet
Fig.5b(Case 1) velocity field vectors through a plane crosses the tundish lengthwise passing through the outlets
Fig.6a(Case 2) velocity field vectors through a plane crosses the tundish lengthwise passing through the inlet
Fig.6b (CASE2) velocity field vectors through a plane crosses the tundish lengthwise passing through the outlets.
B. Temperature distribution
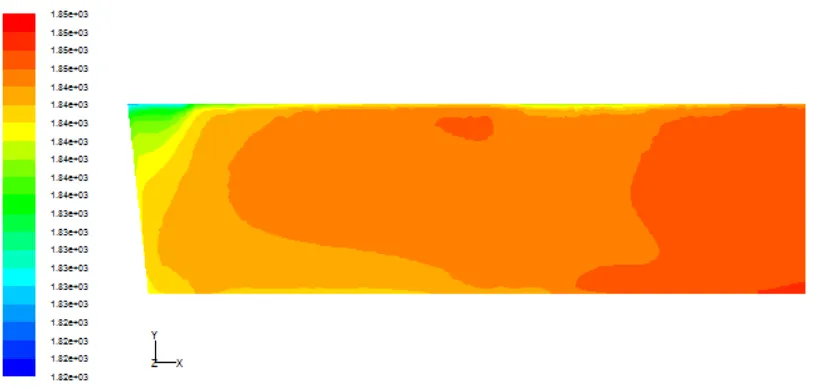
The computed fields of steel temperatures prevailing in the tundish interior have equalized distributions, which is illustrated in fig. 7a, b, c, d and the temperature differences at the outlets do not more than 10 K. the average temperature in the tundish interior is about 1844 K. that means it could be considered as isotherm. Also from fig. 7c, it can be seen, the far- and middle outlets have the same temperature which was agreedwell with the results from [1].Also a green region (region of lower temperature), can be seen at the top of the left portion of the surfaces of fig.7.a and 7.b, which is indicator of dead volume region. For decreasing the temperature difference between the strands, [19] reported that, in the case of multi-strand
casting situations, the heat loss may be different from strand to strand ( this is approved in the present work as stated above), which may lead to some operational difficulties. Due to [19], it may be possible to even out the heat loss by appropriate baffling arrangements; for this reason, a precise knowledge of the flow field is quite desirable.
Fig. 7a Temperature distribution in the vertical plane through the inlet center
Fig. 7c Illustration of temperature distribution grid distribution in the vertical plane through the outletscenters.
Fig. 7d Temperature distribution in the transverse symmetry plane through the inlet
A. Inclusion separation
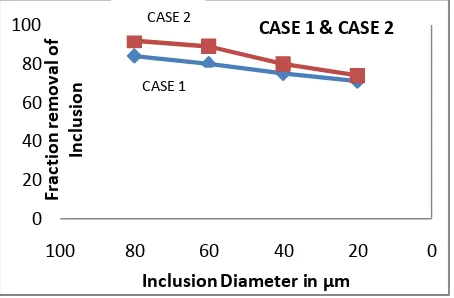
A validation of the inclusion separation was performed by comparing the results of the present work with those reported by [1] [2] figure (8a) and(8b) respectively. [12] Has performed numerical simulations on inclusion separation in a single-strand tundish using the standard k-ε model and the trajectories of the inclusions inside the tundish were tracked by Langrangian particle tracking method, which is the same method used in this work. A good agreement between the present inclusion separation fractions predicted and those reported by (Mikki and Thomas) and (Gupta and Dewan) [2] [12] can be observed in Figure 8a(CASE2) and 8b respectively.
As seen in fig 8a (CASE 1) the near inlet is unfavorable for inclusion removal in tundish.
Fig.8a. Inclusion removal fraction of the present work
0 20 40 60 80 100
0 20
40 60
80 100
Fra
ct
io
n
rem
o
va
l o
f
In
cl
u
si
o
n
Inclusion Diameter in µm CASE 1 & CASE 2
Fig. 8b. Inclusion fraction removal results reported by [2] [12]
It's clear from the diagrams above; an increase in particle removal rate into the top surface is occurred, as particle size increases, that is due to the effect of buoyancy force,
VII. Conclusion & Future work
In the presented work CFD numerical calculations, supported by experimental and modeled results from the open literature were performed, to simulate the flow of steel melt through the continuous casting tundish,non-metallic inclusions separationand temperature distribution. The base of the performed study was to model an industrial six-strand tundish configuration. The aim of the present study was to make a first step in the project mentioned in the abstract by comparing the model results from the present work with the experimental, plant measurement and models from [1] [2] [12] [13].
The numerical simulations of liquid steel flow in the tundish were performed using the commercial Computational Fluid Dynamics software ANSYS-FLUENT.
For assessing the present model, a validation study was performed against the computational results reported by Merder et al. [1] and Dewan[2] [13]. The comparison of the mixing time curves for the three outlet strands from the present computations (CASE 2)showed similar resultsas those reported by Merder et al. and Dewan[1] [2]. On pre-calculated flow field, the non-metallic inclusion removal in the investigated tundish of the present work was compared, validated and well agreed with the results from[1] [2] [12] [13]. Also a change of the inlet position was compared, for inclusion removal and mixing time. The inclusion separation fraction increases with an increase in the distance between the inlet gate and the outlet gates. The mixing time spent was longer by the far inlet gate, which explained the better inclusion removal efficiency. The temperature distribution indicated
approximately equalized temperature distribution, which agreed well with the results from [1].
Future work
The first recommendation would be to investigate possible use of flow regulators (weir, dams, flow inhibitors etc.) for every individual practice tundish investigated in steel factories in Sudan.
The second recommendation based on this research would be carried out to improve boundary condition describing inclusion separation at the steel-slag interface and to compute and evaluate the inclusion distribution at the tundish outlets.
References:
[1] T. Merder, J. Jowsa and A. Boguslawski, "The Analysis of the Conditions of Steel Flow in the Tundish Performed by a Numerical Methods," Archives of Metallurgy and Materials,pp. 933-953, Vol. 50, No. 4, 2005.
[2] S. Gupta and A. Dewan, "Performance Optimization of a Six-Strand Tundish," World Journal ofMechanics,doi:10.4236/wjm.2013.33018 Published Online June 2013 (http://www.scirp.org/journal/wjm, pp. 184- 193, 3, 2013.
[3] M. W. Czestochowa, " Numerical Modelling of Non-metallic Inclusion Separation in a Continuous Casting Tundish," Computational Fluid Dynamics Technologies and Applications. InTech, 2011.
[4] M. Warzecha , T. Merder and B. P. Warzecha, "CFD modelling of non-metallic inclusions removal process in the T-type tundis," Journal of Achievements in Materials and Manufacturing Engineering, Vol. 55, ISSUE 2, December 2012.
[5] Q. Hou and Y. You, "Comparison between standard and renormalization group k- Ɛ models in numerical simulation of swirling flow tundish," ISIJ international, p. PP. 325 – 330, Vol. 45 (2005), No. 3.
[6] . A. Kumar, D. Mazumdar and S. C. Koria, "Modeling of Fluid Flow and Residence Time Distribution in a Four-strand Tundish for Enhancing Inclusion Removal," ISIJ International, p. pp. 38–47, Vol. 48 (2008), No.1.
[7] S. K. Mishra et al, "Numerical investigation of fluid flow and heat transfer in a multi-strand steelmaking tundish with closed strands," International Journal of Engineering Science and Technology (IJEST)3.2 (2011).
[8] . Chattopadhyay, Kinnor, Mihaiela Isac, and Roderick IL Guthrie "Physical and Mathematical Modelling of Steelmaking Tundish Operations: A Review of the Last Decade (1999–2009)," ISIJ International, p. pp. 331–348, Vol. 50 (2010), No. 3.
[9] H. Baiand and B. G. Thomas, "Two Phase Flow in Tundish Nozzles During Continuous Casting of Steel," in Materials Processing in the Computer Age III, V. Voller and H. Henein, eds., TMS Annual Meeting, Nashville, TN, Nashville, March 12-16, 2000.
[10] M. Warzecha, T. Merder, P. Warzecha and G. Stradomski, "Experimental and Numerical Investigations on Non-metallic Inclusions Distribution in Billets Casted at a Multi-strand Continuous Casting Tundish,"ISIJ international 53.11 (2013): 1983-1992.
[11] L. Zhang, "Fluid flow and heat transfer and inclusion motion in molten steel continuous casting tundishes," in
Fifth International Conference on CFD in the Process Industries CSIRO, Melbourne, Australia, 13-15 December 2006.
[12] Y. Miki and B. G. Thomas, "Modeling of Inclusion Removal in a Tundish," Metallurgical and Materials
Transactions B, pp. 639-654, Vol. 30, No. 4, 1999.
[13] A. Dewan and S. Gupta, "Comparison of Different Multi-Strand Tundishes,"" RESEARCH 2013 (ICMER 2013) (2014): 135.
[14] A. Braun, M. Warzecha and H. Pfeifer, "Numerical and Physical Modeling of Steel Flow in a Two-Strand Tundish for Different Casting Conditions," Metallurgical and Materials Transactions B, pp 549–559, June 2010, Volume 41, Issue 3.
[15] H. K. Versteeg and W. Malalasekera,, An Introduction to Computational Fluid Dynamics (The Finite Volume Method), Harlow: Pearson Education Limited, 2007.
[16] "Fluent, A. N. S. Y. S. "Fluent 6.3 Documentation."Fluent Inc., Lebanon, NH, 2006.
[17] B. E. Launder and D. B. Spalding, "Computer Methods App.," Mech. Eng., 3(2), 269-289, 1974.
[18] H. Turkoglu and B. Farouk, "Numerical computations of fluid flow and heat transfer in gas injected iron baths," ISIJ International, Vols. vol. 30, (11), pp.961-970, 1990.
[19] Ilegbusi, O., and J. Szekely. "The Physical and
Mathematical Modeling of Tundish Operations."1989
[20] R. Codina, Comparison of some finite element methods for solving the diffusion-convection-reaction equation, Computer Methods in Applied Mechanics and Engineering, Volume 156, Issues 1–4, 14 April 1998, Pages 185-210
[21]Turbulence_Notes_Fluent-v6.3.06.pdf
www.southampton.ac.uk/~nwb/lectures/GoodPractice
CFD/Articles/Turbulence_Notes_Fluent-v6.3.06.pdf
[22] S. K. Ray, "On the Application of Physical and Mathematical Modeling to Predict Tundish
Performance,"PhD Thesis, Montreal, Canada, August, 2009
![Fig. 4c Mixing time characteristics determined for three nozzles of the tundish [1]](https://thumb-us.123doks.com/thumbv2/123dok_us/8585720.1719854/7.595.63.282.299.503/fig-c-mixing-time-characteristics-determined-nozzles-tundish.webp)
![Fig. 8b. Inclusion fraction removal results reported by [2] [12]](https://thumb-us.123doks.com/thumbv2/123dok_us/8585720.1719854/12.595.80.279.74.216/fig-b-inclusion-fraction-removal-results-reported.webp)
