Application Of Remote Sensing Techniques To
Assess Temporal And Spatial Availability Of
Forage In Relation To Grazing Conflicts In
Northern Kenya.
Dominic Maringa, Mworia Mugambi, Gichuki Nathan
PhD Candidate, Department of Agriculture and Natural Resources, Kenya Methodist University
Department of Agriculture and Natural Resources, Kenya Methodist University
School of Biological Sciences, University of Nairobi
ABSTRACT: Grazing conflicts in Northern Kenya is invoking heightened concern which is drawing the attention of many stakeholders, communities and Governments alike. These conflicts are as a result of many conspiring factors in the North of Kenya. However, most of the grazing conflicts occur on the already established community conservancies, before they filter out to the private ranches and conservancies. The objective of this study was to use Geographical Information Systems to evaluate the available forage on 4 conservancies in Laikipia and Isiolo counties, as part of a larger study undertaken to predict grazing conflicts in Northern Kenya. We used Normalised Difference Vegetation Index (NDVI) to classify the vegetation into 11 classes using MODIS 1km spatial resolution. A 27-year rainfall data of the area was obtained from the Meteorological department for correlation with the satellite images on land use changes in the study area from 1990-2017. NDVI maps were developed to depict spatial and temporal vegetation trends to draw conclusions on the availability of forage in the study area. The results were presented in NDVI maps, tables and graphs for easy interpretation. The results showed that large areas have transited from one land use type to another in the study period, encompassing both reduction and increase in size of various vegetation classes. It also shows that in most areas, green vegetation classes have changed to the negative as depicted in reduction in the spatial resolution. The low greenness indicated lesser availability of browsable biomass mostly in the months of January to April, and June to September, while the browner colours indicated mostly bare grounds around the same seasons. The results further showed that there is a positive correlation between the low precipitation and increase in grazing conflicts, with the months of January-April being the most affected. The results will be useful to grazing planners, drought managers and regional and national governments in mitigation of grazing conflicts.
Key words: Wet Season, Dry season, Drought, Participatory GIS (PGIS), MODIS
INTRODUCTION
Instability of forage availability is the major factor constraining the Kenyan pastoralists, especially from the more arid rangelands of the north (Jatzold, 1995). Highly variable rainfall pattern causes wide fluctuations of range productivity. These are short-lived seasonal high that cannot be optimally utilized by the livestock, to seasonal lows that are insufficient to support resident livestock during the frequent droughts. It is during those seasonal lows and droughts when it is almost impossible for the residents to sell livestock, large numbers of animals may die, destroying the pastoralists’ economic base leading to poverty (Jatzold, 1995). The main aim of using the Geographical Information Systems (GIS) and satellite information was to produce Normalised Difference Vegetation Indices in order to compare and contrast the temporal and spatial trends of the land use changes and vegetation characteristics taking place in the study area. As historical records for rainfall in ASALs are sparse and where available not very good, we use NDVI data for which there is 30 year availability to evaluate the inter-annual variation on forage availability. NDVI is a remotely sensed index that can be used to evaluate the availability of green vegetation (Ericksen, 2011). It is a numerical indicator that uses the visible and near-infrared bands of the electromagnetic spectrum, and is adopted to analyze remote sensing measurements and assess whether the target being observed contains live green vegetation or not. NDVI has found a wide application in vegetation
STATEMENT OF THE PROBLEM
In pastoral communities, availability of pasture and water for livestock has been critical as their main livelihood. Various traditional methods, among them formation of Community Conservancies. In a number of conservancies, communities have reaped benefits of peaceful coexistence, resilient pasture resources, and stable environmental externalities. However, intercommunity conflicts and invasion of private ranches and conservancies in search of pasture has persisted, leading to losses of human lives and livestock in the region. The real or perceived drivers of the grazing conflicts have not been researched or their likely occurrences predicted using resources-based scientific or theoretical models. There is no documented research on the relationships between the grazing conflicts and seasonality of resource availability per conservancy, nor contribution of its temporal and spatial characteristics grazing conflicts. This study will establish the relationship between the available grazing resources It will bridge the gaps existing between the dynamics of resource availability and the current community grazing systems, and ultimately produce adoptable knowledge for sustainable mitigation of grazing conflicts in parts of northern Kenya.
METHODOLOGY
Vegetation maps of the study area, showing the vegetation trends for the last 30 years, were obtained from the RCRMD. The colour trends produced by Moderate Resolution Spectroradiometer (MODIS) on 1km resolution were visually compared and vegetation classes were done based on the colour ranges to produce vegetation changes in hectares per class. The rainfall data was obtained from the National meteorological data centre, and this was correlated with the NDVI maps, the PGIS, the results from the experiments on available forge, and the responses from the focused group discussions to
enable synthesis of results and make generalised conclusions.
The Study Area
The Laikipia-Isiolo is a unique landscape in Kenya, composed of habitats and land use types and political boundaries which are managed by variety of stakeholders and law enforcement authorities. These include: national reserves, community wildlife conservancies, pastoral group ranches and undeveloped government owned trust land, forest reserves, private ranches and sanctuaries and agricultural settlements (Wittemyer et al., 2010). Majorly a semi-arid savannah grasslands, most tree species include Acacia seyal and A. drepanolobium as the abundant plant species at higher altitudes while A. mellifera, A. tortilis, A. nilotica and Commiphora spp are abundant in lower altitudes. The study area comprised of the community conservancies in both Laikipia and Isiolo conservancies, which were Nasuulu (Isiolo), Ilngwesi (Laikipia), Ngarendare (Laikipia/Meru) and Lewa (Lewa WC) See figure 3. Consequently, the landscape has a diversity of habitat types including expansive grassland plains, steep hill slopes and riverine valleys with high altitude forest, acacia woodlands and arid and semi arid savannah habitat. The area is majorly a dry savanna that is characteristically hot and dry for most of the year with highly variable bimodal rainfall of less than 400 mm per annum.
RESULTS AND DISCUSIONS
Rainfall and forage seasonality
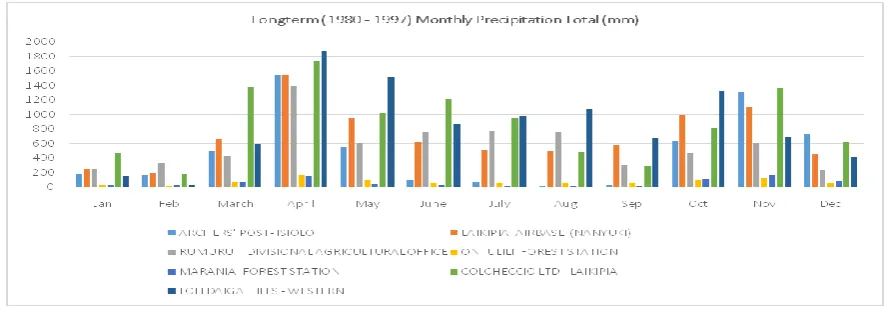
It reported that about 90% of the mean annual rainfall occurs in the peak months of April-May and November-December (Figure 1&2). The figure below shows the total station-based long term precipitation obtained meteorological department for the area under the study:
Fig 1: Long term Monthly Precipitation of the study area
From the figure of long term monthly rainfall data above we came up with the seasonal variation of rainfall across the study area. We can deduce that the study area has primarily two wet seasons, which is April to May, and October to November. There are also two dry seasons from January to March and June to September. Rainfall supports primary production of natural vegetation and croplands (Ericksen, 2011); therefore the temporal and
resource in the study area, since these determine the seasonality of the grazing forage and water resources across the study area.
Rainfall and grazing conflicts
Kenya. The Table below shows the reported number of grazing conflicts versus the average monthly rainfall data:
Table 1: The distribution of rainfall and the grazing conflicts in the study area
From the table 1 above, it can be seen that most of the grazing conflicts occur between January and April, while these are the months with the lowest precipitation in the study area. This supports literature that these are the
months with the most depressed vegetation indices. Below is a correlation between the rainfall availability and grazing conflicts in the study area:
Fig 2: The correlation between precipitation and grazing conflicts
R2 is a statistical measure of how close the data is to the fitted regression line. When R2 is 0.969 (90.6%) % it indicates that the precipitation explains 90.6 % of the occurrences of the grazing conflicts in the 4 conservancies.
Forage biomass availability using spatial and temporal vegetation distribution
NDVI was used to monitor and track the trends in the changes of vegetation indices in the study area. The figure below shows the NDVI trends since 1990:
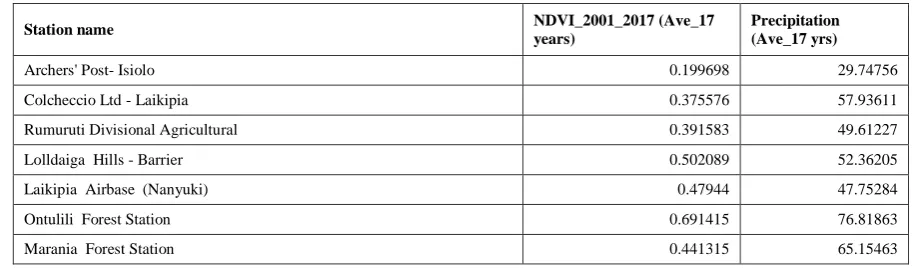
Table 2: The trends of the longterm precipittion vesus the NDVI (2001-2017):
Station name NDVI_2001_2017 (Ave_17
years)
Precipitation (Ave_17 yrs)
Archers' Post- Isiolo 0.199698 29.74756
Colcheccio Ltd - Laikipia 0.375576 57.93611
Rumuruti Divisional Agricultural 0.391583 49.61227
Lolldaiga Hills - Barrier 0.502089 52.36205
Laikipia Airbase (Nanyuki) 0.47944 47.75284
Ontulili Forest Station 0.691415 76.81863
Marania Forest Station 0.441315 65.15463
The figures show that most of the areas under the study maintained a 17-year NDVI range of between 0.1 to 0.4 avareaging 0.32 on the more drier area and 0.5 on the higher regions. The trends can be further summarised in the graph of longterm precipition versus NDVI as shown in the figure below:
COUNTIES JAN FEB MAR APR MAY JUNE JULY AUG SEP OCT NOV DEC
Isiolo 16.4 11 28 80.7 27.7 5 3.7 1.8 1.7 28.4 73.1 36.2
Laikipia 21 12 42.1 92.8 60.4 34.8 41.3 42.4 39.9 58.6 63.1 28.3
Lewa 35.9 37.8 112 314.5 189.2 30.4 44.2 39 401 197 274 72.8
Conflicts 20 18 10 2 12 20 23 22 3 8 4 16
Average LT precip 73.3 61 182.1 487.9 277.3 70.2 89.3 83.2 443 284 410 137
Average Montly
Fig. 3 The Longterm precipitation versus NDVI
In the figure above, R2 is 0.719, indicating that availbility of precipitation determines 71.9% of Vegetation indices in the study area. This means that the lower the precipitation the lower the vegetation index and vise versa. The vegetation indices derived from the MODIS earth reflectance for 1990 and 2014 are therefore spread on a wider satelite image for the study area in the figure below:
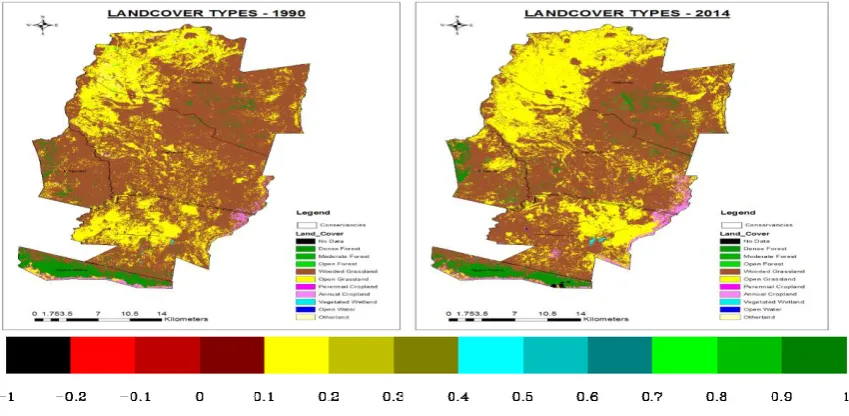
Fig 3: 1990 Average spatial NDVI for the study area in 1990 -2014
The satelite imagery above shows a comparison of the vegetation index and landuse changes on the study area between 1990 and 2014. In 1990, it shows that Nasuulu, ( far north), was mostly composed of wooded grasslands (central to northeast of conservancy), which was rapidly transisting to open grassslands (northwest). There were few patches of open forests (central), which is today seen as depleted evidence of dry acacia rangeland. In 2014, it shows more than 50% of the land use has transited from wooded grasslands to open grasslands as seen on the north and northwest (boundary with Samburu). On its central region, a more hilly area, evidence of open forest exists compared to 1990s. This could be attributed to gains through creation of community conservancy which implements more controlled grazing plans. Ilngwesi in 1990 portrayed NDVI of more wooded grasslands and almost balanced amounts of open forests and open grasslands. A closer look shows a tendency of transition fom wooded grasslands to open grasslands from southwest towards northwest. However, in 2014 more open
1990s, there were fewer settlements along the Lewa eastern boundary, whereas farming population increased towards the turn of the millennium, more water sources were accessible through drilling boreholes and pipelines leading to more settlements and farming activities. The patches of vegetated wetlands to the south have disappeared, with two key wetlands developing on its central area. These are most likely the manmade dams. At the same time, Ngarendare forest portrayed an NDVI of moderate to dense forest, with its northern boudery showing transition from moderate forest to open grasslands along its boundary with Lewa. Its southern boundery portraid evidence of transition from moderate
forest to a mixture of annaual/perenial croplands mainly due to farming encroachment on opengrassland. In 2014, more conversion of dense forests to open forest and wooded forest is taking place on its northern boundary tending to the south, while the perennial/annual croplands have not changed significantly. The spread of open grasslands/woodlands could be partly attributed to increasing livestock populations especially during drought times, coupled by doubling populations of wildlife (elephants etc) in the forest since 1990s. The table below shows the land cover class statistics between 1990-2016 as derived from the GIS
Table 4: A summary of land use changes: 1990 – 2016
From the Table 4 above it can be seen that dense forest have decreased by 382 ha, while the wooded grasslands have also reduced by 7280.6 ha and is rapidly being converted to open grasslands. This phenomenon can be partly attributed to increasing livestock numbers, as well as increasing population of elephants and the ungulates. We postulate that due to previous incidences of poaching in the 1990s, and increased better security in the recent past, some parts of Laikipia and Isiolo have become the refuge for elephants and other larger mammals. There has also been establishment of private wildlife conservancies, further assuring the elephants and browsers of better security. This has on the other hand pressurised the
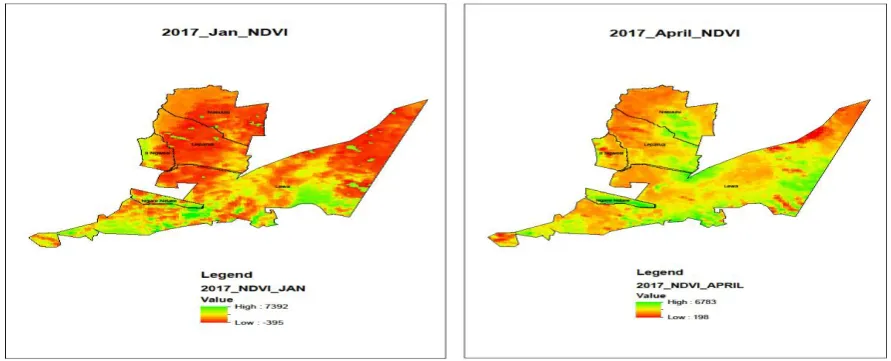
woodlands and forests to transits to open grass lands. The annual cropping system has increased by 858 ha reducing land for livestock keeping and wildlife conservation. This would explain the emergence of human wildlife conflicts within the larger Laikipia-Samburu regions. Besides, perennial cropping has increased slightly by 17 ha. This could be attributed to adoption/change of livelihood from pastoralism to small-scale agriculture as seen taking place at Leparua on the northern border with Lewa, or due to settlement of farming communities in previously pastoral areas. The figure below shows the most recent (2017) appearance of the vegetation indices on the study area.
Fig 4. NDVI figures January-April, 2017
Value Landcover Area – 1990 (ha) Area – 2014 (ha) Change (ha) (+/-)
1 No Data 0.99 81.54 80.55 +
2 Dense Forest 4174.29 4174.29 -382.14 -
3 Moderate Forest 40.32 165.06 124.14 +
4 Open Forest 160.38 687.06 526.68 +
5 Wooded Grassland 69937.65 62657.01 -7280.64 -
6 Open Grassland 25699.68 32199.66 6499.98 +
7 Perennial Cropland 3.24 20.52 17.28 +
8 Annual Cropland 895.05 1753.11 858.06 +
9 Vegetated Wetland 32.67 98.91 66.24 +
10 Open Water 10.35 13.86 3.51 +
In January 2017, Nasuulu, Ilngwesi, Leparua displays large portions of bare lands, with Lewa displaying its north-western tip towards Isiolo. In April, more vegetation greenness is depicted, with Ngarendare showing a bigger NDVI than other conservancies. This is supported by the rainfall seasonality (see fig 1.)
Conclusions
There are tremendous changes in land use and vegetation characteristics taking place across Laikipia and Isiolo landscapes. From the analysis of satellite images above, it is clear that large areas have transited from one landuse type to another, encompassing both reduction and increase in size of different classes (see table 4). Of importance is to note that in most areas, life vegetation classes have reduced in sizes as depicted in reduction of the green colour resolution. This could be as a result of different pressure sources like farming and human settlements, increase in wildlife and livestock numbers leading to over grazing and degradation. As noted by Edwin Kisio, a research officer at Lewa Research and Monitoring Department, elephants’ numbers have more than quadrupled since 1990s. This has brought immense pressure on Lewa and Ngarendare forest due to their destructive behaviour on vegetation and their mode of feeding. This has contributed to widespread negative change of vegetation resolutions on the Lewa-Ngarendare landscape, as seen in figure 3&4 above.
Recommendations
We recommend further studies to ascertain the role of elephants and larger ungulates in the changing landuse
classes of Laikipia-Isiolo-Samburu landscape. This will help the future grazing planners and wildlife managers to recommend setting up of wildlife sanctuaries within the landscape, or establish well managed migratory corridors to mitigate vegetation loss. A study is also recommended to find out the changes in community livelihoods as a result of adoption of different economic activities by indigenous communities as a result of diminishing grazing resources in northern Kenya.
Acknowledgements
This study would not have been successful without the support of Ilngwesi, Ngarendare and Lewa WC staff for allowing me to access, conduct and search information in their areas. I also appreciate the staff of Kenya Meteorological Department and the Regional Centre for Resource Surveying and Mapping for their assistance.
References:
[1]. Ericksen P, et al. (2011). Mapping and valuing ecosystem services in the Ewaso Ng’iro Watershed. ILRI
[2]. Jatzold.R. (1995). Climatology of Northern and North East Kenya. In Range Management Handbook of Kenya Vol.11. Ministry of Livestock and Marketing.
[3]. Holme, A.McR., Burnside, D.G. and Mitchell, A.A. (1987). The development of a system for monitoring trend in range condition in the arid shrublands of Western Australia. Australian Rangeland Journal 9:14-20.
Appendices:
Longterm NVDI versus Rainfall
Station_name
NDVI_2001_2017 (Ave_17
years) Precipitation (Ave_17 years)
ACH.PST- ISIOLO 0.199698 29.74756
COLCHECCIO 0.375576 57.93611
RUMURUTI AG 0.391583 49.61227
LOLLDAIGA 0.502089 52.36205
LAIKIPIA AIRBASE
(NANYUKI) 0.47944 47.75284
Table of monthly NDVI Laikipia and Isiolo
Fig: Average NDVI per month Laikipia and Isiolo stations Monthly NDVI
Month Archers Laikipia Rumuruti COLCHECCIO Loldaiga Ontulili Marania
Jan 0.178715 0.454269 0.268446 0.295014 0.358953 0.651176 0.439665
Feb 0.150655 0.304798 0.240494 0.230631 0.333487 0.624436 0.406564
Mar 0.143298 0.266273 0.216285 0.212654 0.308239 0.540533 0.361932
Apr 0.140431 0.273091 0.226389 0.254669 0.303008 0.410561 0.371861
May 0.214664 0.433703 0.284163 0.440872 0.447676 0.461605 0.392035
Jun 0.212867 0.534391 0.285053 0.393404 0.531931 0.64794 0.446704