International Journal of Energy and Power Engineering
2013; 2(3): 121-127Published online July 20, 2013 (http://www.sciencepublishinggroup.com/j/ijepe) doi: 10.11648/j.ijepe.20130203.16
Protective relaying scheme of distributed generation
connected radial distribution system
Murali Matcha, Sharath Kumar Papani, Vijetha Killamsetti
Department of Electrical Engineering, National Institute of Technology Warangal, Andhra Pradesh, INDIA - 506004
Email address:
[email protected](M. Murali)
To cite this article:
Murali Matcha, Sharath Kumar Papani, Vijetha Killamsetti. Protective Relaying Scheme of Distributed Generation Connected Radial Distribution System. International Journal of Energy and Power Engineering. Vol. 2, No. 3, 2013, pp. 121-127.
doi: 10.11648/j.ijepe.20130203.16
Abstract:
This paper discusses some aspects related to the connection of distributed generators to radial distribution systems, especially their impact on the protection coordination. Penetration of a DG into an existing distribution system has many impacts on the system, with the power system protection being one of the major issues. The relays in the power system have to be coordinated so as to avoid mal-operation and unnecessary outage of healthy part of the system. In this paper, Overcurrent relay coordination of simple radial industrial power plant is presented using NEPLAN Software. It presents the short circuit analysis of radial industrial power plant. This paper shows the star view of relays which is unique feature of NEPLAN for coordinating them correctly based upon recorded data of industrial distribution plant for calculating short circuit currents in industrial power system. Results obtained are verified by manual calculation.Keywords:
Distributed Generator, Protection Coordination, Distribution System, Overcurrent Relay1. Introduction
As the yearly electric energy demand grows, there is a significant increase in the penetration of distributed generation (DG) to fulfil this increase in demand. Interconnecting DG to an existing distribution system provides various benefits to several entities such as the owner, utility and the final user. Hence some of the energy demand is supplied by the centralized generation and another part is produced by distributed generation. The electricity is going to be produced closer to the customers.
Large scale integration of distributed generators at either LV or MV is at the present the trend followed in power systems to cover the supply of some loads. These generators are of considerable smaller size than the traditional generators (thermal, nuclear, etc…). An overview of some common benefits and drawbacks [1] of the DG are presented below.
1.1. Benefits
• Connection of DG is intended to increase the reliability of power supply provided to the customers, using local sources, and if possible, reduce the losses of the transmission and
distribution systems.
• The connection of DG to the power system could improve the voltage profile, power quality and support voltage stability. Therefore, the system can withstand higher loading situations.
• The installation of DG takes less time and payback period. Many countries are subsidizing the development of renewable energy projects through a portfolio obligation and green power certificates. This incentives investment in small generation plants.
• Some DG technologies have low pollution and good overall efficiencies like combined heat and power (CHP) and micro-turbines. Besides, renewable energy based DG like photovoltaic and wind turbines contribute to the reduction of greenhouse gases.
1.2. Drawbacks
• Many DG are connected to the grid via power converters, which injects harmonics into the system. • The connection of DG might cause over voltage,
• Depending on the network configuration, the penetration level and the nature of the DG technology, the power injection of DG may increase the power losses in the distribution system.
• Short circuit levels are changed when a DG is connected to the network. Therefore, relay settings should be changed and if there is a disconnection of DG, relay should be changed back to its previous state.
2. Problem Statement
Nowadays, the power electricity demand is growing fast and one of the main tasks for power engineers is to generate electricity from renewable energy sources to overcome this increase in the energy consumption and at the same time reduce environmental impact of power generation. The use of renewable sources of energy has reached greater importance as it promotes sustainable living and with some exceptions (biomass combustion) does not contaminant. Renewable sources can be used in either small-scale applications away from the large sized generation plants or in large-scale applications in locations where the resource is abundant and large conversion systems are used [2].
Nevertheless, problems arise when the new generation is integrated with the power distribution network, as the traditional distribution systems have been designed to operate radially, without considering the integration of this new generation in the future. In radial systems, the power flows from upper terminal voltage levels down to customers situated along the radial feeders [1]. Therefore, over-current protection in radial systems is quite straightforward as the fault current can only flow in one direction. With the increase of penetration of DG, distribution networks are becoming similar to transmission networks where generation and load nodes are mixed (“mesh” system) and more complex protection design is needed. In this new configuration, design considerations regarding the number, size location and technology of the DG connected must be taken into account as the short circuit levels are affected and miss coordination problems with protection devices may arise [3],[4].
This research addresses some of the issues encountered when designing the over-current protection coordination between protection devices, in case that a number of DG sources are connected to a radial system.
2.1. Fault Analysis
The fault contribution from a single small DG unit is not large, however, the aggregated contributions from many small units, or a few large units, can significantly alter the short circuit levels and cause fuse-relay or fuse-fuse mis-coordination. This could affect the reliability and safety of the distribution system. In this context, it may be necessary to make adjustments in the protection schemes, changing relay settings or replacing or adding new relays and other
protection devices, in order to guarantee the integrity and reliability of the system. It is also imperious to verify how harmful the new fault currents can be and if they flow towards the substation. The contribution of the generators for the fault currents is more significant in urban system with low impedance circuits, than in rural systems, where the fault levels are typically smaller, and this contribution does not usually cause problems. Due to the elevation of the fault levels, the capacity of interruption of switching equipment should be verified for that new operation point, to guarantee their suitable operation when demanded. In case the replacement of circuit breakers or switches is necessary, the analysis of the short circuit level is essential for specifying them. They concluded that the critical clearing time (CCT) when a disturbance occurs in a system with embedded generation is much smaller than the clearing time in the absence of embedded generation. If a fault lasts longer than the CCT in a system with a synchronous generator, it would lose its synchronism with the network. In case of an induction generator, it would draw high inrush currents from the network until the over speed or other protection interrupted the fault.
3. Protection Coordination
Fundamental
Radial distribution systems, usually employ non-directional over-current relays (inverse or definite time), recloser and switch fuses in their protection systems. As these devices do not consider the flow direction, they may fail in cases when distributed generators contribute to the fault. A form of evaluating the protection coordination is through the analysis of the time vs current curves of the devices involved in the part of the network where the fault occurred. The primary protection is the one closest to the fault point and backup protection is the next between the fault and the source (substation or distributed generator). Backup protection should interrupt the fault only in cases when the primary fails to operate. It is important to remember that the utility objective is to maintain the load supply as long as possible, but the independent generator aims to protect its equipment from damage caused by the external system, so they must reach an agreement in questions related to low frequency/load curtailment situations or reclosing operations. The simulator described in the section III makes the simulation of several fault conditions and the verification of the coordination among overcurrent relays and/or fuses easier [7], [8].
To operate a power system appropriately, the system should have a well-designed and practically coordinated protection system. The protection requirements of a power system must take into account the following basic principles:
• Reliability: the ability of the protection to operate correctly.
International Journal of Energy and Power Engineering2013;
avoid damage to equipment.
• Selectivity: maintaining continuity of supply by disconnecting the minimum section to isolate the fault.
• Cost: maximum protection at the lowest possible cost.
Because distribution systems are typically designed in a radial configuration and with only one source, they have a very simple protection system, which is usually implemented using fuses, reclosers and over
In a distribution feeder, fuses must be coordinated with the recloser installed at the beginning or middle of the feeder. The coordination means that a fuse must operate only if a permanent fault affects the feeder (fuse saving scheme). For a temporary fault, however, the recloser must ra
to isolate the feeder and to give the fault a chance to self clear. If the fuse fails to operate for a permanent fault, the recloser will act as a backup by operating in its slow mode. The feeder relay will then operate if both the recloser and the fuse fail. To coordinate an over-current relay, as soon as a fault takes place, it is sensed by both primary and backup protection. The primary relay is the first to operate, as its operating time is less than that of the backup relay. In order to verify the coordination of a protection system, the performance of all protection devices in the fault current path between the sources and the fault point should be verified. These sources are the substation and the
Figure 1
The relays characteristic are based on IEC 255 standard (nearly inverse), which is expressed by the equation (1) [5]
0.02
0.14
i
i fi pickup
TD t
I
I =
−
International Journal of Energy and Power Engineering2013; 2(3): 121-127
Selectivity: maintaining continuity of supply by disconnecting the minimum section to isolate the
Cost: maximum protection at the lowest possible
Because distribution systems are typically designed in a radial configuration and with only one source, they have a very simple protection system, which is usually using fuses, reclosers and overcurrent relays. ust be coordinated with the recloser installed at the beginning or middle of the feeder. The coordination means that a fuse must operate only if a permanent fault affects the feeder (fuse saving scheme). For a temporary fault, however, the recloser must rapidly open to isolate the feeder and to give the fault a chance to self-clear. If the fuse fails to operate for a permanent fault, the recloser will act as a backup by operating in its slow mode. The feeder relay will then operate if both the recloser and current relay, as soon as a fault takes place, it is sensed by both primary and backup protection. The primary relay is the first to operate, as its operating time is less than that of the backup relay. In ify the coordination of a protection system, the performance of all protection devices in the fault current path between the sources and the fault point should be verified. These sources are the substation and the
distributed generator(s). The main aspect
coordination is that the primary device, closer to the fault point, should act before the backup device. It should be pointed out that, after the insertion of distributed generation, the faults are not interrupted by only opening a switch device at the substation side anymore, it is also necessary to eliminate the feeding from the independent producer. When the fault currents flowing in the chosen protection devices are different, the current scale presented in the coordination chart is valid for the backup device, and its curve is plotted directly from the tables of the NEPLAN database. In this case the curve of the primary protection relay or fuse is adjusted according to a factor that reflects the ratio between the circulating currents through the two devices.
4. Relay Protection Coordination of
Radial Systems
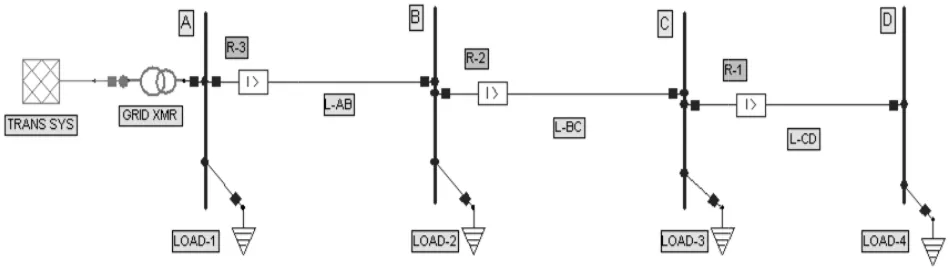
Fig. 1 shows a simple radial distribution system , where TRANS SYS is the transmission system, GRID XMR is the transformer, A, B, C and D are the buses of the system, their correspondent loads are load1, load2, load3 and load4, respectively, L-AB, L-BC, L
corresponding buses and R-1, R
current relays. When a fault occurs in the network over current protection takes place.
Figure 1. Distribution system with out distribution generation
The relays characteristic are based on IEC 255-3 standard (nearly inverse), which is expressed by the
0.02
1
TD
− (1)
Where:
TD = time dial setting of relay i. It is designed taking into account that the upstream relay
function to the downstream relay. Ifi = fault current seen by relay i. Ipickupi = pick up current of relay i.
127 123
distributed generator(s). The main aspect of the protection coordination is that the primary device, closer to the fault point, should act before the backup device. It should be pointed out that, after the insertion of distributed generation, the faults are not interrupted by only opening a switching device at the substation side anymore, it is also necessary to eliminate the feeding from the independent producer. When the fault currents flowing in the chosen protection devices are different, the current scale presented in the coordination valid for the backup device, and its curve is plotted directly from the tables of the NEPLAN database. In this case the curve of the primary protection relay or fuse is adjusted according to a factor that reflects the ratio between
s through the two devices.
. Relay Protection Coordination of
Fig. 1 shows a simple radial distribution system , where TRANS SYS is the transmission system, GRID XMR is the transformer, A, B, C and D are the buses of the system, rrespondent loads are load1, load2, load3 and load4, BC, L-CD are the lines between 1, R-2 and R-3 are the current relays. When a fault occurs in the network over-current protection takes place.
TD = time dial setting of relay i. It is designed taking into account that the upstream relay provides a backup function to the downstream relay.
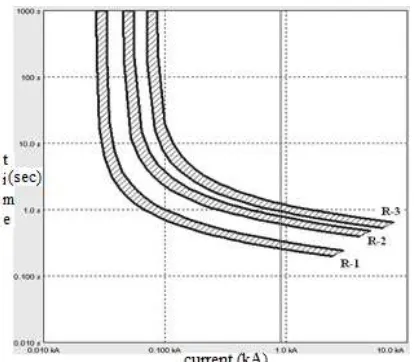
Figure 2. Selectivity diagram of Relays when fault applied to bus (without DG case)
In the network shown in Fig. 1, relay 2 also act as the backup of relay 1, and relay 3 also act as the backup of relay 2. The minimum difference between the operation times of primary/ backup protection is called coordination time interval (CTI). The CTI depends on a number of factors such as the circuit breaker operation time, delay and return time of the measuring element, etc. The TD settings are set in such a way that the farthest relay (relay 1) has the lowest TD. As for relay 2, if a fault happen in line CD, its operation time should be larger than that of relay 1 at least by the CTI. For relay 3 the same philos
When a 3-phase fault occurs at bus-D, R maximum fault current followed by R
fault occurs at bus-C R-2 will sense followed by R when fault occurs at bus-B then R-3 will operate. Fig. 2
If a 3-phase fault occurs in bus-C, relay R
the fault current followed by R-3 and if a fault occurs in bus-B then relay R-3 will alone clear the maximum fault current. The line data for the above test system is given in Appendix Table II. The type of DG used in the simulations is wind turbines, which are modelled as induction generators, using standard models available in the Neplan library. Induction generators are connect
respective buses through transformers (WTGXmr). Moreover, the distribution system is connected to the transmission network through another transformer (GridXmr). Their data is given in Appendix Table V and the
Selectivity diagram of Relays when fault applied to bus-D
In the network shown in Fig. 1, relay 2 also act as the backup of relay 1, and relay 3 also act as the backup of relay 2. The minimum difference between the operation times of primary/ backup protection is called coordination time interval (CTI). The CTI depends on a number of factors such as the circuit breaker operation time, delay and element, etc. The TD settings are set in such a way that the farthest relay (relay 1) has the lowest TD. As for relay 2, if a fault happen in line CD, its operation time should be larger than that of relay 1 at least by the CTI. For relay 3 the same philosophy is followed. D, R-1 will sense the maximum fault current followed by R-2 and R-3, when 2 will sense followed by R-3 and 3 will operate. Fig. 2
shows a selectivity diagram of r fault.
5. Relay Protection Coordination
Distributed Generation
The coordination of the relays is changed with the presence of DG depending on number, capacity and location of these units. In this section the f
are considered [5]. The type of DG used in the simulations is wind turbines, which are modelled as induction generators, using standard models available in the Neplan library.
5.1. Single DG interconnected case
Fig. 3 shows a, DG1 is connect downstream fault occurs, for instance in bus
and 3 will sense the downstream fault current, which it is greater than without DG due to the current contribution from the DG1. Then, relay 1 will clear the fault and the sensitivity will be enhanced because of the greater fault current. On the other hand, if a fault current is higher than permissible current limit, coordination between relays 1 and 2 may not hold [5]. If fault current is higher than permissible current limit, dif
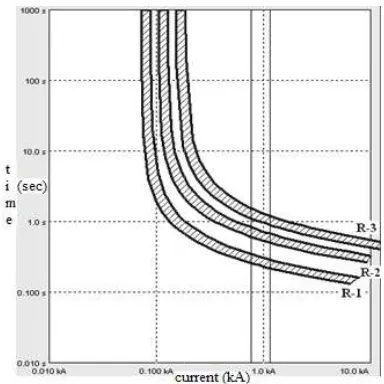
times of main and backup relay protection will be lower than the CTI and coordination may not hold [6]. Fig. 4 shows the selectivity diagram of the relays when fault is applied to bus-D.
Figure 3. Single DG connected to BUS-B
C, relay R-2 will sense 3 and if a fault occurs in 3 will alone clear the maximum fault ne data for the above test system is given in Appendix Table II. The type of DG used in the simulations is wind turbines, which are modelled as induction generators, using standard models available in the Neplan library. Induction generators are connected to their respective buses through transformers (WTGXmr). Moreover, the distribution system is connected to the transmission network through another transformer (GridXmr). Their data is given in Appendix Table V and the
transmission system data is presen values are collected in Appendix Table IV.
5.2. Two DG case
Fig. 5 shows, DG1 and DG2 (same characteristics as DG1) connected at bus B and bus C, respectively. For a downstream fault from DG2 the coordination of relays is the same as in the previous case and selectivity between them will hold if the fault is lower than the permissible current limit. For a fault in bus
relay 3 and for a fault in line bus while the loads, DG1 and DG2
vity diagram of relays for a down-stream
. Relay Protection Coordination with
Distributed Generation
The coordination of the relays is changed with the presence of DG depending on number, capacity and location of these units. In this section the following cases are considered [5]. The type of DG used in the simulations is wind turbines, which are modelled as induction generators, using standard models available in the Neplan
Single DG interconnected case
Fig. 3 shows a, DG1 is connected to bus B. If a downstream fault occurs, for instance in bus-D, relay 1, 2 and 3 will sense the downstream fault current, which it is greater than without DG due to the current contribution from the DG1. Then, relay 1 will clear the fault and the vity will be enhanced because of the greater fault current. On the other hand, if a fault current is higher than permissible current limit, coordination between relays 1 and 2 may not hold [5]. If fault current is higher than permissible current limit, difference between the operating times of main and backup relay protection will be lower than the CTI and coordination may not hold [6]. Fig. 4 shows the selectivity diagram of the relays when fault is
transmission system data is presented in Table III. The load values are collected in Appendix Table IV.
International Journal of Energy and Power Engineering2013;
proper coordination of the relays depends on the amount of fault current, which is increased when DG is connected to the system and should not exceed the predetermined current set range of the relays, if not, coordination may be lo can be said that with a downstream fault of DG, selectivity and coordination holds and sensitivity is improved as long as the fault current does not exceed the permissible limits. Whilst for an upstream fault the coordination is probable lost [6].
The short circuit current for a three phase fault in bus when DG-1 and DG-2 are connected to bus B and bus C and when they are not is shown. As in the two previous cases not appreciable difference between the short circuit current with and without DG is noticed. However, a slight decrease in the short circuit current when DG it is connected. This is a contradictory to the situation experienced before. The decrease in the short circuit current level when DG is connected to the system is caused by an increase on the impedance seen by the fault. Before the DG is connected, the radial system has less impedance and therefore the current seen by the fault is higher. On the other hand, the connection of DG increases the impedance
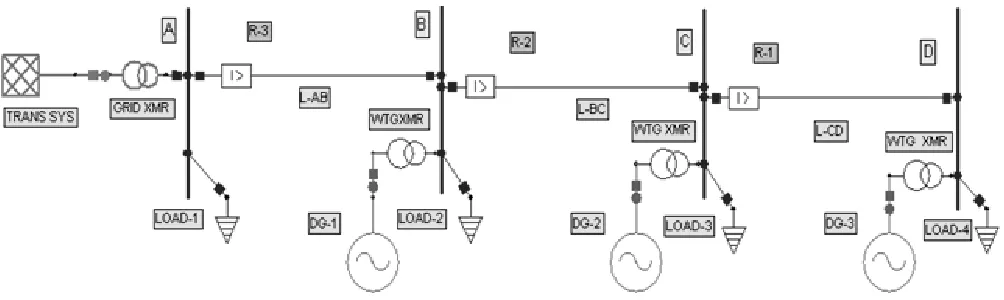
5.3. Three DG connected case
Fig. 6 shows that DG1, DG2 and DG3 are connected in the system and there is a 3-phase fault in bus
downstream), R3 will sense the maximum fault current, followed by R2 and R1. For a fault in bus
operate followed by R-3. For a fault in bus
lines upstream beyond bus-B, R2 will sense more current than R3.
According to the above analysis, the coordination impact under this situation can be summarized as follows. If the coordination relay pair detects a different current for a downstream or upstream fault, there is a margin available
International Journal of Energy and Power Engineering2013; 2(3): 121-127
proper coordination of the relays depends on the amount of fault current, which is increased when DG is connected to the system and should not exceed the predetermined current set range of the relays, if not, coordination may be lost. It can be said that with a downstream fault of DG, selectivity and coordination holds and sensitivity is improved as long as the fault current does not exceed the permissible limits. Whilst for an upstream fault the coordination is probable
The short circuit current for a three phase fault in bus-D 2 are connected to bus B and bus C and when they are not is shown. As in the two previous cases not appreciable difference between the short circuit noticed. However, a slight decrease in the short circuit current when DG it is connected. This is a contradictory to the situation experienced before. The decrease in the short circuit current level when DG is connected to the system is caused by an se on the impedance seen by the fault. Before the DG is connected, the radial system has less impedance and therefore the current seen by the fault is higher. On the other hand, the connection of DG increases the impedance
of the whole system in a proporti
impedance provided by the DG technology, which in this case are wind turbines.
Figure 4. Selectivity Diagram of Relays when fault applied to Bus
(with single DG case)
Figure 5. Two DG Connected to Radial System
Fig. 6 shows that DG1, DG2 and DG3 are connected in phase fault in bus-D (or further downstream), R3 will sense the maximum fault current, nd R1. For a fault in bus-C R-2 will 3. For a fault in bus-B, for any other B, R2 will sense more current
According to the above analysis, the coordination impact zed as follows. If the coordination relay pair detects a different current for a downstream or upstream fault, there is a margin available
for coordination to remain valid. If disparity in the fault currents sensed by the devices is more than the margin, coordination holds. Coordination is likely to hold if the DG fault injection is greater than the margin.
6. Results
The fault currents and corresponding tripping time of the relays with respect to that fault current are simulated using Neplan software and verified the results theoretically in TableI.
127 125
of the whole system in a proportion defined by the impedance provided by the DG technology, which in this
Selectivity Diagram of Relays when fault applied to Bus-D
for coordination to remain valid. If disparity in the fault currents sensed by the devices is more than the margin, oordination holds. Coordination is likely to hold if the DG fault injection is greater than the margin.
Figure 6. Three DG Connected to Radial System
7. Conclusions
The main type of fault that is focused in this paper is the worst fault that may arise in power systems, three phase fault. The radial network was modified and analyzed for different situations, changing the location and increasing the penetration of DG. Some general conclusions were extracted:
1) Penetration of any DG into a distribution system causes an increase in the fault level of the network at any fault location.
2) Penetration of a DG in the system causes it to lose
its radial power flow characteristics.
3) As the distance between the DG and the fault location increases the value of the fault current decreases.
For future investigation the integration of DG into existing distribution networks is a complex issue because data acquisition systems are not available. The installation of an information system such as the Supervisory Control and Data Acquisition (SCADA) system may help to solve many problems. The internet is already easily accessible; therefore it could be a great chance to utilize it for the purpose of power system operation.
Appendix
Table 1. Comparison of Theoretical and Practical results
Therotical Results Simulation Results (Neplan)
Case Fault Location Fault Current (kA)
Relay Operating Time (sec) Fault Current (kA)
Relay Operating Time (sec)
R-1 R-2 R-3 R-1 R-2 R-3
NO DG
BUS-D 0.91135 0.31 0.7502 1.25 0.894 0.300 0.711 1.1
BUS-C 1.24145 ---- 0.29 1.04468 1.229 ---- 0.274 0.961
BUS-B 1.37554 ---- ---- 0.35 1.361 ---- ---- 0.325
SINGLE
DG BUS-D 1.17154 0.292 0.6643 1.141 1.156 0.256 0.595 1.07
BUS-C 1.79685 ---- 0.235 0.9141 1.783 ---- 0.215 0.804
BUS-B 2.07672 ---- ---- 0.298 2.069 ---- ---- 0.286
TWO DG BUS-D 1.43528 0.225 0.5896 1.07502 1.420 0.197 0.483 0.939
BUS-C 2.5192 ---- 0.21 0.95165 2.491 ---- 0.19 0.826
BUS-B 2.76789 ---- --- 0.237 2.746 ---- --- 0.206
THREE DG BUS-D 2.1301 0.215 0.62361 1.0486 2.118 0.190 0.526 0.924
BUS-C 3.10246 0.521 0.2 --- 3.085 0.483 0.178 ---
BUS-B 3.26137 --- 0.265 0.572 3.259 --- 0.239 0.501
Table 2. Line data for the above section
From bus To bus Resistance (ohms)
Reactance (ohms)
A B 0.1256 0.1404
B C 0.1912 0.2122
C D 0.4874 0.5410
Table3. Transmission system data
Parameters Value
Maximum short circuit Power 100 MVA Minimum short circuit Power 90 MVA
Maximum R/X ratio 0.5
Maximum Z2/Z1 ratio 1
Maximum X0/X1 ratio 1
International Journal of Energy and Power Engineering2013; 2(3): 121-127 127
Table 4. Load data
Bus PL (MW) QL (MW)
A 7.6517 1.1607
B 0.4523 0.2003
C 0.7124 0.3115
D 0.1131 0.05
Table 5. Transformer data
Parameters WTG Xmr Grid Xmr
Rated power 630 kVA 20 MVA
Rated Voltage HV side 0.4 kV 33 kV
Rated Voltage LV side 11 kV 11 KV
Copper losses 8.1 kW 102.76 kW
No-load losses 1.9 kW 10.96 kW
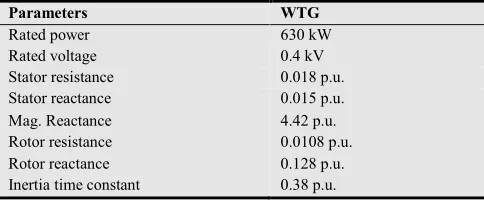
Table 6. Wind turbine generator data
Parameters WTG
Rated power 630 kW
Rated voltage 0.4 kV
Stator resistance 0.018 p.u.
Stator reactance 0.015 p.u.
Mag. Reactance 4.42 p.u.
Rotor resistance 0.0108 p.u.
Rotor reactance 0.128 p.u.
Inertia time constant 0.38 p.u.
Acknowledgements
The authors would like to thank NIT Warangal for providing NEPLAN software to carry out the simulation work.
References
[1] Vu Van Thong, J. D. “Interconnection Of Distributed Generators and Their Influences on Power System”. International Energy Journal, Vol. 6, No. 1, June 2005, Katholieke Universities Leuven, Belgium, pp. 3128-3140 [2] E. V. Mgaya, Z. M. “The Impact of Connecting Distributed
Generation to the Distribution System”. Czech Technical University, Acta Polytechnica Vol. 47 No. 4-5/2007, pp 96-101.
[3] F. Gonzalez-Longatt and C. Fortoul. “Review of Distributed Generation Concept: Attempt of Unification” International
Conference on Renewable Energies and Power Quality (ICREPQ´05), España, 16-18 March 2005.
[4] J. Sadeh, M. B. “Effect of Distributed Generation Capacity on the Coordination of Protection System of Distribution Network”. Azad University, IEEE, Iran, 2010., pp. 100-115. [5] E. B. Spier, F. A. B. Lemos, A. S. Bazanella, “Evaluation of the Independent Producers Connection to Radial Feeders in Distribution Systems (In Portuguese)”. VIII Simposium of Specialists in Electric Operational and Expansion Planning, Brasília, Brazil, 2002.
[6] M. T. Doyle, “Reviewing the Impacts of Distributed Generation on distribution System Protection”. Power Engineering Society Summer Meeting, 2002 IEEE, Vol. 1, pp 103-105, July 2002
[7] F. A. Viawan, D. Karlsson, A. Sannino and J. Daalder, “Protection scheme for meshed distribution systems with high penetration of distributed generation,” IEEE Power Sys. Conf., pp. 99-104, 2006.
[8] R. Dugan and D. Rizy, “Electric distribution problems associated with the interconnection of small, dispersed generation devices,” IEEE Trans. on Power Applications and Systems, vol. PAS-103, no. 6, pp. 1121–1127, June 1984.
[9] Liu KuiYuan, Xia Mingchao, “Impacts of DG on automatic reclosing of distribution networks”, Advanced Power System Automation and Protection (APAP), IEEE conf, 2011.
[10] Njozela. M, Chowdhury. S, Chowdhury. S.P, “Impacts of DG on the operation of auto-reclosing devices in a power network”, IEEE Power and Energy Society General Meeting, 2011.
[11] Dewadasa. M, Ghosh. A, Ledwich. G, “Protection of distributed generation connected networks with coordination of overcurrent relays” 37th Annual Conference on IEEE Industrial Electronics Society- IECON 2011.