Optimization Studies on Bio Oil Production from sweet lime
Empty Fruit Bunch by Pyrolysis Using Response Surface
Methodology
V.Sukumar
1, S. Sivaprakasam
2and V.Manieniyan
31
Assistant Professor, 2Associate Professor,
Department of Mechanical Engineering, Annamalai University, Annamalainagar, Tamil Nadu India 3
Assistant Professor, Directorate of Distance Education Annamalai University, Annamalainagar, Tamil Nadu, India
Abstract — Presently demand of fossil fuel is increasing
day to day in all over the world, in developing country like India need some alternate fuel for reducing the import cost of fossil fuel and reduce the emission. Many number of researcher doing research in the field of alternative fuel from bio waste and other biomass sources. In this present work describe the production of bio oil from sweet lime empty fruit bunch by pyrolysis method and investigate the effects of various parameter particle sizes, temperature and nitrogen gas flow rate on the product yields. The optimal condition for the bio oil production was obtained by testing the effect of various parameters on the pyrolysis. The experiments are carried out in fixed bed reactor with temperature, particle size and Nitrogen gas flow rate as parameter. The parameters are optimized by response surface methodology (RSM) with a Box-Behnken (BBD). The results show the bio oil yield is 28.3% for experimental and 28.2% for statistical method at optimum temperature of 550 ºC, 4mm of Particle size and 0.3 lit/min of gas flow rate.
Keywords: Bio oil, Char, Pyrolysis, RSM.
I. INTRODUCTION
Agricultural wastes and agricultural by-products has large amount of energy and it will not affect the atmospheric environment. The biomass and bio waste retains a large quantity of Cellulose, hemicelluloses and lignin. All the researchers have accepted biomass as potential source of conventional energy, as it benefits both energy recovery and environmental protection [1-2]. The main advantage of using agricultural residues is that they have little or no market value and ready for production in large quantities.
Various methods (thermo chemical conversion, biochemical conversion & fermentation) were used to convert the biomass into energy form. Among the thermo chemical conversion, Pyrolysis was one of the most efficient method to convert biomass into bio oil that can be used as alternate fuel. In fast pyrolysis method, biomass was converted into 39-74% of bio oil, 10-20% of char and rest as paralytic gas [3].
Bio oil was used in many applications, especially in alternate fuel. Thus, more researchers concentrate on improving the quantity and quality of the product yield. The fast pyrolysis was most
promising method for high yield of bio oil production [3-4]. The high yield of bio oil depends on various parameters like temperature, particle size, heating rate, gas flow rate and the cooling method of the pyrolysis vapours.
It is difficult to find the optimum parameter through experiments. The number of parameter combination for which the experiments is to be conducted makes it complex. Statistical experimental design such as response surface methodology (RSM) was used to optimize the process, thus reducing the experimental process [7]. This paper discusses the effect of various parameter combinations like temperature, particle size and Nitrogen gas flow rate on the yield of bio oil from empty fruit bunch based on Box-Behnken design in RSM.
II. EXPERIMENTAL TECHNIQUE
A. Pyrolysis procedure:
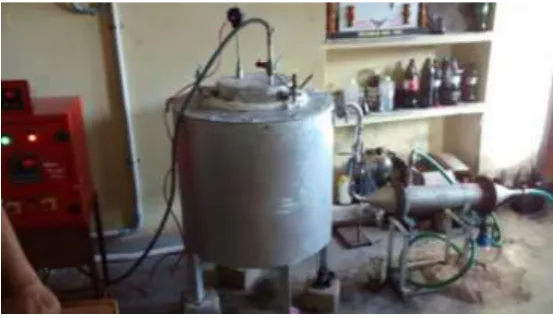
The experiments are carried by fast pyrolysis method in 2 kg Fixed bed reactor. The reactor inner diameter is 220 mm and length of 440 mm. Nitrogen gas (sweep gas) flow is connected in bottom of the reactor. The electric furnace is used to heat the reactor and temperature measured using a K-type thermocouple. A sample of sweet line empty fruit bunch (feed stock) and photo graphic view of experimental setup is shown in figure 1 and 2 respectively. The temperatures chosen are 500 °C, 550 °C and 600 °C and the heating rate is 10 °C /min. The sweep gas flow rates of N2 are conducted at 0.2
International Journal of Engineering Trends and Technology (IJETT) – Volume 25 Number 4- July 2015
(1)
(2)
(3)
B. Design of experiments:
In this research work, the three levels, Box-Behnken design is found to be appropriate for designing the experimental conditions. The process parameters coded are temperature (A), particle size of Empty fruit bunch (B) and flow rate of N2 (C). Table
1 shows, the level of each parameter are assigned in low, center and high levels as -1, 0 and +1 respectively. In this work, experiments are design based on three levels and three factors with 15 runs. Performance of the regression analysis is estimated using second order polynomial.
j
k
1
i
i
k
1
j
ij
2
i
k
1
i
ii
i
k
1
i
i
0
β
X
β
X
β
X
X
β
Y
(4)
Where
Y
is the predicted response,β
i
,β
j
andβ
ij
are coefficients estimated from the regression and they represent the linear, quadratic and crossproducts of
X
1
,X
2
andX
3on response and k is the number of studied factors.Fig. 1 sweet lime
Table 1 Experimental conditions proposed by BBD for EFB
Variable
Real values
Code -1 0 1
Temperature (°C) A 500 550 600
Size (mm) B 2 4 6
Flow rate lit/min C 0.2 0.3 0.4
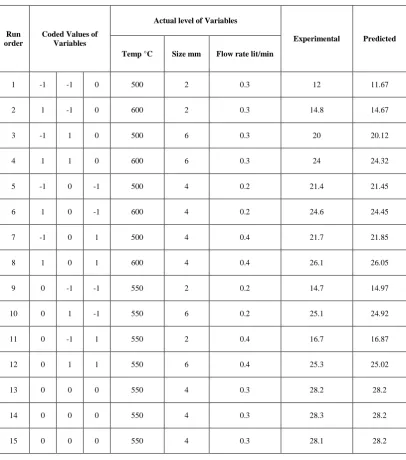
Table 2 BBD matrix for the experimental design and predicted responses for the oil yield
Run order
Coded Values of Variables
Actual level of Variables
Experimental Predicted
Temp °C Size mm Flow rate lit/min
1 -1 -1 0 500 2 0.3 12 11.67
2 1 -1 0 600 2 0.3 14.8 14.67
3 -1 1 0 500 6 0.3 20 20.12
4 1 1 0 600 6 0.3 24 24.32
5 -1 0 -1 500 4 0.2 21.4 21.45
6 1 0 -1 600 4 0.2 24.6 24.45
7 -1 0 1 500 4 0.4 21.7 21.85
8 1 0 1 600 4 0.4 26.1 26.05
9 0 -1 -1 550 2 0.2 14.7 14.97
10 0 1 -1 550 6 0.2 25.1 24.92
11 0 -1 1 550 2 0.4 16.7 16.87
12 0 1 1 550 6 0.4 25.3 25.02
13 0 0 0 550 4 0.3 28.2 28.2
14 0 0 0 550 4 0.3 28.3 28.2
International Journal of Engineering Trends and Technology (IJETT) – Volume 25 Number 4- July 2015
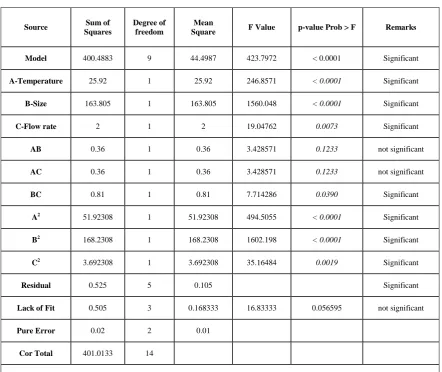
Table 3 ANOVA for Response Surface Quadratic model
Source Sum of
Squares
Degree of freedom
Mean
Square F Value p-value Prob > F Remarks
Model 400.4883 9 44.4987 423.7972 < 0.0001 Significant
A-Temperature 25.92 1 25.92 246.8571 < 0.0001 Significant
B-Size 163.805 1 163.805 1560.048 < 0.0001 Significant
C-Flow rate 2 1 2 19.04762 0.0073 Significant
AB 0.36 1 0.36 3.428571 0.1233 not significant
AC 0.36 1 0.36 3.428571 0.1233 not significant
BC 0.81 1 0.81 7.714286 0.0390 Significant
A2 51.92308 1 51.92308 494.5055 < 0.0001 Significant
B2 168.2308 1 168.2308 1602.198 < 0.0001 Significant
C2 3.692308 1 3.692308 35.16484 0.0019 Significant
Residual 0.525 5 0.105 Significant
Lack of Fit 0.505 3 0.168333 16.83333 0.056595 not significant
Pure Error 0.02 2 0.01
Cor Total 401.0133 14
Standard Deviation = 0.32, Mean = 22.071, R2 = 0.9987, Adjusted R2 = 0.9963, C.V. % = 1.47 Predicted R2 = 0.9997, Adequate
Precision = 62.459
III.RESULT AND DISCUSSION
The results of the ANOVA are tabulated in Table 3. The model is significant with F value of 423.80 .The probability of large F-value is only 0.01% , which could occur due to noise. If the values of "Prob > F" less than 0.0500, then the model is significant. The model terms
identified as significant here are A, B, C, BC, A2, B2 and C2.
If the values are greater than 0.1000, then the model was not significant. The "Lack of Fit F-value" of 16.83 implies the Lack of Fit is not significant relative to the pure error. There is a 5.66% possibility that a narge Lack of Fit F-value could occur due to noise. Non significant shown in lack of fit was
good. The Predicted R2 of 0.9987 was in rational agreement
with the Adjusted R2 of 0.9963, the difference is less than
0.2. Adequate Precision measures the signal to noise ratio. A ratio greater than 4 was attractive. The ratio of 62.459 shows an enough signal [7-8]. The experimental results are analysed using RSM. The results of the theoretically predicted outputs are given in Table 2. The mathematical expression of the relationship to the response with the variables is
Oil yield = 28.20 +1.80A +4.53B +0.50C +0.30AB
+0.30AC -0.45BC -3.75A2 -6.75B2 -1C2
(5)
The above equation can be used to identify the response for given levels of each factor. By default, the high levels of the factors are coded as +1 and the low levels of the factors are coded as -1. The coded equation is useful for identifying the relative impact of the factors by comparing the factor coefficients.
Where A, B and C are the temperature (°C),
paticle size (mm) and N2 flow rate (lt/min), respectively.
Fig 3. Actual versus predicted responses of bio oil yield
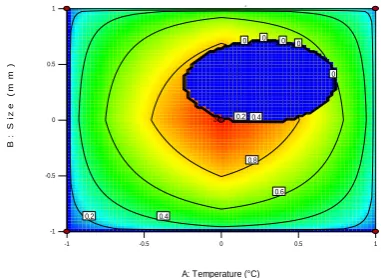
The three dimensional response surfaces which show the most important two variables temperature and
particle size on bio-oil conversion at N2 flow rate 0.3 lit/min
is shown in Fig.4. The maximum bio-oil conversion was obtained at 28.3 wt %, at constant 0.3 lit/min of flow rate, 550 °C of temperature and 4 mm of particle size [5]. Fig. 5 shows the three dimensional response surfaces of the
combined effects of temperature and N2 flow rate at constant
particle size 4 mm. The maximum bio-oil production 28.3
wt % was obtained at temperature 550 °C and N2 flow rate
0.3 lit/min. Fig. 6 shows the response surface graph for the optimum yield of bio oil. The figure depicts the interaction
between the N2 flow rate and particle size in three
dimensional response surfaces plots. The maximum conversion of 28.3 wt % was obtained at constant temperature 550°C.
Fig. 4 The combined effect of temperature and size for the yield of bio-oil at constant 0.3 lit/min of flow rate
Fig. 5 The combined effect of temperature and flow rate for the yield of bio-oil at constant 4 mm of size
Fig. 6 The combined effect of size and flow rate for the yield of bio-oil at constant temperature
A. Optimization of bio oil yield by response surface
modeling:
The optimum values, to obtain the bio oil yield , as inferred from the Desirability plot as shown in Fig.7. Under these conditions, the bio oil yield value predicted by the RSM design is 28.2% . To verify the accuracy of optimisation by RSM design. From the figur 5 the desirability value is 0.998 in condition of temperature 550°C, size 4mm and flow rate 0.3 lt/min is selected as optimum
value and the experimental value of oil yield valueis found
to be 28.3%. It is observed that the RSM predicted value of bio oil is 99 % accurate to the experimental value [8].
Fig 7. Desirability of tempersture and size Design-Expert® Software
Oil yield
Color points by value of Oil yield: 28.3 12 Actual P r e d ic te d
Predicted vs. Actual
10 15 20 25 30
10 15 20 25 30
Design-Expert® Software Factor Coding: Actual Oil yield (%)
Design points above predicted value
Design points below predicted value
28.3
12
X1 = A: Temperature X2 = B: Size
Actual Factor C: Flow rate = 0
-1 -0.5 0 0.5 1 -1 -0.5 0 0.5 1 10 15 20 25 30 O il y ie ld ( % )
A: Temperature (°C) B: Size (mm)
Design points above predicted value
Design points below predicted value
28.3
12
X1 = A: Temperature X2 = C: Flow rate
Actual Factor B: Size = 0
-1 -0.5 0 0.5 1 -1 -0.5 0 0.5 1 10 15 20 25 30 O il y ie ld ( % )
A: Temperature (°C) C: Flow rate (lt/min)
Design-Expert® Software Factor Coding: Actual Oil yield (%)
Design points above predicted value
Design points below predicted value
28.3
12
X1 = B: Size X2 = C: Flow rate
Actual Factor A: Temperature = 0
-1 -0.5 0 0.5 1 -1 -0.5 0 0.5 1 10 15 20 25 30 O i l y i e l d ( % )
B: Size (mm) C: Flow rate (lt/min)
Design-Expert® Software Factor Coding: Actual Desirability
Design Points 1.000
0.000
X1 = A: Temperature X2 = B: Size
Actual Factor C: Flow rate = 0
-1 -0.5 0 0.5 1
-1 -0.5 0 0.5
1 Desirability
A: Temperature (°C)
B : S iz e ( m m ) 0 0
0 0 0
International Journal of Engineering Trends and Technology (IJETT) – Volume 25 Number 4- July 2015
IV.CONCLUSION
Bio oil is produced from sweet lime empty fruit bunch by fast pyrolysis method and investigated the effects of various parameters such as particle size, temperature and nitrogen gas flow rate on the product yields. The parameters are optimized by response surface methodology (RSM) with a Box-Behnken (BBD). Mathematical model equations were built using sets of experimental data and ANOVA. The optimal conditions are obtained at pyrolysis temperature of 550 ºC, particle size of 4 mm and gas flow rate of 0.3 lit/min with the amount of bio oil yield was 28.2%.
REFERENCE
[1] Salamiah Zakaria, Zaidi Ab Ghani, Mat Riduan Md Isa,
Wahida Abdul Rahman, Noor Hafizah Uyup and
Yuswanie Md Yusof “ Optimization and
Characterization Studies of Bio-Oil Production from Jathropa curcas L. Husk by Pyrolysis using Response Surface Methodology” Jurnal Intelek, 7 (2012) 12- 20.
[2] Faisal Abnisa, W.M.A. Wan Daud, and J.N. Sahu
”Optimization and characterization studies on bio oil
production from palm shell by pyrolysis using response surface methodology” Bio mass and Bio energy 35 (2011) 3604-3616.
[3] Jale Yanik, Christoph Kornmayer, Mehmet Saglam and
Mithat Yüksel “Fast pyrolysis of agricultural wastes: Characterization of pyrolysis products”, Fuel processing technology 88(10):942-947, 2007.
[4] M. Balat, M. Balat, E. Kirtay, H. Balat Main routes for
the thermo-conversion of biomass into fuels and chemicals. Part 1: Pyrolysis systems” Energy Convers. Manage., 50 (2009), 3147–3157.
[5] Papita Das Saha, Sagnik Chakraborty and Subhabrata
Das “Optimization of hazardous crystal violet by chemically treated rice husk: Using central composite response surface methodology” Arch. Environ. sci 6 (2012) 57-61.
[6] V.Manieniyan and S.Sivaprakasam, “Investigation of
diesel engine using biodiesel (Methyl ester of Jatropha oil) for various injection timing and injection pressure”, SAE Journal, 2008-01-1577.
[7] Eylem P. Onal, Basak Burcu Uzun and Ayse Eren Putun
“Steam pyrolysis of an industrial waste for bio-oil production” Fuel Processing Technology 92 (2011) 879– 885.
[8] Alina Rahayu Mohamed, Zainab Hamzah, Mohamed