393 | P a g e
ANALYSIS AND DETECTION OF BRAIN TUMOUR
USING IMAGE PROCESSING TECHNIQUES
P.V.Rohini
1, Dr.M.Pushparani
21
M.Phil Scholar, Department of Computer Science, Mother Teresa women’s university, (India)
2Professor and Head, Department of Computer Science, Mother Teresa women’s university, (India)
ABSTRACT
Medical image segmentation is complex to detect the accurate results of tumour or cancer cells. Even in developed countries the manual segmentation is difficult. Most of the peoples who have brain tumours were died due to the fact of inaccurate detection. The medical images can either CT Scan or MRI Scan images are used. The medical image segmentation is a difficult task and is par with the manual segmentation. This paper deals with the detection and segmentation of a brain tumour in brain. There are n number of algorithms will be developed for medical image segmentation. The tumour is of two types: Benign tumours or malignant tumours. In this study the boundary of tumour region is segmented and then the ntropy value and PSNR value will be evaluated for brain tumour images.
Keywords: Entropy Evaluation, Image Band Analysis, Image Segmentation, Morphological
Operation, and PSNR Evaluation.
I. INTRODUCTION
A tumour is abnormal tissue that grows by uncontrolled cells. Normally the cells grow in a controlled manner.
The new cell replaces the old or damaged cells. Brain tumour may be primary or secondary. The primary
tumour is the starting stage of tumour whereas the secondary tumour is the spreading of tumour from another
area of tumour. The term tumour literally means swelling. Tumours are of different types and it has different
characteristics and different treatment. The input image of the brain MRI image is taken from the available data
base or the real time image by using the scanner. The brain MRI image may be either RGB or gray scale.
II. REVIEW OF LITERATURE
The boundary of the tumour in an image is usually traced by hand which is time consuming and difficult to
detect and localize, detection becomes infeasible with large set of data sets. While typically dealing with
medical images where pre-surgery and post-surgery decisions are required for the purpose of initiating and
speeding up the recovery process. Computer aided detection of abnormal growth of tissues is primarily
motivated by the necessity of achieving maximum possible accuracy. Manual segmentation of these abnormal
tissues cannot be compared with modern day’s high speed computing machines which enable us to visually
observe the volume and location of unwanted tissues. Hence there is a need for the automatic system for the
394 | P a g e abnormality in the image. The Medical Image segmentation deals with segmentation of tumour in MR images
for improved quality in medical diagnosis. It is very important and a challenging problem due to noise present in
input images while doing image analysis. Here the segmentation is carried out using k-means and fuzzy c-means
clustering algorithm for better performance. This enhances the tumour boundaries more clearly. Tumour can be
found with more precision and also fast detection is achieved with only few seconds for execution. The input
image of the brain is taken either from the available data base or the real time image by using the scanner. So
that the presence of tumour in input image can be detected and the area of the tumour can also be analysed. [3].
The main objective is to detect and segment the brain tumour using watershed and thresholding algorithm.
BrainTumour segmentation in magnetic resonance imaging (MRI) has become an emergent research area in the
field of medical imaging system. Brain tumour detection helps in finding the exact size, shape, boundary
extraction and location of tumour. The system will consist of three stages to detect and segment a brain tumour.
An efficient algorithm will proposed for tumour detection based on segmentation and morphological operators.
Firstly quality of scanned image will enhanced and then morphological operators will be applied to detect the
tumour in the scanned image. To improve the quality of images and limit the risk of distinct regions fusion in
the segmentation phase an enhancement process will be applied. It will be simulate on Mat lab Software. [4].
The Tumour is an uncontrolled growth of tissue in any part of the body. The tumour is of different types and
they have different characteristics and different treatment. This paper is to implement of Simple Algorithm for
detection of range and shape of tumour in brain MR Images. Normally the anatomy of the Brain can be viewed
by the MRI scan or CT scan. MRI scanned image is used for the entire process. The MRI scan is more
comfortable than any other scans for diagnosis. It will not affect the human body, because it doesn’t practice any
radiation. It is centred on the magnetic field and radio waves. There are dissimilar types of algorithm were
developed for brain tumour detection. But they may have some drawback in detection and extraction. After the
segmentation, which is done through k-means clustering and fuzzy c-means algorithms the brain tumour is
detected and its exact location is identified. Comparing to the other algorithms the performance of fuzzy
c-means plays a major role. The patient's stage is determined by this process, whether it can be cured with
medicine or not. [1].
Brain tumour segmentation is an important procedure for early tumour diagnosis and radiotherapy planning.
Although numerous brain tumour segmentation methods have been presented, enhancing tumour segmentation
methods is still challenging because brain tumour MRI images exhibit complex characteristics, such as high
diversity in tumour appearance and ambiguous tumour boundaries. To address this problem, we propose a novel
automatic tumour segmentation method for MRI images. This method treats tumour segmentation as a
classification problem. Additionally, the local independent projection-based classification (LIPC) method is
used to classify each voxel into different classes. A novel classification framework is derived by introducing the
local independent projection into the classical classification model. Locality is important in the calculation of
local independent projections for LIPC. Locality is also considered in determining whether local anchor
embedding is more applicable in solving linear projection weights compared with other coding methods.
Moreover, LIPC considers the data distribution of different classes by learning a softmax regression model,
which can further improve classification performance. In this study, 80 brain tumour MRI images with ground
truth data are used as training data and 40 images without ground truth data are used as testing data. The
segmentation results of testing data are evaluated by an online evaluation tool. The average dice similarities of
395 | P a g e patient data are 0.84, 0.685, and 0.585, respectively. These results are comparable to other state-of-the-art
methods. [5].
This paper deals with the detection of tumour stage in brain MR images with efficient algorithm and 3D
assessment of brain for tumour detection providing better result. Tumour is an abnormal growth of tissues
reproducing themselves in any part of the body. There are different types of tumour having different
characteristics and treatment. A large number of people having brain tumours die due to inaccurate detection.
Magnetic resonance imaging (MRI) is a diagnostic procedure that uses a combination of radio frequencies, large
magnet, and a computer to generate detailed images of organs and structures within the body. MR image is
examined visually by the physician for detection & diagnosis of brain tumour. However this method of detection
consists of less accuracy while detecting the stage & size of tumour. This project uses a computer aided method
for segmentation (detection) of brain tumour based on the combination of algorithms. In this method
segmentation of tumour tissue is done with accuracy and reproducibility than manual segmentation with less
analysis time. Then the tumour is extracted from the MR image and its exact position, shape and stage is
determined. Then 3D analysis of brain MRI with the help of 3D analyser tool and graph generation for tumour
growth rate of particular patients and tumour types will be done. [2].
Brain tumour analysis is done by doctors but its grading gives different conclusions which may vary from one
doctor to another. So for the ease of doctors, a research was done which made the use of software with edge
detection and segmentation methods, which gave the edge pattern and segment of brain and brain tumour itself.
Medical image segmentation had been a vital point of research, as it inherited complex problems for the proper
diagnosis of brain disorders. In this research, it provides a foundation of segmentation and edge detection, as the
first step towards brain tumour grading. Current segmentation approaches are reviewed with an emphasis placed
on revealing the advantages and disadvantages of these methods for medical imaging applications. The use of
image segmentation in different imaging modalities is also described along with the difficulties encountered in
each modality. [6].
Accurate image segmentation is important for many image, video and computer vision applications. Over the
last few decades, many image segmentation methods have been proposed. However, the results of these
segmentation methods are usually evaluated only visually, qualitatively, or indirectly by the effectiveness of the
segmentation on the subsequent processing steps. Such methods are either subjective or tied to particular
applications. They do not judge the performance of a segmentation method objectively, and cannot be used as a
means to compare the performance of different segmentation techniques. A few quantitative evaluation methods
have been proposed, but these early methods have been based entirely on empirical analysis and have no
theoretical grounding. In this paper, we propose a novel objective segmentation evaluation method based on
information theory. The new method uses entropy as the basis for measuring the uniformity of pixel
characteristics (luminance is used in this paper) within a segmentation region. The evaluation method provides a
relative quality score that can be used to compare different segmentations of the same image. This method can
be used to compare both various parameterizations of one particular segmentation method as well as
fundamentally different segmentation techniques. The results from this preliminary study indicate that the
proposed evaluation method is superior to the prior quantitative segmentation evaluation techniques, and
identify areas for future research in objective segmentation evaluation. [7].
396 | P a g e
III. SEGMENTATION PROCESS OF BRAIN TUMOUR
To segment the tumour part the process are shown in flow diagram.
Fig.1 Flow Diagram
3.1 Image Band Range Analysis
The histogram of an image normally refers to a histogram of the pixel intensity values. The histogram is a graph
showing the number of pixels in an image at each different intensity value found in that image. For an 8-bit
grayscale image there are 256 different possible intensities, and so the histogram will graphically display 256
numbers showing the distribution of pixels amongst those grayscale values. Histogram can also be taken of
color images.
Each individual histogram of red, green and blue channels can be taken or a 3-D histogram can be produced,
with three axes representing red, green and blue channels and brightness at each point representing the pixel
count. It may simply be a picture of the required histogram in a suitable image format. [14].
397 | P a g e 3.1.1 Probability Distribution
A histogram is a graph that shows us the current tonal range of image. Tonal Range means the brightness values
of the image. The total area of a histogram used for probability density is always normalized to 1. [9].
3.1.1 RGB Image Bands
A colour histogram of an image represents the distribution of the composition of colours in the image. It shows different types of colours appeared and the number of pixels in each type of the colours appeared. The relation between a colour histogram and a luminance histogram is that a colour histogram can be also expressed as “Three Colour Histograms”, each of which shows the brightness distribution of each individual Red/Green/Blue
colour channel. [10].
3.2 Enhanced Image Band Quality
The process of enhancing the images is to improve the visual quality due to non-ideal image acquisition process.
The image enhancement is to improve the interpretability or perception of information in images. [11].
3.2.1 Improved Image Bands
To improve the interpretability or perception of information in images for human viewers or provide better input
for other automated image processing techniques. It sharpens the image features such as edges, boundaries or
contrast to make graphic display more helpful for display and analysis. [11].
3.3 Segmentation Process
Image segmentation is a set of segments that collectively cover the entire image, or a set of contours extracted
from the image. Each of the pixels in a region is similar to some property such as colour, intensity or texture.
[12].
3.4 Morphological Operations
Morphological processing is constructed with operations on set of pixels. It relies on the ordering of pixels in an
image and many times is applied to binary and gray scale images. The process include such as erosion, dilation,
opening and closing.
3.4.1 Skeletal Image
The purpose of the morphological operators is to separate the part of tumour of the image. The portion of the
tumour part is visible as white colour which has the highest intensity then other regions of the image. [13].
3.5 Entropy Evaluation
Entropy is the quantitative measure of disorder in a system. Entropy is an extensive property. The entropy value
is evaluated in the form of table, graph, chart etc.
3.6 Psnr Analysis
Peak signal-to-noise ratio, often abbreviated PSNR is an engineering term of the ratio between the maximum
possible power of a signal and the power of corrupting noise that affects the fidelity of its representation. PSNR
is usually expressed in terms of the logarithmic decibel scale. PSNR is mostly defined via the mean squared
398 | P a g e The PSNR is defined as:
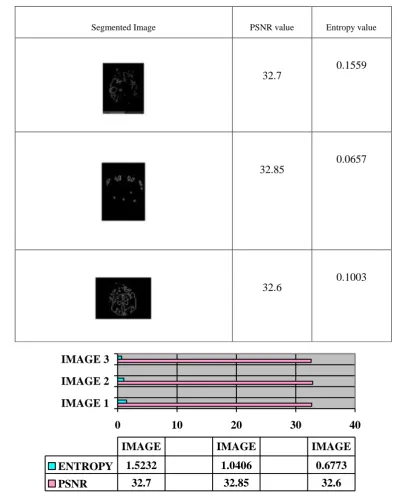
Table 1 Entropy Evaluation and PSNR Calculation
Segmented Image PSNR value Entropy value
32.7
0.1559
32.85
0.0657
32.6
0.1003
0
10
20
30
40
IMAGE 1
IMAGE 2
IMAGE 3
ENTROPY
1.5232
1.0406
0.6773
PSNR
32.7
32.85
32.6
IMAGE
IMAGE
IMAGE
399 | P a g e
IV. CONCLUSION
According to my paper, ANALYSIS AND DETECTION OF BRAIN TUMOUR USING IMAGE
PROCESSING TECHNIQUES the region of boundary of an tumour is detected and segmented the color brain
MRI images using image processing techniques and then the entropy and PSNR value is analyzed and
evaluated.
REFERENCES
[1]. Alan Jose, S.Ravi and M.Sambath(2014) “Brain Tumour Segmentation Using K-Means Clustering And
Fuzzy C-Means Algorithms and its Area Calculation”
[2]. PurnitaMajumder and V.P.K.Shirsagar (2013) “Brain Tumour Segmentation and Stage Detection in Brain MR Images with 3D Assessment”
[3]. G.A.Leela and H.VeenaKumari (2014) “Morphological Approach for the Detection of Brain Tumour and
Cancer Cells”
[4]. R.G.Selkar, M.N.Thakare and B.J.Chilke (2014) “Review on Detection and Segmentation of Brain
Tumour using Watershed and Thresholding Algorithm”
[5]. Meiyan Huang, Wei yang, Yao Wu, Jun Jiang and Wufan Chen (2014) “Brain Tumour Segmentation
Based on Local Independent Projection-based Classification”
[6]. KimmiVerma, AruMehrotra, VijayetaPandey, Shardendu Singh (2013) “Image Processing Techniques for
the Enhancement of brain tumour patterns”
[7]. Hui Zhang, Janson E. Fritts and Sally A.Goldman “Entropy Based Objective Evaluation Method for Image
Segmentation”
[8]. http://docs.opencv.org/trunk/doc/py_tutorials/py_imgproc/py_histograms/py_histogram_begins/py_histogr
am_begins.html
[9]. http://www.photoshopessentials.com/photo-editing/histogram/
[10].http://en.wikipedia.org/wiki/Colour_histogram
[11].http://www.csee.wvu.edu/~xinl/courses/ee465/image_enhancement.pdf
[12].http://in.mathworks.com/discovery/image-segmentation.html
[13].https://www.cs.auckland.ac.nz/courses/compsci773s1c/lectures/ImageProcessing-html/topic4.htm
[14].http://homepages.inf.ed.ac.uk/rbf/HIPR2/histgram.htm
[15].P.V.Rohini and Dr.M.Pushpa Rani (2015) “BRAIN TUMOUR SEGMENTATION WITH IMAGE