The Effectiveness of a Home Visit to Prevent Childhood Injury
W. James King, MD*; Terry P. Klassen, MD‡; John LeBlanc, MD§; Anne-Claude Bernard-Bonnin, MD
储
;
Yvonne Robitaille, PhD¶; Ba’ Pham, MSc*; Douglas Coyle, MSc#; Milton Tenenbein, MD**;
and I. Barry Pless, MD‡‡
ABSTRACT. Objective. To examine the effectiveness of a home visit program to improve home safety and decrease the frequency of injury in children. We exam-ined the effects of the program on 1) parental injury awareness and knowledge; 2) the extent that families used home safety measures; 3) the rate of injury; and 4) the cost effectiveness of the intervention.
Design. A randomized, controlled trial.
Setting. A multicenter trial conducted at 5 hospitals in 4 Canadian urban centers.
Participants. Children <8 years old, initially en-rolled in an injury case-control study, were eligible to participate.
Intervention. Subsequent to a home inspection con-ducted to determine baseline hazard rates for both groups, participants in the intervention group received a single home visit that included the provision of an formation package, discount coupons, and specific in-struction regarding home safety measures.
Main Results. The median age was 2 years, with
males comprising⬃60% of participants. The experimen-tal groups were comparable at outset in terms of case-control status, age, gender, and socioeconomic status. Parental injury awareness and knowledge was high; 73% correctly identified injury as the leading cause of death in children, and an intervention effect was not demon-strated. The adjusted odds ratios (ORs) for the home inspection items indicated that significant safety modi-fications only occurred in the number of homes having hot water not exceeding 54°C (OR: 1.31, 95% confidence interval [CI]: 1.14, 1.50) or the presence of a smoke detec-tor (OR: 1.45, 95% CI: 0.94, 2.22). However, the interven-tion group reported home safety modificainterven-tions of 62% at 4 months and significantly less injury visits to the doctor compared with the nonintervention group (rate ratio: 0.75; 95% CI: 0.58, 0.96). The total costs of care for injuries were significantly lower in the intervention group com-pared with the nonintervention group with a cost of $372 per injury prevented.
Conclusions. An intervention using a single home visit to improve the extent to which families use safety measures was found to be insufficient to influence the long-term adoption of home safety measures, but was effective to decrease the overall occurrence of injuries. Future programs should target a few, well-focused, evi-dence-based areas including the evaluation of high-risk groups and the effect of repeated visits on outcome.
Pediatrics 2001;108:382–388; injury, home visit, random-ized controlled trial, safety, children, cost effectiveness.
ABBREVIATIONS. ED, emergency department; OR, odds ratio; CI, confidence interval.
I
njuries are the leading cause of death in
child-hood and a significant cause of morbidity.
1,2Al-though the home should be a haven of safety, for
children
⬍
15 years old, and especially for
preschool-ers, this setting represents the most frequent site of
injury occurrence.
2,3Among the most serious of
po-tential hazards are falls, suffocation, burns, and
poi-soning.
4 – 8Such injuries are numerous, not only
be-cause of increased exposure, but also bebe-cause young
children’s rapid physical development surpasses
their ability to recognize and avoid potential dangers
in their environment.
9As many injuries sustained by
children in the home are related to a lack of
appro-priate safety measures,
10 –13prevention efforts
di-rected toward the reduction of household hazards
should be implemented and evaluated.
Evidence from randomized, controlled trials
sup-ports the notion that anticipatory guidance by
phy-sicians may decrease the risk of an injury at
home.
14 –16A trial of nurse home visit services has
been shown to be effective in improving a variety of
health and social outcomes, including injury
preven-tion.
17Furthermore, a systematic review of
random-ized trials has shown that home visit program have
the potential to significantly reduce rates of child
injury.
18As such, home visits may be an important
addition to injury prevention strategies, and the role
of home visitors and nonprofessionals in the
preven-tion of child injury deserves addipreven-tional attenpreven-tion.
The present study was conducted to explore the
extent to which a home visit program would
im-prove the safety of the home environment and
de-crease the frequency of injuries. We examined the
effects of the program on 1) parental injury
aware-ness and knowledge; 2) families’ use of home safety
measures; 3) the rate of injury; and 4) the
cost-effec-tiveness of the intervention.
From the *Department of Pediatrics and Children’s Hospital of Eastern Ontario Research Institute, University of Ottawa, Ottawa, Ontario, Canada; ‡Department of Pediatrics, University of Alberta, Edmonton, Alberta, Can-ada; §Department of Pediatrics, Dalhousie University, Halifax, Nova Scotia; 储Department of Pediatrics, University of Montreal, Montreal, Quebec, Can-ada; ¶Direction de la sante publique de Montreal-Centre, Montreal, Quebec, Canada; #Department of Medicine, University of Ottawa, Ottawa, Ontario, Canada; **Department of Pediatrics, University of Manitoba, Winnipeg, Manitoba; ‡‡Department of Pediatrics, McGill University, Montreal, Que-bec, Canada.
Received for publication Jun 9, 2000; accepted Feb 20, 2001.
Reprint requests to (W.J.K.) Division of Academic General Pediatrics, Chil-dren’s Hospital of Eastern Ontario, 401 Smyth Rd, Ottawa, Ontario, Canada K1H 8L1. E-mail: king@cheo.on.ca
METHODS
This multicenter, randomized controlled trial was conducted within the context of a case-control study. The following sites participated in the trial: the Montreal Children’s Hospital, Mon-treal, Quebec, Canada; Hoˆpital Ste Justine, MonMon-treal, Quebec, Canada; IWK-Grace Health Center, Halifax, Nova Scotia, Canada; the Children’s Hospital of Eastern Ontario, Ottawa, Ontario, ada; the Winnipeg Children’s Hospital, Winnipeg, Manitoba, Can-ada. The research ethics committees of each institution approved the study protocol.
Participants
Participants⬍8 years old presenting to the emergency depart-ment (ED) of each participating center from September 1994 to October 1996, were identified using ED logs and the Canadian Hospitals Injury Reporting and Prevention Program of the Health Protection Branch, Health Canada. Children were eligible for the case-control study if they presented with 1 of the following tar-geted injuries: tap water scald; burn from a household fire; poi-soning or ingestion; choking from the ingestion of a foreign object; fracture, sprain, strain, cut, or bruise from a fall from a height; and head injury while riding a bicycle. Two controls, matched for gender and within 6 months of age, were selected for each tar-geted case. The first control was selected with a nontartar-geted injury (ie, one occurring either outside the home or a home injury not listed above). The second control was chosen from patients with a medical illness presenting to the same ED.
Intervention and Study Design
A research assistant contacted the family by telephone within 3 days of the ED visit to confirm eligibility and to arrange a home visit within 1 week. To ensure uniformity, the research assistants were trained to make a series of specific, structured observations regarding home safety hazards that included the following: ready access by children to small objects, matches, lighters, cleaning supplies, beauty supplies, medications, or electrical cords; win-dows which open easily beyond 6 inches; the absence of child resistant caps on medicines; tap water⬎54°C; the presence of a functioning smoke detector on each house level; a fire extin-guisher; safety gates at stairs; the presence of a infant walker; ease of opening basement door; the absence of certified bicycle helmets; child seat restraints; and by report only, the failure to use bicycle helmets and automobile restraints at all times. After the observa-tions were completed, the home visitor administered a question-naire regarding parental knowledge and awareness of injuries, the child’s history of past injuries requiring medical treatment, and the number of injuries involving other children in the family. After all the above measures were completed, an additional informed consent for the randomized, controlled trial was obtained from the child’s parents.
Children were randomized by the following method: an equal number of intervention and nonintervention identification cards were placed in sealed envelopes, mixed in an opaque container, sequentially numbered as they were withdrawn, and distributed in aliquots to each study site. Each home was assigned to 1 of 2 groups. Parents in the intervention group received an information package on injury prevention. The findings of the home visit were reviewed, and the family instructed on how to correct any defi-ciencies in home safety. As well, a set of coupons from a national retail store (Canadian Tire) for a $10 discount per item (to a maximum of $50) when purchasing recommended safety devices were given to each family. Finally, detailed instructions regarding each of the targeted injuries, along with demonstrations of the appropriate use of the safety device(s), were provided. This infor-mation was reinforced by follow-up telephone calls at 4 and 8 months after the initial home visit. A letter from each site’s project director stressing the need to maintain the preventive behaviors was also sent to all intervention families.
Parents of children in the nonintervention group received a general pamphlet on safety but did not receive the information package, review of the home safety findings, discount coupons, or any specific instruction regarding safety measures. One exception was the notification of families in the nonintervention group of the finding of a nonfunctioning smoke detector. All participants were contacted by telephone at 4 and 8 months, and a research assistant
blinded to the intervention assignment completed a final home visit 1 year after the initial home visit.
Sample size was calculated based on the desire to observe a 10% difference in the adoption of the home safety behaviors between the intervention groups assuming a type I error (2-sided) of 0.05 and a type II error of 0.20 (ie, statistical power of 80%). These calculations resulted in a desired sample of 375 participants in each group.19
Statistical Analysis
Participants’ characteristics, including injury awareness and knowledge, were compared between intervention groups using the Wilcoxon rank sum test for ordinal or interval scale variables and2test for categorical variables. Similarly, dropouts and
com-pleters were compared for any differences in their baseline char-acteristics. Injury knowledge and awareness were compared be-tween interventions using an analysis of variance with the dependent variable the change at 1 year expressed as a percentage of the baseline score. The analysis of variance included interven-tion, center, and their interaction. Least-square estimates of inter-vention effect were derived from the fitted models. Standard residual diagnostics were used for model goodness-of-fit.
The intervention with respect to the likelihood of adopting a given prevention strategy was compared using the desired out-comes of a reduction in potential hazards in the various home areas targeted by the intervention (eg, the hazard of choking by having small objects within children’s reach in the living room). Each outcome was analyzed separately, taking into account its baseline hazard rate, intervention, center, mechanism of injury, age, and gender using logistic regression models. Odds ratios (ORs) of intervention effects and their 95% confidence intervals (CIs) were derived from the fitted models. Standard residual diagnostics were used to check for goodness-of-fit of the models. Rates of injury-prone hazards were derived in the control group to aid in the interpretation of the ORs of intervention effect estimates. The extent to which the intervention decreased the frequency of injury requiring a physician visit was evaluated by comparing injury frequency between intervention groups using2test and
the ratio of injury per-person year was derived assuming a Pois-son distribution for the number of injuries.20
Economic Analysis
The objective of the economic analysis was to assess the cost-effectiveness of the intervention in terms of the incremental cost per injury prevented, therefore, all health care costs incurred as a direct result of the preventive program and all costs avoided through the reduction in injuries were estimated.21,22The cost of
the preventive program was estimated by combining the salary and infrastructure costs for the home visitors with the costs of the information packet provided to parents. The costs associated with treatment of injuries were calculated from a typical resource pro-file for each type of injury obtained from a panel of physicians. The costs of the injury treatment resources were derived from the Children’s Hospital of Eastern Ontario cost model and from the Ontario Health Insurance Plan Schedule of Fees and Benefits. The cost model follows accepted guidelines whereby the direct costs of treatment (eg, staff, consumables) are allocated to the treatments received, while indirect costs (eg, overheads) are allocated to treatments through a simultaneous equation allocation methodol-ogy.23All costs are reported in 1999 Canadian dollars.
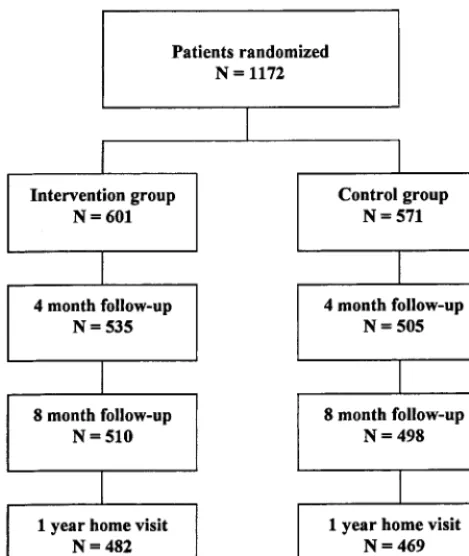
RESULTS Participant Characteristics
Figure 1 outlines the flow of participants from the
point of being randomized through to the last
fol-low-up contact. Baseline characteristics of the
partic-ipants are displayed in Table 1 and detailed
else-where.
24The median age in both groups was 2 years,
cor-rectly identified injury as the leading cause of death
in children
⬍
8 years old, and median scores for the
perception of accident preventability were 7 and 8
(out of 10) for the intervention and nonintervention
groups, respectively. The median score for perceived
control over decreasing accident risk was 7 (out of
10) in both groups.
Before the 1-year follow-up, 19% of randomized
participants were lost to attrition. Participants who
dropped out of the study (dropouts) had: 1)
signifi-cantly younger parents; 2) younger age at which
mother had her first child; and 3) fewer years of
minimum parental education compared with those
who completed the trial (
P
⬍
.001). Additionally,
dropouts were less likely to identify injury as the
leading cause of death (
P
⫽
.004). There were no
major differences between the dropouts randomized
to intervention (
N
⫽
118) and control (
N
⫽
103).
Table 3 indicates that there were no significant
changes in parental injury awareness and knowledge
from baseline between the intervention and control
groups. Adjusted ORs for the home inspection items
are given in Table 4, along with the baseline rates in
the control groups. Significant changes were
ob-served in the number of participant homes who had
hot water not exceeding 54 degrees centigrade (OR:
1.31; 95% CI: 1.14, 1.50) and who had smoke
detec-tors on some or all levels (OR: 1.45; 95% CI: 0.94,
2.22). However, there was no difference whether all
or some smoke detectors were fully functional (OR:
1.01; 95% CI: 0.79, 1.30). There was a significant
difference, favoring the group without intervention,
in the number of participant homes who had a fire
extinguisher (OR: 0.81; 95% CI: 0.67, 0.97). There
were no interactions between intervention and
insti-tution in any of the presented outcomes.
Intervention Effect on Injury Rate
At 4 months, participants in the intervention
group tended to report fewer injury visits to the
doctor (7%) as compared with those in the control
group (11%;
P
⬍
.05; Table 5). At the completion of
the trial, the rate of reported injury visits to the
doctor was 0.23 per patient year (95% CI: 0.19, 0.29)
for the intervention group and 0.31 per patient year
(95% CI: 0.27, 0.37) for the control group. The rate
ratio between the intervention and the control group
was 0.75 (95% CI: 0.58, 0.96). In addition, the number
of participants in the intervention group who
re-ported home safety modifications was 62% at 4
months and 23% at 8 months.
Economic Analysis
Estimates for the costs of each injury and for the
costs of the home visit program are given in Table 6.
The total cost of care for injuries was significantly
lower in the intervention group compared with the
nonintervention group ($13 481.57 compared with
$7028.25). This led to a cost per participant of $23.61
compared with $11.69. However, when allowing for
the costs of the home visit the incremental cost per
participant was $48.11. Given the reduction in the
injury rate in the intervention group the cost per
injury prevented is estimated to be $372.
DISCUSSION
This study, using a single home visit, was unable
to demonstrate effectiveness of an intervention
aimed at improving home safety modifications, but
was able to demonstrate a reduction in the rate of
injury related visits to the doctor. The potential
im-pact of this prevention strategy is substantial. For
each 12 homes visited, 1 injury visit to the doctor
would be prevented per year at an average
incre-mental cost of $372. Although this outcome looks
promising, the finding must be interpreted
cau-tiously.
The observed lack of adoption of the
recom-mended prevention may have been related to aspects
of the intervention that required action on the part of
the caregiver. The intervention, aimed primarily at
changing the environment (home) through the
pro-motion of a combination of passive and active
mea-sures, called for the simultaneous change of many
injury prevention behaviors. It is generally thought
that passive strategies, ie, those involving few
re-peated actions, are more effective than active
preven-tive strategies.
25The parental vigilance and
respon-sibility demanded by these more active measures are
notoriously difficult to motivate
26and it is possible
that the current program was not sufficient to
achieve this end.
The intervention itself may have been demanding,
making compliance difficult, although self-reports
suggest that the intervention group felt that they had
adopted safety precautions (62% and 23% reported
home safety modifications at 4 and 8 months,
respec-tively). However, actual home visit observations
found only 2 of 16 safety modifications favoring the
intervention (lowering of hot water temperature to
⬍
54° C and the presence of smoke detectors). This is
consistent with research indicating that easily
in-stalled safety devices are more likely to be used than
more difficult ones.
27A less demanding task (ie,
lowering hot water temperature) was adopted over
those safety measures that may require a greater
investment of time and energy (ie, keeping small
objects out of a child’s reach or ensuring that a bike
helmet is worn regularly). Finally, baseline
assess-ments indicated good awareness of injury risk and
preventability by parents in both groups that was
unaffected by the intervention. As such, it is likely
that families enrolled in the study were already
vig-ilant with respect to their children’s environment.
Although it is unlikely that the home visit had an
impact on the adoption of our home safety measures,
self-reports by the families suggest that they felt the
home visit was beneficial both in their perception of
TABLE 1. Participant Characteristics
All Patients (n⫽1172)
With Intervention
(n⫽601)
Without Intervention
(n⫽571)
PValue
Male-n(%) 696 (59) 352 (59) 344 (60) .56
Child’s age, y* 2 (1, 3) 2 (1, 3) 2 (1, 4) .79
Institution
Montreal Children’s Hospital 250 (21) 128 (21) 122 (21)
Hoˆpital Ste Justine 294 (25) 154 (26) 140 (25) .99
IWK-Grace Health Centre 173 (15) 88 (15) 85 (15)
Children’s Hospital of Eastern Ontario 300 (26) 152 (25) 148 (26) Winnipeg Children’s Hospital 155 (13) 79 (13) 76 (13) ED presentation†
Home injury,n(%) 387 (33) 193 (32) 194 (34)
Choking/asphyxiation 36 22 14
Poisoning 52 22 29
Burns and scalds 80 39 41
Falls 219 109 110
Other injuries,n(%) 389 (33) 206 (34) 183 (32)
Illnesses,n(%) 391 (34) 202 (34) 189 (34) .60
Socioeconomic status
Parent’s age, y‡ 33 (30, 37) 33 (30, 36) 33 (30, 37) .09 Age mother had first child* 27 (22, 30) 27 (23, 30) 27 (22, 30) .90 Parent’s minimum§ education*
(number of years)
13 (12, 16) 13 (12, 16) 13 (12, 16) .72
Number of siblings,n(%)
0 421 (36) 224 (37) 196 (34)
1 495 (42) 254 (42) 241 (42)
2 193 (16) 92 (16) 101 (18)
3 46 (4) 22 (4) 23 (4)
4⫹ 19 (2) 9 (1) 10 (2) .75
* Values are median (first and third quartiles.)
† Patients without a clear case-control status (N⫽5) were randomized and included in the analysis using an intent to treat principle. ‡ Average age of both parents.
§ Minimum education level from both parents.
TABLE 2. Injury Knowledge and Awareness
All Patients (n⫽1172)
With Intervention
(n⫽601)
Without Intervention
(n⫽571)
PValue
Injury knowledge,n(%)
Correctly identify injury as the leading cause of death in children younger than 8 years.
748 (73) 381 (73) 365 (73) .92
Injury awareness*
1) How often do you think injuries to children require hospital admission?†
6 (5, 7) 6 (5, 7) 6 (4, 7) .65
2) How preventable do you think most childhood injuries are?†
7 (6, 8) 7 (6, 8) 8 (7, 8) .63
3) How serious do you think most injuries are?†
5 (5, 7) 5 (5, 7) 5 (5, 7) .73
4) How much control do you think you have to decrease the risk of your child having an injury?†
7 (6, 8) 7 (6, 8) 7 (6, 8) .40
Injury history,n(%)
Have any of your children seen a doctor because of an injury in the year before the current incidence?
136 (12) 67 (13) 69 (14) .48
the adoption of home safety measures and the effect
on injury occurrence. Although it is possible that a
reporting bias accounted for the self-reported
differ-ences in injury rates, it is also likely that there is a
benefit of the home visit that we were unable to
demonstrate in this trial. The short visit (
⬍
1 hour)
may not have been sensitive enough to identify the
real change that resulted in the differential reduction
in injury occurrence. To address the issue of why the
intervention worked to decrease the rate of injury,
TABLE 3. Intervention Effectiveness Completers Only
(n⫽951)
Number of Evaluable
Patients
Baseline* % Change at Follow-up† Intervention Effect‡
P
Value§
With Intervention
(n⫽601)
Without Intervention
(n⫽567)
With Intervention
(n⫽482)
Without Intervention
(n⫽469)
Mean % Difference
(95% CI) Awareness
How often do you think injury to children require hospital admission?㛳
756 6 (5, 7) 6 (4, 7) 13.6 (6.4, 20.8) 15.2 (7.7, 22.6) ⫺1.6 (⫺11.6, 8.5) .76
How preventable do you think most children’s injuries are?㛳
792 7 (6, 8) 8 (7, 8) 7.3 (0.9, 13.7) 7.0 (0.6, 13.5) 0.3 (⫺8.5, 9.0) .95
How serious do you think most injuries are?㛳
786 5 (5, 7) 5 (5, 7) 11.6 (6.9, 16.4) 9.8 (5.0, 14.5) 1.9 (⫺4.7, 8.4) .58
How much control do you think you have to decrease the risk of your child having an injury?6㛳
790 7 (6, 8) 7 (6, 8) 3.1 (⫺1.6, 7.7) ⫺2.1 (⫺6.8, 2.6) 5.1 (⫺1.3, 11.5) .12
* Values are median (first and third quartiles).
† Least-square estimates and their 95% CIs derived from an analysis of variance with intervention, institution as independent predictors. There were no interaction between intervention and institution in any of the presented outcomes.
‡ Least-square estimates and their 95% CIs of the difference between the 2 groups: with prevention versus without prevention. § F-test of no intervention effect from the analysis of variance.
㛳Visual Analog Scale range from 0 –10 with higher value corresponding to better awareness. All percent changes were expressed as
changes relative to the baseline absolute values.
TABLE 4. Description of Injury Prevention Behaviours and Estimate of Treatment Effect Question
Number
Description Hazard Rate of Control Group
(%)
Treatment Effect (Intervention vs No Intervention)
OR (95% CI)
PValue
1 No small objects within child’s reach in the living room
19.7 1.02 (0.88, 1.18) .40
2 No matches and lighter within child’s reach in the living room
13.3 1.03 (0.85, 1.25) .40
3 No windows opened easily beyond 6 inches in the living room
50.7 1.08 (0.93, 1.25) .15
4 All household cleaning supplies are stored beyond child’s reach in the kitchen
55.6 1.04 (0.89, 1.22) .30
5 With child-resistant caps on bottles in the kitchen cupboards
49.6 0.99 (0.84, 1.16) .44
8 Hot tap water is not exceeding 54°C 46.5 1.31 (1.14, 1.50) ⬍.001 10 Smoke detectors on some or all levels 94.0 1.45 (0.94, 2.22) .05 10a All or some smoke detectors fully functional 84.0 1.01 (0.79, 1.30) .46
11 Fire extinguisher 49.5 0.81 (0.67, 0.97) .01
12 Gates at top and/or bottom of stairs 35.5 0.89 (0.71, 1.13) .17
14 Observed a baby walker 7.1 0.83 (0.49, 1.43) .25
15 Bedroom windows can not be opened beyond 6 inches
60.7 1.06 (0.92, 1.22) .22
17 No small objects within child’s reach in bedroom
16.7 0.98 (0.83, 1.16) .42
18 Bathroom cleaning supplies securely stored 55.6 0.90 (0.81, 1.19) .11 19 All or some bottles in the bathroom cupboards
have child-resistant caps
74.0 0.98 (0.81, 1.19) .42
20 Children wearing bike helmet some or all of the time
94.4 0.65 (0.31, 1.37) .13
without observed adoption of the specific prevention
strategies, we plan to contact the families to evaluate
the components of the intervention that they
per-ceived as worthwhile and those that were less
ben-eficial.
Injuries have enormous economic consequences
with an annual cost estimated at $8.7 billion in
Can-ada.
28Economic evaluation of health promotion
strategies is essential to identify interventions that
maximize health gain at the least cost to society. With
limited financial resources, prevention efforts should
focus on strategies that will yield the best benefit for
the investment. Some strategies, such as childhood
vaccines, have substantial savings in direct medical
costs for each dollar spent, whereas other strategies,
such as our intervention, may carry a net cost but still
give considerable value in return for the investment.
Previously, it has been estimated that on average,
each injury generates $4000 in direct and indirect
costs.
28Therefore, the direct care cost of $372 per
injury prevented is likely to be small in proportion to
the benefits gained by society. Also, it is important to
recognize that the cost does not include the
addi-tional direct and indirect costs of the injury (such as
the value of the time and foregone earnings of family
members who care for the injured child) and
there-fore underestimates the true economic burden to the
family and society.
Delivery of a home visit program should be as part
of a comprehensive local initiative that combines the
principle of focusing resources where they will do
the most good with that of intervening on several
risk factors simultaneously. In instances where injury
prevention initiatives have proven to be effective, the
population and/or the target behavior have been
specific and well-defined.
18,29 –33Also, successful
home visit programs are characterized by the
estab-lishment of a strong therapeutic relationship
devel-oped over frequent visits to address underlying
fac-tors associated with maternal and child health
outcomes.
34 –39Total costs of the intervention may be
reduced if the program were combined with other
home visit programs and targeted high-risk groups.
CONCLUSION
An intervention using a single home visit to
im-prove the extent to which families use passive and
active measures was insufficient to influence the
long-term adoption of home safety measures but was
effective to decrease the overall occurrence of
inju-ries. The home visit prevented 1 injury visit to the
doctor for each 12 families participating in the
pro-gram, and the cost of preventing these injuries was
small in proportion to the benefits gained by society.
Future programs should integrate with other home
visitation programs and target a few, well-focused,
evidence-based areas including the evaluation of
high-risk groups and the effect of repeated visits on
outcome.
ACKNOWLEDGMENT
This study was supported by a grant (6605– 4290-BF) from the National Health Research and Development Program, Health and Welfare Canada.
REFERENCES
1. Rivara FP, Grossman DC, Cummings P. Injury prevention. N Engl J Med. 1992;337:543–548
2. Baker SP, O’Neill E, Ginsburg MJ, Li G.The Injury Fact Book.Oxford, England: Oxford University Press; 1992
3. Towner E, Dowswell T, Jarvis S. Reducing Childhood Accidents: The Effectiveness of Health Promotion Interventions: A Literature Review. Lon-don, England: Health Education Authority; 1993
4. Hall JR, Reyes HM, Horvat M, Meller JL, Stein R. The mortality of childhood falls.J Trauma. 1989;29:1273–1275
5. Lehman D, Schonfeld N. Falls from heights: a problem not just in the Northeast.Pediatrics. 1993;92:121–124
6. Feldman KW, Simms RJ. Strangulation in childhood: epidemiology and clinical course.Pediatrics. 1980;65:1079 –1085
7. McLoughlin E, Crawford JD. Burns.Pediatr Clin North Am. 1985;32: 61–75
8. Steele P, Spyker DA. Poisonings.Pediatr Clin North Am. 1985;32:77– 86 9. Pless IB.The Scientific Basis of Childhood Injury Prevention: A Review of the
TABLE 5. Outcomes From Follow-Up Interview
Phone Follow-Up At 4 Months At 8 Months At 12 Months With
Intervention
Without Intervention
With Intervention
Without Intervention
With Intervention
Without Intervention
Rate Ratio* (95% CI) Since the previous visit, have
any of your children seen a doctor because of an injury?n(%)
38 (7) 56 (11) 47 (9) 54 (11) 24 (7) 30 (9) 0.75 (0.58, 0.96)
n⫽535 n⫽505 n⫽510 n⫽498 n⫽359 n⫽343
P⫽.05† P⫽.14† P⫽.34†
Since the previous visits, have you made any change in your home to make it safer?n(%)
322 (62) 112 (23)
n⫽519 n⫽492
* Ratio of rate of injury per person-year.
† Comparisons of injury frequency between intervention groups at each time interval using2test.
TABLE 6. Costs and Use of Resource Events Resource Event Unit Cost Rate per 100
Participants Control Intervention
Abrasion $36.40 3.85 1.83
Burn $91.71 0.00 0.33
Concussion $214.33 0.35 0.00 Cut/laceration $85.82 5.60 3.33 Dental injury $86.40 0.53 0.67 Foreign body $29.70 0.53 0.33 Fracture $196.68 4.20 1.83
Hematoma $36.40 2.28 0.50
Minor head injury $67.35 3.33 0.67 Poisoning $118.2 0.70 0.33
Sprain $87.75 2.45 2.00
Other injury $98.31 1.75 0.83
Medical Literature.London, England: Child Accident Prevention Trust; 1993
10. McLoughlin E, McGuire A. The causes, cost, and prevention of child-hood burn injuries.Am J Dis Child. 1990;144:677– 683
11. Wise PH, Kotelchuck M, Wilson ML, Mills M. Racial and socioeconomic disparities in childhood mortality in Boston.N Engl J Med. 1985;313: 360 –366
12. Murdock R, Eva J. Home accidents to children under 15 years: survey of 910 cases.Br Med J. 1974;3:103–106
13. Glik DC, Greaves PE, Kronenfeld JJ, Jackson KL. Safety hazards in households with young children.J Pediatr Psychol. 1993;18:115–131 14. Bass JL, Mehta KA, Ostrovsky M, et al. Educating parents about injury
prevention.Pediatr Clin North Am. 1985;32:233–242
15. Bass JL, Christoffel KK, Widome M, et al. Childhood injury prevention counseling in primary care settings: a critical review of the literature. Pediatrics. 1993;92:544 –550
16. Clamp M, Kendrick D. A randomized controlled trial of general prac-titioner safety advice for families with children under 5 years.Br Med J. 1998;316:1576 –1579
17. Olds DL, Kitzman H. Review of research on home visiting for pregnant women and parents of young children.Future Child. 1993;3:53–92 18. Roberts I, Kramer MS, Suissa S. Does home visiting prevent childhood
injury? A systematic review of randomized controlled trials.Br Med J. 1996;312:29 –33
19. Fleiss JL.Statistical Methods for Rates and Proportions.2nd ed.New York, NY: Wiley & Sons; 1981
20. Hasselblad V, McCrory DC. Meta-analytic tools for medical decision-making.Med Decis Making. 1995;15:81–96
21. Canadian Coordinating Office for Health Technology Assessment. Guidelines for the economic evaluation of pharmaceuticals: Canada.Int J Technol Assess Health Care. 1995;11:796 –797
22. Weinstein MC, Siegel JE, Gold MR, Kamlet MS, Russell LB. Recommen-dations of the Panel on cost-effectiveness in health and medicine.JAMA. 1996;276:1253–1258
23. Drummond MF, O’Brien B, Stoddart GL, Torrance GS.Methods for the Economic Evaluation of Health Care Programmes.Oxford, England: Oxford University Press; 1997
24. Bonnin A, Pless IB, Beaulne G, et al. Canadian collaborative study of injuries in childhood: basic results.Ambulatory Child Health. 1997;3:194
25. Haddon W. Strategy in preventive medicine: passive vs active ap-proaches to reducing human wastage.J Trauma. 1974;14:353–354 26. Baker SP. Determinants of injury and opportunities for intervention.
Am J Epidemiol. 1975;101:98 –102
27. Dershewitz RA. Will mothers use free household safety devices?Am J Dis Child. 1979;133:61– 64
28. Hygeia Group.The Economic Burden of Unintentional Injury in Canada. SMARTRISK; 1998
29. Green LW. Toward cost-benefit evaluations of health education: Some concepts, methods, and examples.Health Educ Monogr. 1974;2(suppl): 34 – 60
30. McIntire M, Angle C, Ekins B, Mofenson H, Rauber A, Schertz R. Trends in childhood poisoning: a collaborative study 1970, 1975, 1980.J Toxicol Clin Toxicol.1984;21:321–331
31. Pearn J, Nixon J. Prevention of childhood drowning accidents.Med J Australia. 1977;1:616 – 618
32. Wiseman HM, Guest K, Murray VS, Volans GN. Accidental poisoning in childhood: a multicentre survey, 1.Gen Epidemiol Hum Toxicol. 1987; 6:293–301
33. Jordan EA, Duggan AK, Hardy JB. Injuries in children of adolescent mothers: home safety education associated with decreased injury risk. Pediatrics. 1993;91:481– 487
34. Kitzman H, Olds DL, Henderson CR, et al. Effect of prenatal and infancy home visitation by nurses on pregnancy outcomes, childhood injuries, and repeated childbearing.JAMA. 1997;278:644 – 652 35. Larson CP. Efficacy of prenatal and postpartum home visits on child
health and development.Pediatrics. 1980;66:191–197
36. Olds DL, Henderson CR, Chamberlin R, Tatelbaum R. Preventing child abuse and neglect: a randomized trial of nurse home visitation. Pediat-rics. 1986;78:65–78
37. Olds DL, Henderson CR, Kitzman H. Does prenatal and infancy nurse home visitation have enduring effects on qualities of parental caregiv-ing and child health at 25 to 50 months of life.Pediatrics. 1994;93:89 –98 38. Olds DL, Henderson CR, Kitzman H, Cole R. Effects of prenatal and infancy nurse home visitation on surveillance of child maltreatment. Pediatrics. 1995;95:365–372
39. Olds DL, Kitzman H. Can home visitation improve the health of women and children at environmental risk?Pediatrics. 1990;86:108 –116
CONFIDENCE INTERVAL
Three statisticians took up duck hunting. The first fired, and his shot sailed 6
inches over the duck. Then the second fired, and his shot flew 6 inches below the
duck. At this, the third statistician excitedly exclaimed, “We got it!”
Paulos JA.A Mathematician Reads the Newspaper.New York, NY; Basic Books; 1995