SIMPLE BIOANALYTICAL QUANTIFICATION METHOD FOR SIMULTANEOUS ESTIMATION
OF SIMVASTATIN AND EZETIMIBE IN HUMAN PLASMA BY REVERSE-PHASE
HIGH-PERFORMANCE LIQUID CHROMATOGRAPHY TECHNIQUE
DYADE GK
1*, SAWANT RL
21Department of Postgraduate in Pharmacy, SVPM College of Pharmacy, Malegaon (BKII) Baramati, Pune, Maharashtra, India. 2Department
of Pharmaceutical Chemistry, Dr. Vithalrao Vikhe Patil Foundation’s College of Pharmacy, Ahmednagar, Savitribai Phule Pune University, Pune, Maharashtra, India. Email: [email protected]
Received: 17 October 2019, Revised and Accepted: 25 November 2019
ABSTRACT
Objective: A bioanalytical quantification method was developed for the simultaneous estimation of simvastatin (SIM) and ezetimibe (EZE) from the human plasma.
Methods: The technique was developed and equipped with reverse-phase (RP) high-performance liquid chromatography, using RP-C18 column with an ultraviolet detector. For the estimation of SIM and EZE, the mobile phase (acetonitrile:acetate buffer pH 4.0, pH adjusted with acetic acid) was pumped at a flow rate of 0.8 ml/min in the ratio of 85:15% v/v and the eluents were monitored at 234 nm. A calibration graph to study linearity of the SIM and EZE in biological matrix was carried out in the concentration range of 400–4000 ng/ml for both these drugs SIM and EZE.
Results: The developed method was validated according to the US FDA and European Medicines Agency guidelines for sensitivity, accuracy, precision, and stability. The obtained statistical data of validation were found to be within prescribed limit assures rigidity of the method. Both the drugs in combined form were estimated in human plasma by the proposed method.
Conclusions: The developed method is free from solid-phase extraction so it becomes simple and economical. The method is efficient for precise and accurate quantification of SIM and EZE in plasma and hence applied for bioequivalence, bioavailability study in real clinical samples.
Keywords: Ezetimibe, Simvastatin, Bioanalytical, Plasma, Reverse-phase high-performance liquid chromatography.
INTRODUCTION
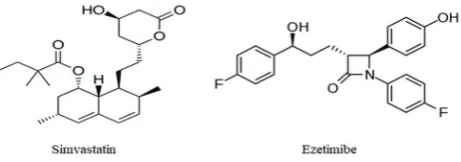
Simvastatin (SIM) chemically 2-2-dimethylbutanoic acid, 1,2,3,7,8, 8a-hexahydro,3,7-dimethyl-8-[2(tetrahydro-4 hydroxy-6-oxo-2 pyran-2-yl) ethyl]-1-naphthalenyl ester is an analog of lovastatin, in liver undergoes extensive metabolism to several open ring hydroxyl acids including the active ß-hydroxy acids. They are also highly bound to plasma proteins[1-4].
Ezetimibe (EZE) chemically (3R, 4 S)-1-(4-fluorophenyl)-3-((3s)-3-(4-fluorophenyl-3-hydroxypropyl)-4-(4-hydroxyphenyl)-2-azetidinone is an antihyperlipidemic agent that has usefulness in lowering cholesterol levels. It acts by decreasing cholesterol absorption in the intestine by blocking the absorption of the sterol at the brush border. Specifically, the ß-lactam binds to the Niemann-Pick C1-like 1 protein on the gastrointestinal tract that is responsible for cholesterol absorption. Although it may be used alone, it is marketed as a combination product with SIM[1-3].
Analytical, bioanalytical methods have been reported for the estimation of SIM alone or in combination with other antihypertensive agents or antihyperlipidemic drugs of pharmaceutical formulations. These include reverse-phase high-performance liquid chromatography( RP-HPLC) [5-9], bioanalytical HPLC method[10,11], bioanalytical LC– mass spectrometry (MS)/MS method [12,13], and solubility enhancement method [14].
Similarly, bioanalytical, analytical methods have been reported for the estimation of EZE alone or in combination with other antihypertensive agents or antihyperlipidemic drugs of pharmaceutical formulations. These include RP-HPLC method [15-18], forced
degradation study [19], other methods[20], bioanalytical method[21], ultraviolet (UV) spectroscopic method [22-24], chromatographic method [25], and degradant study method [26].
The drug SIM is official in BP [27]. EZE and SIM are official in IP [28]. The chemical structures of EZE and SIM are shown in Fig. 1.
Literature survey revealed that few bioanalytical methods have been reported for the estimation of EZE and SIM individually as well as in combination with other antihypertensive drugs. An LC–MS/MS bioanalytical method has been reported to quantify both these drugs in human Plasma, so tried to develop simple method to quantify both these drugs in human plasma avoiding solid-phase extraction. In the present piece of work, an attempt has been made to develop a suitable bioanalytical method for simultaneous estimation of EZE and SIM in human plasma. HPLC methods have been widely used for routine quality control assessment of drugs due to their accuracy, repeatability, selectively, sensitivity, and specificity. Bioanalytical methods must be validated before use; the proposed RP-HPLC with UV detection method was validated in accordance with the US FDA [29] and European Medicines Agency (EMEA) guidelines [30] by assessing its selectivity, accuracy, precision, and sensitivity.
MATERIALS AND METHODS Instrumentation
Analysis was performed with a Shimadzu (Japan) prominence chromatograph equipped with an LC-20AT solvent delivery system, a
universal loop injector (Rheodyne 7725) of injection capacity of 20 μl,
and an SPD-20A UV–visible detector set at 234 nm. The equipment was controlled by a PC work station with clarity software. Compounds © 2020 The Authors. Published by Innovare Academic Sciences Pvt Ltd. This is an open access article under the CC BY license (http://creativecommons. org/licenses/by/4. 0/) DOI: http://dx.doi.org/10.22159/ajpcr.2020.v13i1.36111
were separated on Phenomenex Luna C18 column (250 mm×4.6 mm
i.d., 5-μm particle size) under reversed-phase partition conditions. For
the estimation of EZE and SIM, the mobile phase was an 85:15 % (v/v) mixture of acetonitrile:acetate buffer pH 4.0 (pH 4.0±0.2, adjusted with acetic acid). The flow rate was kept at 0.8 ml/min and the run time was 11 min. For weighing of the drug and tablet, weighing balance Dhona 100 DS model no. 11526 and Afcoset ER-200A (accuracy ±0.1 mg make by The Bombay Burmah Trading Corpo. Ltd., Mumbai, Sr. No. 0412097) was utilized. For plasma separation from blood, programmable microcentrifuge (make by Bioera Life Sciences Pvt. Ltd.) Sr. No. LQK 236 A was utilized. For plasma-drug mixing, vortex mixer (make by Yorco Sales Pvt. Ltd.) was utilized.
In a method of bioanalysis, mobile phase and sample solutions were degassed by the use of a sonicator (Labman Scientific Instruments, Chennai, 1.8 l, Serial No. L 6732) and filtered through a 0.22 µm filter (Pall Corporation, Mumbai). The identity of the compounds was established by comparing the retention times of compounds in the mixed solution with those in standard solutions. Chromatography was performed in an ambient temperature maintained at 27±1°C. The UV spectrum of EZE and SIM for selecting the working wavelength of detection was taken using a Shimadzu-1700 a double beam UV–visible spectrophotometer (Shimadzu, Kyoto, Japan).
Reagents and chemicals
Pharmaceutically, pure samples of EZE and SIM were procured from Swapnroop Drugs and Pharma, Aurangabad. HPLC grade acetonitrile, water was obtained from Merck Life Sciences Pvt. Ltd. and acetic acid (HPLC grade) was obtained from Qualigens India Pvt. Ltd., Mumbai, India. Formulation Simvotin EZ (Sun Pharma) contains SIM 10 mg and EZE 10 mg which was procured from local market.
Collection of plasma
To obtain plasma, human blood sample was drawn from the antecubital fossa of the arm (skill of phlebotomy technique voluntarily provided by local pathological laboratory). Blood was centrifuged (microcentrifuge Bioera Life Sciences Pvt. Ltd.) at 4000 rpm for 10 min. The supernatant clear plasma was carefully recovered in clean and dry tube and stored in deep freezer until used.
Preparation of standard solutions of EZE and SIM
About 5 mg of each drug was accurately weighed separately and transferred to separate 10 ml volumetric flasks. The pure drugs were dissolved in mobile phase and the volume was made up to the mark, i.e., 10 ml with mobile phase, sonicated for 10 min in sonicator and both the solutions were marked as standard stock solution.
Linearity study of drugs in plasma matrix and plot of calibration curve
Two hundred microliters of fresh plasma were transferred into 5 ml
volumetric flask, added 1 ml of SIM of conc. 500 μg/ml, volume was
made to 5 ml with mobile phase and homogenized on vortex shaker for
10 min. Plasma drug admixture was filtered through 0.22 μ membrane
filter and aliquots of solution were further diluted to obtain conc. in
the range of 400–4000 ng/ml, degassed, and injected 20 μl into the
column to obtain chromatograph. This process was repeated without drug to obtain blank plasma and injected into the column to obtain chromatograph. Similarly, EZE was processed to obtain chromatography.
Chromatography of mixed standard solution simulated to marketed formulation was also obtained.
The obtained chromatography was read and the peak areas were measured. Peak areas were then plotted against their respective concentrations for EZE and SIM. Standard regression curve analysis was obtained by the use of Microsoft Office Excel software and correlation coefficient, slope, and standard deviation were obtained.
Preparation of sample in plasma matrix
Tablets were triturated to fine powder, tablet powder equivalent to 5 mg each of SIM and EZE was weighed and dissolved in mobile phase into 10 ml volumetric flask. Mixed well sonicated for 10 min and filtered through syringe filter to obtain clear tablet formulation solution. Two hundred microliters of fresh plasma were transferred into 5 ml
volumetric flask, added 1 ml of drug formulation containing 500 μg/ml
(as per label claim) each of SIM and EZE and volume was made to 5 ml with mobile phase and homogenized on vortex shaker (vortex mixer,
Yorco Sales Pvt. Ltd.) for 10 min. The sample was filtered through 0.22 μ
syringe filter and further diluted.
Before injecting the formulation solution, solution was filtered through syringe filter, degassed for 10 min in the sonicator, and injected
20 μl solutions in the column by Hamilton syringe. The obtained
chromatograph was read and the peak areas were measured to know the conc. of tablet solution.
Validation
Bioanalytical method validation is essential to ensure the acceptability of assay performance and the reliability of analytical results. Validation of bioanalytical method is described in the US FDA draft in September 2013, EMEA guidelines. The method was validated to obtain calibration curve, accuracy and precision, selectivity, and recovery.
Selectivity
The selectivity is the ability of an analytical method to differentiate and quantify the analyte in the presence of other components in the sample. Evidence was provided by testing blank plasma in the presence and absence of analyte, i.e., standard mixed drug solution. For selectivity study, mixed solution of EZE 2400 ng/ml and SIM 1600 ng/ml was used.
Accuracy and precision
The accuracy was determined by replicate analysis of samples containing known amounts of the analyte. Three QC samples having concentrations of 800 ng/ml, 1200 ng/ml, and 1600 ng/ml in the study range of concentration were prepared and to this known amount of analyte was added and added analyte was spiked by the proposed method.
Recovery experiments should be performed by comparing the analytical results for extracted samples at three concentrations (low, medium, and high) with unextracted standards that represent 100% recovery.
Precision was studied by preparing and measuring five determinations per concentration and three concentrations in the study range. The conc. in the study range of 800 ng/ml, 1600 ng/ml, and 2400 ng/ml was selected for both drugs precision study.
The precision determined at each concentration level should not exceed 15% of the coefficient of variation (CV) except for the lower limit of quantitation (LLOQ), where it should not exceed 20% of the CV.
Calibration curve
The US FDA guideline recommends that a calibration curve should be prepared in the same biological matrix as the sample in the intended study by spiking the matrix with known conc. of the analyte. To incorporate QCS in calibration study, the solutions one within 3 times the LLOQ (low QC), one in the middle (middle QC), and one approaching the high end (high QC) of the range, in the conc. range of 400–4000 ng/ml were selected for both drugs.
Analyte peak response should be identifiable, discrete, and reproducible, and the back calculated concentration should have precision that does not exceed 20% of the CV and accuracy within 20% of the nominal concentration. As an LLOQ solution, the conc. 400 ng/ml was obtained in plasma matrix and injected in the column.
Sensitivity
It is defined as the lowest analyte concentration (LLOQ) that can be measured with acceptable accuracy and precision.
Reproducibility
Reproducibility of the method is assessed by replicate measurements using the assay, including quality control samples.
RESULTS AND DISCUSSION
Bioanalytical method development and validation
The objective of the validation of bioanalytical assay is to demonstrate that it is suitable for its intended purpose. The results of pivotal non-clinical toxicokinetic/pharmacokinetic studies and of non-clinical trials, including comparative bioavailability/bioequivalence studies, are used to make regulatory decisions regarding the safety and efficacy of drug products. It is, therefore, critical that the bioanalytical method used is well characterized, appropriately validated and documented to ensure reliable data to support regulatory decisions.
EZE and SIM are used for the treatment of hypertension, as antihyperlipidemic. This research was focused on optimization of the
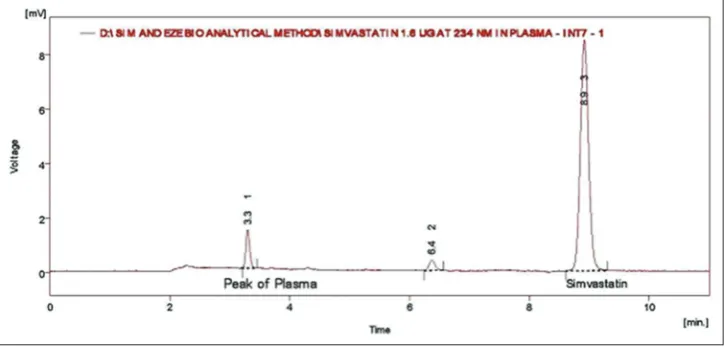
Fig. 2: Chromatograph of simvastatin in plasma (conc. 1600 ng/ml)
Fig. 3: Chromatograph of ezetimibe in plasma (conc. 800 ng/ml)
conditions for the simple and rapid as well as a low cost and effective isocratic bioanalytical method including a selection of the proper column and/or mobile phase to obtain satisfactory results.
To optimize mobile phase, chromatogram of both drugs was obtained in mobile phase acetonitrile:water in the ratio of 70:30% v/v, both drugs eluted but retention time of SIM was more than 15. Therefore, the proportion of acetonitrile was increased to 80% that resulted into elution of EZE within 10 min but SIM above 12 min. Mobile phase composition was changed to methanol:water in proportion 80:20% v/v, the result was improper resolution. Therefore, the mobile phase of acetonitrile:acetate buffer in composition 85:15% v/v (pH 4.0 adjusted with acetic acid) was selected for SIM and EZE. These changes resulted into elution of drugs with reasonable retention factor and symmetry in peak.
To determine the appropriate wavelength for simultaneous determination of EZE and SIM, solutions of these compounds in mobile phase were scanned in the range of 200–400 nm. From the overlaid UV spectra, suitable wavelength considered for monitoring the drugs was 234 nm (For SIM and EZE). It was observed that analytes absorbed well at 234 nm, and at this wavelength, there was no interference from the mobile phase or baseline disturbance, and it was, therefore, concluded that 234 nm was the most appropriate wavelength for analysis of drugs with suitable sensitivity.
The optimized mobile phase was selected for bioanalytical method and processed plasma matrix quality control solutions of SIM and EZE were chromatographed in mobile phase, as shown in Figs. 2 and 3. The chromatograph with well-resolved peak was obtained for EZE and SIM with retention time 3.917 and 8.93, respectively.
Fig. 5: Chromatograph of formulation
Table 1: Results for accuracy and precision
Parameter Concentration
LLOQ 400 ng/ml LQC 800 ng/ml MQC 1600 ng/ml HQC 2400 ng/ml
SIM EZE SIM EZE SIM EZE SIM EZE
Within batch n=5
Mean 384 402 816 814 1625 1563 2412 2416
% RSD 2.243 8.125 2.585 7.194 0.525 1.959 1.299 0.508
% RE -4.07 0.68 2.06 1.80 1.57 -2.26 0.51 0.67
% Nominal 95.93 100.67 102.06 101.80 101.57 97.73 100.51 100.67
LLOQ: Lower limit of quantitation, HQC: High QC, MQC: Middle QC, LQC: Low QC, SIM: Simvastatin, EZE: Ezetimibe, RSD: Relative standard deviation, RE: Relative error
Table 2: Results for recovery study
Level of study
(drug) Conc. of drug in sample (ng/ml) Conc. of added analyte (ng/ml) Conc. of analyte found (ng/ml) Recovery in % Mean recovery* (%)
LQC (SIM) 3200 800 786 98.25 96.50
815 101.875
715 89.375
MQC (EZE) 3200 1600 1540 96.25 98.53
1630 101.87
1560 97.51
*Mean of three. LQC: Low QC, MQC: Middle QC, EZE: Ezetimibe, SIM: Simvastatin
Method validation Selectivity for analyte
Evidence of the selectivity was provided by testing blank plasma in the presence and absence of analyte, i.e., standard mixed drug solution of conc. 2400 ng/ml and SIM 1600 ng/ml, as shown in Fig. 4.
Accuracy and precision
The accuracy and precision within the batch were calculated and results are tabulated in Table 1. Precision was measured as the percentage of relative standard deviation (%RSD) and accuracy was determined as percentage relative error (% RE). The within batch %RSD was found in the range of 0.525–2.585 for SIM and 0.508–8.125 for EZE at all conc.
levels. The data of % RE were varied between −4.07 and 2.06 for SIM and −2.26 and 1.80 for EZE at all conc. levels. All the obtained values
were within acceptable limit as per guidelines.
Recovery of both the drugs was calculated by comparing the peak area of analyte spiked along with plasma sample with that obtained from plasma sample at same conc. for QC sample containing 800 ng/ml and 1600 ng/ml of SIM and EZE. Results for recovery are given in Table 2.
Reproducibility
Reproducibility of the method is assessed by replicate measurements using the assay, including quality control samples, as shown in Fig. 5.
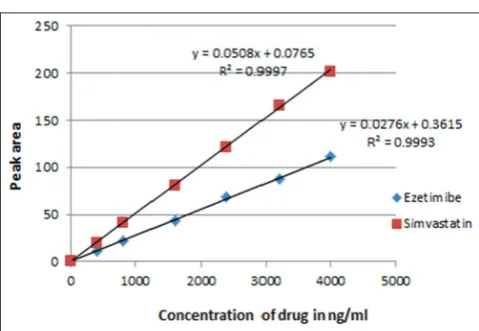
Calibration curve
As per recommendations of the US FDA guideline, a calibration curve for both the drugs was established in the range of 400–4000 ng/ml by linear regression analysis (Fig. 6). The regression equation obtained for standard curve was y=0.0508x+0.0765 with coefficient of regression (R2) 0.9997 for SIM and y=0.0276x+0.3615 with coefficient of regression (R2) 0.9993 for EZE.
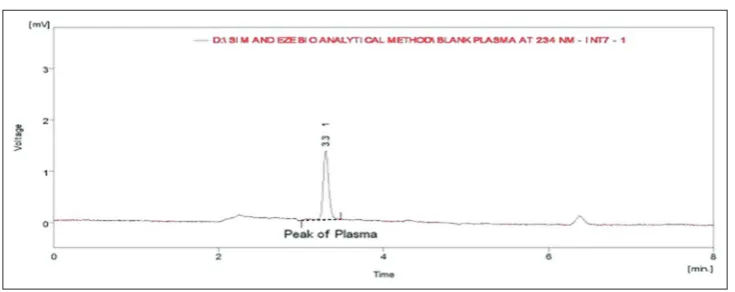
Selectivity for blank plasma
Blank plasma was tested in the absence of analyte and obtained chromatography (Fig. 7) shows no interference of plasma matrix in quantification of both the analytes. Moreover, the response of plasma was considerable as stated in guidelines.
CONCLUSIONS
Both the drugs were estimated from the plasma, and any interference of the plasma and matrix effect was not observed during the development of simple isocratic RP-HPLC bioanalytical method with UV detection. The method can be applied for relative bioavailability and bioequivalence study of the drugs or/and dosage form. The method is free from separation techniques such as solid-phase extraction or liquid-liquid extraction, thus become the simplest technique. The method was validated for accuracy, precision, specificity, and linearity. The method also uses a solvent system with the same composition as the mobile phase for dissolving and extracting drugs from the matrices, thus minimizing noise. Thus, the proposed method is sensitive,
selective, requires a simple sample preparation procedure. The run time is relatively short (11 min), which enables rapid quantification of many samples. Moreover, this bioanalytical approach should represent a good procedure of EZE and SIM determination in plasma.
ACKNOWLEDGMENTS
The authors are thankful to Dr. P.Y. Pawar, Principal, Dr. Vithalrao Vikhe Patil Foundation’s College of Pharmacy Vilad, Ahmednagar, for providing the necessary facilities to carry out the research work. Furthermore, authors are thankful to Swapnroop Drugs and Pharma, Aurangabad, for supplying the samples of EZE and SIM and Mangal Patho Lab for assisting in phlebotomy technique.
AUTHORS’ CONTRIBUTIONS
Both authors have contributed equally.
CONFLICTS OF INTEREST
The authors declared that they have no conflicts of interest.
REFERENCES
1. Morrison RD, Sullivan G. The Merck Index. An Encyclopaedia of Chemicals, Drugs and Biological. 15th ed. Cambridge, United
Kingdom: The Royal Society of Chemistry; 2013. p. 720, 1587. 2. Beale JM Jr., Block JH. Wilson and Gisvold’s Textbook of Organic
Medicinal and Pharmaceutical Chemistry. 12th ed. New Delhi: Wolters
Kluwer (India) Pvt. Ltd.; 2011. p. 652-4.
3. Brayfield A. Martindale: The Complete Drug Reference. 38th ed.
London: Pharmaceutical Press; 2014. p. 1379, 1489.
4. Lemke TL, Williams DA, Roche VF, Zito SW. Foye’s Principles of Medicinal Chemistry. 7th ed. New Delhi: Wolters Kluwer (India) Pvt.
Ltd.; 2013. p. 827.
5. Dixit RP, Barhate CR, Padhye SG, Viswanathan CL, Nagarsenker MS. Stability indicating RP-HPLC method for simultaneous determination of simvastatin and ezetimibe from tablet dosage form. Indian J Pharm Sci 2010;72:204-10.
6. Sahoo NK, Sahu M, Rao PS, Vineela RS, Devi JN, Rani NS, et al. Validation of assay indicating method development of simvastatin in bulk and its tablet dosage form by RP-HPLC. J Appl Pharm Sci 2014;4:117-22.
7. Ali H, Nazzal S. Development and validation of a reversed-phase HPLC method for the simultaneous analysis of simvastatin and tocotrienols in combined dosage forms. J Pharm Biomed Anal 2009;49:950-6. 8. Nalaiya J, Sagineedu SR, Rajasingam R, Kassim Z, Pichika MR. A
stability-indicating RP-HPLC method for simultaneous determination of simvastatin and niacin in a combined dosage form. Int J Pharm Pharm Sci 2014;7:262-8.
9. Novakova L, Satinsky D, Solich P. HPLC methods for the determination of simvastatin and atorvastatin. TrAC Trends Analyt Chem 2008;27:352-67.
10. Alakhali KM. Validation method for measuring simvastatin in human plasma by HPLC-UV and its application in study simvastatin stability in plasma and working solution. Asian J Pharm Clin Res 2014;7:131-3. 11. Lawson G, Cocks E, Tanna S. Bisoprolol, ramipril and simvastatin
determination in dried blood spot samples using LC-HRMS for assessing medication adherence. J Pharm Biomed Anal 2013;81:99-107. 12. Barrett B, Huclová J, Borek-Dohalský V, Nemec B, Jelínek I. Validated HPLC-MS/MS method for simultaneous determination of simvastatin and simvastatin hydroxy acid in human plasma. J Pharm Biomed Anal 2006;41:517-26.
13. Selvan PS, Pal TK. Chromatography-tandem mass spectrometry method for the simultaneous quantitation of metoprolol succinate and simvastatin in human plasma. J Pharm Biomed Anal 2009;49:780-5. 14. Mishra R. Spherical crystallization a novel approach for solubility
and dissolution enhancement of simvastatin. Asian J Pharm Clin Res 2016;9:65-72.
15. Virani P, Sojitra R, Raj H, Jain V. Chromatographic method for irbesartan and its combination with other drug. J Crit Rev 2015;2:7-11. 16. Hefnawy M, Al-Omar M, Julkhuf S. Rapid and sensitive simultaneous
determination of ezetimibe and simvastatin from their combination drug products by monolithic silica high-performance liquid chromatographic column. J Pharm Biomed Anal 2009;50:527-34.
17. Raul SK, Aravelli RB, Jhansi D. RP-HPLC method development and validation for the simultaneous estimation of atorvastatin and ezetimibe in pharmaceutical dosage form. Asian J Pharm Clin Res 2015;8:178-81. 18. Bolla N, Atla SR. A validated stability indicating RP-HPLC method for the simultaneous determintion of atorvastatin calcium and ezetimibe hydrochloride in bulk and tablet dosage form. Int J Pharm Pharm Sci 2016;8:370-7.
19. Yulianita R, Sopyan I, Muchtaridi M. Forced degradation study of statins: A review. Int J Appl Pharm 2018;10:38-42.
20. Verma N. Introduction to hyperlipidemia and its treatment: A review. Int J Curr Pharm Res 2016;9:6-14.
21. Karanam SR, Katakam P, Chandu BR, Hwisa NT, Adiki SK. Simultaneous determination of ezetimibe and simvastatin in rat plasma
by stable-isotope dilution LC-ESI-MS/MS and its application to a pharmacokinetic study. J Pharm Anal 2014;4:286-94.
22. Abdelwahab NS, El-Zeiny BA, Tohamy SI. Two spectrophotometric methods for simultaneous determination of some antihyperlipidemic drugs. J Pharm Anal 2012;2:279-84.
23. Sharma M, Mhaske DV, Mahadik M, Kadam SS, Dhaneshwar SR. UV and three derivative spectrophotometric methods for determination of ezetimibe in tablet formulation. Indian J Pharm Sci 2008;70:258-60. 24. Belal TS, Daabees HG, Abdel-Khalek MM, Mahrous MS, Khamis MM.
New simple spectrophotometric method for determination of the binary mixtures (atorvastatin calcium and ezetimibe; candesartan cilexetil and hydrochlorothiazide) in tablets. J Pharm Anal 2013;3:118-26.
25. Artici E, Karliga B. Identification, synthesis and characterization of process related desfluoro impurity of ezetimibe and HPLC method validations. J Pharm Anal 2015;5:356-70.
26. Santa Z, Koti J, Szoke K, Vukics K, Szantay C Jr. Structure of the major degradant of ezetimibe. J Pharm Biomed Anal 2012;58:125-9.
27. Medicines and Healthcare Products Regulatory Agency. British Pharmacopoeia. London: Medicines and Healthcare Products Regulatory Agency; 2015. p. 812.
28. Government of India, Ministry of Health and Family Welfare. Indian
Pharmacopoeia. 7th ed. Ghaziabad: The Indian Pharmacopoeia
Commission; 2014. p. 1727, 2684, 2730.
29. Center for Drug Evaluation and Research. Guidance for Industry. Bio Analytical Method Validation. United States Department of Health and Human Services. Rockville: Food and Drug Administration. Center for Drug Evaluation and Research. Center for Biologics Evaluation and Research; 2013.