© 2015, IRJET.NET- All Rights Reserved Page 2049
An Experimental Study of Warm Mix Application on Dense Bituminous
Macadam
Preeti Banger
1, km Monu
2, A.K Duggal
31 M.E Scholar, Civil Engineering Department, National Institute of Technical Teachers Training and Research/ Punjab University, Chandigarh
2. M.E Scholar, Civil Engineering Department, National Institute of Technical Teachers Training and Research/ Punjab University, Chandigarh
3. Associate Professor, Civil Engineering Department, National Institute of Technical Teachers Training and Research, Chandigarh
Abstract -
Warm Mix Asphalt (WMA) technology is technology in which bituminous mixes are prepared at temperature 20-30˚C lower than as in Hot Mix Asphalt (HMA). In this study Marshall samples of both WMA and HMA with different binder content are prepared and tested using 1% of Zeolite. It is seen from the certain research papers and studies that gyratory compactor is not used for WMA because it is insensitive to the compaction temperature. Marshall Hammer and vibratory compactor give more consistent results than gyratory compactor. We have taken four different percentages of bitumen with 3 samples at each bitumen percent. Total 48 samples were prepared. Test results showed that there is a considerable increase in Marshall Stability Value and optimum bitumen content remains unchanged for WMA. It is also seen that percent VMA, Flow value increase whereas density, VFB, Vb, Va decreases.Keywords- Zeolite, Marshall Hammer, vibratory
compactor, VMA, VFB, Vb, Va, Flow value.
1.INTRODUCTION
:
WMA is developed by adding chemicals such as Zeolites, asphalt emulsions waxes and water to the binder before mixing. According to a survey of US asphalt producers in 2012 about 25% of asphalt produced is Warm mix. It is seen that after adding certain chemicals or external agents mixing and compaction temperatures are reduce by 20-30◦C whereas workability increases. Benefits of using Warm Mix Asphalt technology are listed below:
(i) reduced environmental hazards (ii) lower emissions (iii) lower production of Green House gases (iv) lower fuel consumption (v) lower health hazard (vi)further, the additional cost of the chemical may be compensated by savings in fuel consumption and other indirect benefits (vii) extended construction time (viii) lower time consumption (upto 20-25% less time required) (ix)
proximity to the site (x) similar or better performance (xi) reduced binder ageing
2. EXPERIMENTAL
2.1
Material used
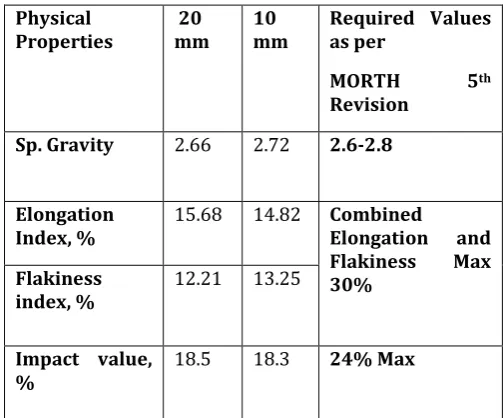
The different materials used in the study are aggregates, conventional and modified binders. Aggregates available in a Hot Mix Plant near Chandigarh were selected. The proportion of aggregates of size 19mm, 10mm, 6.7mm, stone dust are 34%, 19%, 16% and 31% respectively. The types of binder used in the study are VG 30 as conventional binder and CRMB 55 as modified binder.
Specific gravities of 20mm, 13.5mm, 6.7mm and stone dust are 2.66, 2.72, 2.62, and 2.65 respectively.
Table 1.1 Properties of Aggregates
Physical
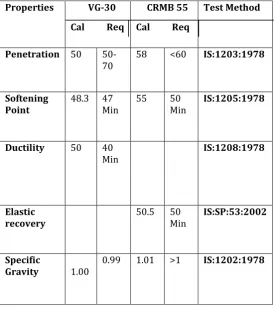
Bitumen: Two different types of binders have been used
© 2015, IRJET.NET- All Rights Reserved Page 2050 Highway) Table 500-17. The different sizes of aggregates, i.e 20mm, 10mm, 6.7mm and stone dust are selected and the sieve analysis is done to obtain the individual gradation of these aggregates. Grading 2 is used. Then by trial and error method by using Microsoft excel, the desired gradation for DBM as shown in table 4-3. Plain bitumen of grade VG-30 and modifier CRMB 55 used for the study and the physical property of the aggregate should meet the requirement as given in MORTH 5th revision
Table 4-3(Mix Design)
Penetration 50
© 2015, IRJET.NET- All Rights Reserved Page 2051
4.1) Experimental Results of different parameters of Marshall Stability Test for CRMB 55
TABLE 4-4
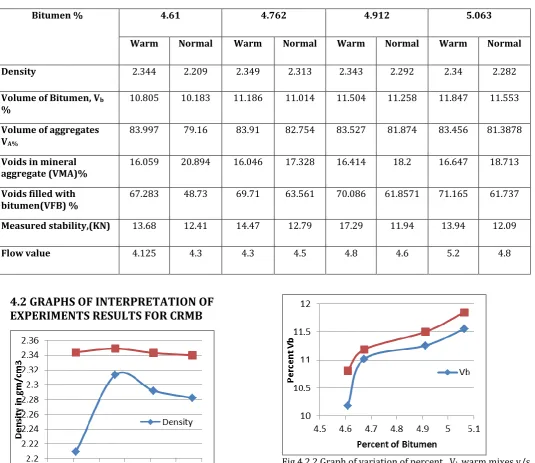
4.2 GRAPHS OF INTERPRETATION OF
EXPERIMENTS RESULTS FOR CRMB
Fig,4.2.1 Graph of variation of densities w.r.t. bitumen
NOTE- Densities of warm mixes was observed to be increased as compared to hot mixes i.e. from 2.344 to 2.209, 2.349 to 2.313, 2.343 to 2.292 and 2.34 to 2.282 at binder content 4.61, 4.762, 4.912 and 5.063 respectively.
Fig 4.2.2 Graph of variation of percent Vb warm mixes v/s hot mixes
NOTE- - Vb percent was observed to be increased in warm mixes in comparison to hot mixes i.e. from 10.183 to 10.805, 11.186 to 11.01, 11.258 to 11.504 and 11.553 to 11.847 at binder content 4.61 , 4.762 , 4.912 and 5.063 respectively.
Bitumen % 4.61 4.762 4.912 5.063
Warm Normal Warm Normal Warm Normal Warm Normal
Density 2.344 2.209 2.349 2.313 2.343 2.292 2.34 2.282
Volume of Bitumen, Vb
%
10.805 10.183 11.186 11.014 11.504 11.258 11.847 11.553
Volume of aggregates VA%
83.997 79.16 83.91 82.754 83.527 81.874 83.456 81.3878
Voids in mineral aggregate (VMA)%
16.059 20.894 16.046 17.328 16.414 18.2 16.647 18.713
Voids filled with bitumen(VFB) %
67.283 48.73 69.71 63.561 70.086 61.8571 71.165 61.737
Measured stability,(KN) 13.68 12.41 14.47 12.79 17.29 11.94 13.94 12.09
© 2015, IRJET.NET- All Rights Reserved Page 2052 Fig 4.2.3 Graph of variation of percent V a warm mixes
v/s hot mixes
NOTE- - VA percent was observed to be increased in warm mixes in comparison to hot mixes i.e. from 79.16 to 83.997, 82.754 to 83.91, 81.874 to 83.527 and 81.3878 to 83.456 at binder content 4.61 , 4.762 , 4.912 and 5.063 respectively.
4.2.4 Graphs of variation of percent VMA of warm mixes v/s hot mixes
NOTE- VMA percent was observed to be decreased in warm mixes in comparison to hot mixes i.e. 20.894 to 16.059, 17.328 to 16.046 , 18.2 to 16.414 and 18.713 to 16.647 at binder content 4.61 , 4.762 , 4.912 and 5.063 respectively
Fig 4.2.5 variation of % VFB of warm mixes v/s hot mixes w.r.t bitumen
NOTE- VFB percent in warm mixes was observed to be higher as in hot mixes i.e. from 48.73 to 67.283, 63.561 to 69.71 , 61.8571 to 70.086 and 61.737 to 71.165 at 4.61 , 4.762, 4.912 and 5.063 bitumen percentages respectively
Fig. 4.2.6 Graph of variation of Marshall Stability w.r.t. bitumen content
NOTE- Marshall Stability was observed to be increased in warm mixes as compared to hot mixes i.e. from 12.41 to 13.68, 12.79 to 14.45, 11.94 to 17.29 and 13.94 to 12.09 at binder content 4.61, 4.762, 4.912 and 5.063 respectively.
Fig 4.2.7 (c) Graph of variation of flow w.r.t. bitumen
NOTE- Flow of warm mixes seems to be decreased from 4.3 to 4.125 and from 4.5 to 4.3 at bitumen content of 4.61 and 4.762 respectively afterward it starts increasing from 4.6 to 4.8 and from 4.8 to 5.2 at 4.912 and 5.063
percentage of bitumen respectively 0
5 10 15 20
4.4 4.6 4.8 5 5.2
M
ar
sha
ll
St
abi
lit
y
in
K
g
© 2015, IRJET.NET- All Rights Reserved Page 2053 EXPERIMENTAL RESULTS OF VG-30
4.4 ) GRAPHS OF INTERPRETATION OF
EXPERIMENTS RESULTS FOR VG-30
Bitumen % 4.61 4.762 4.912 5.063
Warm Normal Warm Normal Warm Normal Warm Normal
Density 2.3479 2.343 2.3755 2.3685 2.3505 2.3465 2.3395 2.3235
Volume of Bitumen, Vb %
10.283 10.8 11.312 11.278 11.545 11.526 11.844 11.763
Volume of aggregates VA%
84.137 83.962 84.991 96.732 83.964 71.417 83.438 82.867
Voids in mineral aggregate (VMA)%
15.843 16.01 15 15.231 15.996 16.139 16.548 17.119
Voids filled with bitumen(VFB) %
68.314 67.457 75.5 74.04 72.714 71.417 71.573 68.71
Measured stability,(KN)
12.17 11.29 14.38 12.18 12.53 15.17 11.25 14.35
Flow value 3.3 3.95 3.5 4.6 3.7 4.95 4.2 4.95
2.32
2.33
2.34
2.35
2.36
2.37
2.38
4.4
4.6
4.8
5
5.2
D
e
n
si
ty
Percent of bitumen
Densit
© 2015, IRJET.NET- All Rights Reserved Page 2054
Fig 4.4.2 Graph of variation of % Vb of warm mixes v/s hot mixes
NOTE- percent Vb was observed to be slightly higher in warm mixes than hot mixes i.e. 10.8 to 10.823, 11.278 to 11.312, 11.328 to 11.545 and 11.763 to11.844 at 4.61, 4.762, 4.912 and 5.063 respectively
Fig 4.4.4 Graphs of variation of % VMA of warm mixes v/s hot mixes w.r.t bitumen percent
NOTE – Percent VMA was found to be decrease in warm mixes as compared to hot mixes i.e. from 16.01 to 15.843, 15.231 to 15 16.139 to 15.996 and 17.119 to 16.548 at binder content 4.61, 4.762, 4.912 and 5.063 respectively.
Fig4.4.5 (i) Graphs of variation of % VFB of warm mixes v/s hot mixes
NOTE- Percent VFB was observed to be increased in warm mixes in comparison to hot mix i.e. from 67.457 to 68.314, 74.04 to 75.5, 71.417 to 72.714 and 68.71 to 71 .573 at binder content 4.61, 4.762, 4.912 and 5.063 respectively
Fig 4.4.6 (g) Graphs of variation Marshall stability of warm mixes v/s hot mixes
© 2015, IRJET.NET- All Rights Reserved Page 2055
Fig 4.4.3Graph of Variation of percent Va of warm mixes v/s hot mixes
NOTE- Flow of warm mixes was observed to be decreased as compared to hot mixes i.e. from 3.3 to 3.95, 3.5 to 4.6, 3.7 to 4.7, 4.2 to 4.95 at binder content 4.61, 4.762, 4.912 and 5.0
CONCLUSIONS:
Following are the outcomes of the experiment conducted for comparison of WMA mixes and HMA mixes:
Density of Warm Mix Asphalt samples is higher as compared to Hot Mix Asphalt.
Optimum binder content for Normal Mixes is found out to be 4.672 by comparing certain specifications from MORTH 5th revision it is found out that Optimum Binder Content for Warm Mixes is same as that of Normal samples. It clearly indicates that there is no change in Optimum Binder Content for Warm Mixes.
There is a considerable increase in Marshall Stability value of Warm Mix as compared to Hot Mix Asphalt in CRMB but it firstly increases and than decreases in VG30. It concludes that Warm Mix sample have higher strength than Hot Mix samples.
There is noticeable increase in percent VFB in warm mixes as compared to hot mixes in both types of bitumen.
Percent VMA decreases in warm mixes as compared to hot mixes in both type of bitumen.
Volume of bitumen Vb was observed to be increases in warm mixes as compared with hot mixes.
Volume of aggregate was observed to be increased in CRMB 55 and in VG 30 it was observed that firstly it starts increasing than its value falls down.
Overall from this study we have concluded that in spite of being expensive WMA have good performances than HMA.
3.95
4.6 4.95 4.95
0 1 2 3 4 5 6
4.5 5 5.5
Fl
ow
i
n
m
m
Percent of Bitumen Flow
© 2015, IRJET.NET- All Rights Reserved Page 2056
6) References:
i) Silva M.R.D. Hugo, Oliveira R.M. Joel, Ferreira I.G. Claudia et all; “Assessment of the Performance Of Warm Mix Asphalt in Road Pavements” International Journal of Pavement Research And Technology, May 2010, Vol. 3, No. 3, pp 119-127.
ii) Xiao Feipeng, Zhao Wenbin, Gandhi Tejash, Amirkhanian N. Serji; “Influence of Antistripping Additives on Moisture Susceptibility of Warm Mix Asphalt Mixtures” Journals Of materials In Civil Engineering, October 2010, Vol. 22, No. 10, pp 1047-1055.
iii).Cooper B. Samuel, Mohammad N. Louay, Elseifi A. Mostafa; “Laboratory Performance Characteristics of Sulfur-Modified Warm-Mix Asphalt” Journal of Materials in Civil Engineering, September 2011, Vol. 23, No. 9, pp 1338-1345.
iv). Xiao Feipeng, Punith V. S., Putman Bedley, Amirkhanian N. Serji; “Utilization of Foaming Technology in Warm-Mix-Asphalt Mixtures Containing Moist Aggregates” Journal Of Materials In Civil Engineering, Sepetmber 2011, Vol. 23, No 9, pp 1328-1337.
v).Liu juanyu, Saboundjian Stephan, Li Peng, Connor Billy, Brunette Bruce; “Laboratory Evaluation of Sasobit-Modified Warm-Mix Asphalt for Alaskan Conditions” Journal of Materials in Civil Engineering, November 2011, Vol. 23, No. 11, pp 1498-1505.
vi). Liu J, Li Peng; “Low Temperature Performance of Sasobit-Modified Warm-Mix Asphalt” Journals of Materials in Civil Engineering, January 2012, Vol. 24, No. 1, pp 57-63.
vii). Kim Hakseo, Lee Soon-Jae, Amirkhanian N. Serji; “Influence of Warm Mix Additives on PMA Mixture Properties” Journal of Transportation Engineering, August 2012, Vol. 138, No. 8, pp 991-997.
viii). Sargand Shad et all;“Field Evaluation of Warm-Mix Asphalt Technologies” Journals of Materials in Civil Engineering, November 2012, pp 1343-1349.
ix). HasanZiari, Hamid Behbahani, Amir Izadi and Danial Nasr; “Long term Performance of warm mix asphalt vs hot mix asphalt” Journal of Central South University (2013), pp 256-266.
x).Lugo Alvarez Eduardo Allex, Pimienta Aaron L.A. et all; “Laboratory Evaluation of Compactiblity and Performance of Warm-Mix Asphalt” 2013 Revista EIA, Vol. 10, No. 19, pp 111-121.
xi).Wurst E. James and Putman J. Bradley; “Laboratory Evaluation of Warm-Mix Open Graded Friction Course Mixtures” Journal of Materials in Civil Engineering, March 2013, Vol. 25, No. 3, pp 403-410
xii).Chang-fa Al, Boa-Xian Ll et all; “Study of Strength Forming Mechanism and Influencing Factors of Half Warm-Mix Asphalt” Journals of Highway and Transportation Research and Development (2014) Vol. 8, No. 3, pp 1-6.
xiii).Ali Ayman, Abbas Ala, Nazzal Munir, Alhasan Ahmad, Roy Arjun, Powers David; “Workability Evaluation of Foamed Warm-Mix Asphalt” Journals Of Materials In Civil Engineering, June 2014, Vol. 26, No. 6.
xiv) MalladiHaritha, Ayyala Dinesh, Tayebali A. Akhtarhusein, Khosla Paul N; “Laboratory Evaluation of Warm-Mix Asphalt Mixtures for Moisture and Rutting Susceptibility” Journals Of Materials In Civil Engineering, August 2014.
xv).KokVuralBaha and Akpolat Mustafa; “Effects of Using Sasobit and SBS on the Engineering Properties of Bitumen and Stone Mastic Asphalt” Journal of Materials In Civil Engineering, 2015.