Sei
s
mic vertical array analy
s
i
s
of the velocity
s
tructure and pha
s
e
decompo
s
ition during after
s
hock
s
of the 2007 Chuet
s
u-oki
earthquake
Kunikazu Yoshida
Active Fault Research Center, National Institute of Advanced Industrial Science and Technology, Tsukuba, Ibaraki 305-8567, Japan
(Received November 30, 2007; Revised January 21, 2008; Accepted January 30, 2008; Online published November 18, 2008)
A velocity profile derived fromPS-logging was examined using themainshock and aftershock records from
KK5 and KSH seismic vertical arrays in the Kashiwazaki-Kariwa nuclear power plant, which is located on the focal region. A seismic phase decomposition analysismethod was applied to aftershock vertical array records. Peak frequencies of spectral ratios of the aftershock records fromthe KSH array between various depths were slightly different fromthose of theoretical transfer functions. A comparison of observed and theoreticalS-wave travel times at various depths indicated that travel times for themainshockmeasured by pickingS-wave arrival times were identical to the theoretical travel times calculated fromthePS-logging profile, although travel times for the aftershocks were different fromthe theoretical travel times. The decomposition analysis of seismic vertical array records fromKK5 array for a small aftershock shows that a clear wave packet of surface waves follows just after the directS-wave arrival. In contrast, a decomposition analysis of the KSH array records show that a wave packet of surface waves are not clearly discernable.
Key words:The 2007 Chuetsu-oki earthquake, seismic vertical array, site effect, non-linear soil response, seismic phase decomposition.
1.
Introduction
The 2007 Chuetsu-oki earthquake (MJMA6.8) that
oc-curred at 10:13 on 16 July 2007 (JST) caused strong shaking in Kashiwazaki area. A strong-motion seismograph operat-ing in a free field near the No. 5 plant of the Kashiwazaki-Kariwa nuclear power plant (Tokyo Electric Power Co.) recorded a peak horizontal acceleration of 1223 cm/s2.
Two other seismographs located within 2 km of the No. 5 plant recorded considerably different waveforms during themainshock. It is important to try to identify the factors that caused the differences between groundmotions at these sites.
Seismic vertical arrays in the power plant recorded ground motions during the mainshock and some after-shocks. Most studies on vertical array records focus on the
S-wave response based on the spectral ratio of surface to borehole records (e.g., Archuleta and Steidl, 1998). How-ever, a record of groundmotion contains both S- and sur-face waves. It is important to separateS-waves from sur-face waves quantitatively in order to evaluate site effects, for example, an estimation of S H-wave soil responses by using observed records.
Yoshida and Sasatani (2006, 2008) have proposed a new seismic phase decompositionmethod using seismic verti-cal array records. Thismethod decomposes body (P- and
Copyright cThe Society of Geomagnetismand Earth, Planetary and Space Sci-ences (SGEPSS); The Seismological Society of Japan; The Volcanological Society of Japan; The Geodetic Society of Japan; The Japanese Society for Planetary Sci-ences; TERRAPUB.
S-waves) and surface wave time histories fromvertical ar-ray seismograms using transfer functions theoretically cal-culated fromwell-investigated velocity structure.
In this article, I analyse the aftershock records from
seis-mic vertical arrays in the power plant, using the seismic phase decompositionmethod. In particular I pay attention to the validity of the velocity structures before the decom -position analysis.
2.
Site De
s
cription and Data Set
Three vertical arrays are deployed in the Kashiwazaki-Kariwa nuclear power plant, around the focal area of the 2007 Chuetsu-oki earthquake (Fig. 1). Data fromtwo ar-rays, KK5 and KSH, were selected in this study because of their high quality. The KK5 array consists of surface and four borehole sensors (Fig. 2). At this array the S-wave velocity rapidly increases from160 m/s at the surface to 500m/s at the depth of 36min the Yasuda formation (late Pleistocene), and it gently increases to 870m/s at 312m
in the Nishiyama (Pliocene to early Pleistocene) and Shi-iya (Miocene to Pliocene) formations. The KSH array is located on a coastal sand dune (Arahama sand dune) that is about 70 mhigh, 10 kmlong, 2 km wide and striking about N20◦E. The geologic column at KSH shows that the Arahama dune sand bed (Holocene, sand deposits in Fig. 2) overlies the Banjin sand bed (late Pleistocene) which in turn overlies the Yasuda formation. S-wave velocities of these sand beds remained between 300–350m/s to the depth of 83m. This array consists of surface and three borehole sen-sors.
MS
Fig. 1. Map showing the location of the seismic vertical arrays (solid square) and the epicenters of the events (open circles) used in this study. The elevation is shown with 50-mcontours.
0
Fig. 2. Array configurations, geologic columns, and velocity structures at the vertical array seismic stations operated by the Tokyo Electric Power.
Themainshock and six aftershocks that were close to the vertical array (epicentral distances<20 km) were recorded (Fig. 1, Table 1). Themaximum acceleration during the
mainshock is 728 cm/s2on the N109◦E component at SG4,
the bottom(250mdepth) sensor at KSH array. The hori-zontal components of the records were rotated into N19◦E and N109◦E, which is along the orientation of the power plant and strike of the sand dune.
3.
Sei
s
mic Vertical Array Analy
s
i
s
3.1 Spectral ratiosand velocitystructures
Observed spectral ratios between the various depths and theoretical transfer functions for a vertical incident S H -wave were compared. The observed spectra were calculated for each array record using 20-s, 10% cosine taper windows beginning 2.0 s before theS-wave arrival. The time window was determined taking into accountS-wave duration of the
mainshock. Spectral ratios were calculated for all com bina-tions of the spectra in each array. Theoretical transfer func-tions between the surface and various depths were calcu-lated by the propagatormatrixmethod (Aki and Richards,
0.1 1 10
Fig. 3. Comparison of observed spectral ratios between four aftershock records (gray lines) and theoretical transfer functions (dotted lines) at different depths of the KK5 array.
1 10
Fig. 4. Comparison of observed spectral ratios between themainshock records (solid lines), six aftershock records (gray lines), and theoretical transfer functions (dotted lines) at different depths of the KSH array.
1980) for S-waves based on the one-dimensional velocity profiles (Fig. 2). QS (S-wave quality factor) was assumed
to beVS/15.
Theoretical transfer functions for the KK5 array agree reasonably well with the observed spectral ratios calculated from KK5 records in 0.1–10 Hz (Fig. 3). However, the observed spectral ratios vary with the events at frequencies around 1–3 Hz. This feature is clearly seen in the panel of G51/G53 and G52/G54 and suggests a contribution of surface waves.
Observed spectral ratios for aftershock records from
Table 1. Events used in this study (after JMA). Matrix of data is also shown.
Event Date, time (JST) Lat. Long. Depth (km) Mj KK5 KSH
MS Jul. 16, 10:13 37.557 138.609 16.8 6.8 — o
A1 Jul. 16, 11:00 37.458 138.566 22.4 3.7 o o
A2 Jul. 16, 15:37 37.504 138.644 22.5 5.8 o o
A3 Jul. 16, 17:42 37.415 138.557 18.9 4.2 o o
A4 Jul. 16, 21:08 37.509 138.630 20.4 4.4 — o
A5 Jul. 25, 06:52 37.533 138.721 24.2 4.8 o o
A6 Aug. 4, 00:16 37.420 138.537 17.9 3.2 — o
Table 2. ObservedP- andS-wave travel times between array sensors of KK5 array.
Event P-wave (s) S-wave (s)
G51–G52 G52–G53 G53–G54 G54–G55 G51–G52 G52–G53 G53–G54 G54–G55
Theoretical 0.022 0.043 0.040 0.057 0.108 0.138 0.105 0.140
A1 0.04 0.04 0.03 0.06 0.11 0.14 0.11 0.13
A2 0.02 0.05 0.04 0.05 0.15 0.13 0.10 0.14
A3 0.02 0.05 0.03 0.06 0.11 0.14 0.12 0.14
A5 0.02 0.05 0.05 0.05 0.10 0.13 0.10 0.13
Table 3. ObservedP- andS-wave travel times between array sensors of KSH array.S-wave arrival time at SG3 for the A2 event could not be picked.
Event P-wave (s) S-wave (s)
SG1–SG2 SG2–SG3 SG3–SG4 SG1–SG2 SG2–SG3 SG3–SG4
Theoretical 0.069 0.030 0.087 0.153 0.125 0.272
MS 0.09 0.03 0.09 0.16 0.12 0.28
A1 0.09 0.04 0.09 0.21 0.14 0.28
A2 0.09 0.06 0.08 0.19 — —
A3 0.08 0.04 0.09 0.19 0.15 0.29
A4 0.10 0.03 0.09 0.21 0.14 0.27
A5 0.11 0.03 0.08 0.21 0.15 0.28
A6 0.09 0.03 0.10 0.20 0.14 0.30
The spectral ratios for themainshock records fromKSH array were obviously different fromthe theoretical transfer function and from the spectral ratios for the aftershocks (Fig. 4). The first peak frequency of the observed spectral ratio of SG1/SG2 was about 0.8 Hz, but the theoretical transfer function predicted a higher frequency of 1.5 Hz. The second and higher peaks of the observed spectral ratio were not clear. In addition, the high-frequency spectral ratios decreased for themainshock.
In order to examine the validity of the velocity profiles obtained fromPS-logging,P- andS-wave travel timesm ea-sured by picking P- andS-wave arrival times for various depths were compared with theoretical travel times calcu-lated fromthe velocity profiles (Tables 2 and 3). The the-oretical travel times between the various depths were cal-culated by assuming a vertical incidence of the P- and S -wave. There is reasonably good agreement between the ob-served and theoretical travel times at KK5 array. At the KSH array, the theoretical and observational travel times agree well for themainshock. For the aftershocks (A1–A6), however, the observed S-wave travel times of SG1–SG2 (travel times between SG1 and SG2) and SG2–SG3 (travel times between SG2 and SG3) are larger than the theoretical ones (Table 3). These differences between the observed and theoretical travel times for the aftershocks are one reason for the slight difference in the spectral ratios at KSH
be-tween the peak frequencies of the observed spectral ratios for the aftershocks and the theoretical transfer function.
3.2 Phase decomposition
In order to examine the wavefield, the seismic phase de-composition method (Yoshida and Sasatani, 2006, 2008) was applied to the vertical array records. I analysed only aftershock records because thismethod assumes linear soil responses. The P- and S-wave velocity structure models at the arrays were made of the PS-logging profiles and a deep sedimentary structure model constructed by com pil-ing deep boreholes around the seismic vertical array. The transfer functions between the surface and sensor depths were calculated by the propagatormatrixmethod (Aki and Richards, 1980) for body waves and the compoundmatrix
method (Saito, 1988) for surface waves based on the one-dimensional velocity structuremodels at each array (Fig. 2). The transfer functions for surface waves were calculated by assuming a fundamentalmode of Love and Rayleigh waves. Prior to their decomposition, the observed accelerograms were band-pass filtered between 0.5–5 Hz in order to avoid the instability at the low frequency, and were integrated into velocity time histories.
a) Observed
N19E N109E Up
G51
G52
G53
G54
G55
b) Decomposed
N19E N109E Up
S S P
Surface Surface Rayleigh
Residual Residual Residual
-1 0 1
Amplitude (cm/s) 0 10 20 30
Time (s)
0 10 20 30
Time (s)
0 10 20 30
Time (s)
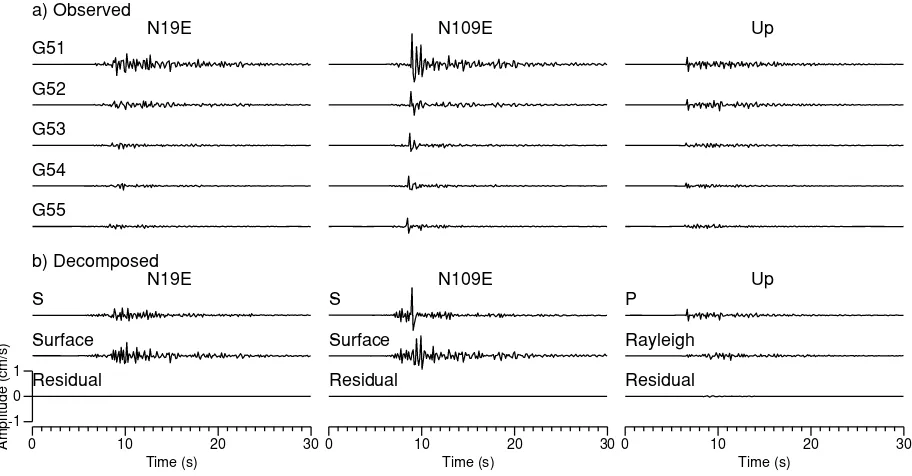
Fig. 5. (a) Vertical array records at KK5 for the A1 event. These are band-pass filtered velocity seismograms: the pass band is from0.5 to 5.0 Hz. (b) Vertical array analysis results: the decomposed waveforms. The decomposed body (PandS) waves are shown in the top row, the decomposed surface wave terms in the second row, and the residuals in the bottomrow.
a) Observed
N19E N109E Up
SG1
SG2
SG3
SG4
b) Decomposed
N19E N109E Up
S S P
Surface Surface Rayleigh
Residual Residual Residual
-1 0 1
Amplitude (cm/s) 0 10 20 30
Time (s)
0 10 20 30
Time (s)
0 10 20 30
Time (s)
Fig. 6. (a) Vertical array records at KSH for the A1 event. These are band-pass filtered velocity seismograms: the pass band is from0.5 to 5.0 Hz. (b) Vertical array analysis results: the decomposed waveforms. The decomposed body (PandS) waves are shown in the top row, the decomposed surface wave terms in the second row, and the residuals in the bottomrow. Same format as Fig. 5.
surface waves following the directS-wave, especially in the N109◦E component. The surface waves with an apparent period of 0.4 s (2.5 Hz) have similar amplitude to that of the directS-wave.
Figure 6 shows the decomposition results for the KSH array records. Here, I changedS-wave velocities at the first and second layers from310 and 350m/s to 240 and 340m/s, respectively, calibrating with the observed travel times. The result for the A1 event shows that the onset of theS-wave is not clear and that the amplitude levels of the surface waves aremaintained for more than 15 s. In contrast to the decomposition results for KK5 records, the waveforms
of the decomposedS-waves aremore complicated.
4.
Di
s
cu
ss
ion and Conclu
s
ion
the non-linear soil response caused by strong shaking. An analysis of array records obtained before the Chuetsu-oki
mainshock allows us to clearly observe the change in the velocity structure.
The decomposition analysis of the vertical array records at KK5 fromthe aftershock reveals that surface wave pulses appeared just after the directS-wave arrival. Surface waves like the A1 event also appeared in a decomposition result of KK5 array records for the A3 event (there is no space to show an analysis result). On the decomposed surface waves at KSH, the surface wave pulses that correspond to the pulses that appeared at KK5 were not found. It is diffi-cult to interpret the analysis results of the KSH array records in detail due to cross-talk noises between the decomposed body and surface waves. Nevertheless, the differences be-tween the decomposed surface waves fromthe KK5 and KSH array suggest that seismic wavefields from Chuetsu-oki aftershocks have been complicated.
Acknowledgments. Comments by Haruo Horikawa (AFRC,
AIST) were useful. The clarity and completeness of the
arti-cle were improved by reviews fromToshimi Satoh and Anatoly Petukhin. The author acknowledges Tokyo Electric Power, Co., for providing the vertical array data. Some of the figures in this paper were produced using GMT (Wessel and Smith, 1998).
References
Aki, K. and P. G. Richards,Quantitative Seismology—Theory and meth-ods, W. H. Freeman and Company, San Francisco, 1980.
Archuleta, R. J. and J. H. Steidl, ESG studies in the United States: Results fromborehole arrays,Proceedings of the Second International Sympo-sium of the Effects of Surface Geology on Seismic Motion, 3–14, 1998. Saito, M., DISPER80: A subroutine package for the calculation of seismic
normal-mode solutions, inSeismological Algorithms, edited by D. J. Doornbos, 293–319, Academic Press, San Diego, 1988.
Wessel, P. and W. H. F. Smith, New, improved version of the Generic Mapping Tools released,EOS, Trans. AGU,79, 579, 1998.
Yoshida, K. and T. Sasatani, A seismic phase decompositionmethod using vertical array records,Proceedings of the Third International Sympo-sium on the Effects of Surface Geology on Seismic Motion, 175–184, 2006.
Yoshida, K. and T. Sasatani, Seismic vertical array analysis for phase decomposition,Geophys. J. Int.,174, 707–718, 2008.