Cite as: Can Urol Assoc J 2016;10(9-10):333-8. http://dx.doi.org/10.5489/cuaj.3684 Appendices published online as of October 17
Abstract
Introduction: Active surveillance (AS) is a strategy for the
manage-ment of low-risk prostate cancer (PCa). However, few studies have assessed the uptake of AS at a population level and none of these were based on a Canadian population. Therefore, our objectives were to estimate the proportion of men being managed by AS in Ontario and to assess the factors associated with its uptake.
Methods: This was a retrospective, population-based study using
administrative databases from the province of Ontario to identify men ≤75 years diagnosed with localized PCa between 2002 and 2010. Descriptive statistics were used to estimate the proportion of men managed by AS, whereas mixed models were used to assess the factors associated with the uptake of AS.
Results: 45 691 men met our inclusion criteria. Of these, 18% were
managed by AS. Over time, the rates of AS increased significantly from 11% to 21% (p<0.001). Older age, residing in an urban cen-tre, being diagnosed in the later years of the study period, having a neighborhood income in the highest quintile, and being managed by urologists were all associated with greater odds of receiving AS.
Conclusions: There has been a steady increase in the uptake of AS
between 2002 and 2010. However, only 18% of men diagnosed with localized PCa were managed by AS during the study period. The decisions to adopt AS were influenced by several individual and physician characteristics. The data suggest that there is signifi-cant opportunity for more widespread adoption of AS.
Introduction
Since the introduction of prostate-specific antigen (PSA)-based screening, there has been an increase in the inci-dence of prostate cancer (PCa).1,2 However, this increase is
mostly driven by an increase in the diagnosis of clinically insignificant cancers.3 Thus, the management of PCa has
been associated with considerable overtreatment. Active
sur-veillance (AS) has been proposed as a strategy to decrease overtreatment4-10 and is now recognized as a management
option by a number of evidence-based guidelines.11-13
Although several prospective series have reported on its safety,4-10 few studies have reported on the uptake of AS at
a population level.14-23 No previous population-based study
has evaluated the proportion of men being managed by AS in Canada. In other areas of PCa management, there are significant differences between Canada and other countries. Although a recent single-institution series from the University of Ottawa has examined the treatment patterns of men diag-nosed with low-risk PCa,24 there remains a need to better
understand the rates of AS use and the factors related to its adoption, outside of single-institution series. We hypothesized that the rates of AS increased throughout the study period.
Methods
Participants
This was an institutional review board-approved, popula-tion-based, retrospective study that identified, using admin-istrative databases, men aged 18‒75 years who were diag-nosed with adenocarcinoma of the prostate between January 1, 2002 and December 31, 2010 in Ontario. We excluded men whose diagnostic procedure was not a transrectal ultra-sound-guided biopsy (TRUSB) or a transurethral resection of the prostate (TURP). Men who died or who received primary medical or surgical castration and/or palliative radiotherapy within the first year after diagnosis were also excluded.
All medical procedures in Ontario are reimbursed by a single payer system (Ontario Health Insurance Plan [OHIP]). All OHIP fee codes used are listed in Appendix 1 (avail-able at www.cuaj.ca). We linked these OHIP codes to the Ontario Cancer Registry, the Registered Persons Database, and the Ontario Drug Database to identify the management
Patrick O. Richard, MD;
1,2Shabbir M.H. Alibhai, MD;
3Tony Panzarella, MD;
4Laurence Klotz, MD;
5Maria Komisarenko, MD;
1Neil E. Fleshner, MD;
1David Urbach, MD;
6Antonio Finelli, MD
11Division of Urology, Departments of Surgery and Surgical Oncology, Princess Margaret Cancer Centre, University Health Network and the University of Toronto; 2Division of Urology, Department of Surgery,
Centre Hospitalier Universitaire de Sherbrooke and the University of Sherbrooke, Sherbrooke, QC, Canada; 3Department of Medicine, University Health Network and the University of Toronto; 4Biostatistics
Department, Princess Margaret Hospital, University Health Network and the University of Toronto; 5Division of Urology, Sunnybrook Health Sciences Centre and the University of Toronto; 6Department of
Surgery, University Health Network and the University of Toronto; Toronto, ON, Canada
of subjects diagnosed with PCa (data cutoff December 31, 2013). As there are no codes to differentiate between radio-therapy given with curative or palliative intent, we defined the latter as therapy given within one month or ≥6 months after castration. All localized PCa were included in this study, regardless of the risk-group stratification.25
Treatment groups
Subjects were allocated to one of four groups. The ones who received definitive therapies (i.e., surgery, external beam radiotherapy, or brachytherapy) within the first year follow-ing diagnosis without a second TRUSB beforehand were allocated to the definitive treatment group. The remaining men were considered to be in the expectant/observation group that was then subdivided into AS, watchful waiting (WW), and delayed treatments.
The AS group was composed of individuals who had under-gone a second TRUSB (confirmatory biopsy) following diagno-sis, before any definitive treatments were instituted or before castration. The remaining patients were allocated to the WW/ delayed treatment group, which consisted of men who had no subsequent repeat TRUSB or treatments other than castration or palliative radiotherapy (WW) and of men who received defini-tive therapies >12 months after diagnosis (delayed treatment).
Variables
Using the databases, we determined individual-, physician- and institution-level characteristics. The individual-level characteristics included age at diagnosis, year of diagno-sis, neighbourhood income quintile (hereinafter referred to as simply income quintile), and the area of residency. The Aggregated Diagnosis Groups (ADG) score, derived from the Johns Hopkins University Adjusted Clinical Groups Case-Mix system, was used to measure comorbidity.26
Physician- and institution-level characteristics included the treating physician’ speciality and his/her annual new PCa-related case volume, as well as the type of treating centre and its annual new PCa-related case volume. The treating physician was defined as the physician who claimed the most PCa-related visits for each individual during the first year after diagnosis, while the treating institution was defined as the institution where the patient received the majority of his PCa care during the same timeframe.
Outcomes
The primary outcome was to determine the proportion of men with localized PCa managed by AS during the study period. Secondary outcomes were to estimate the uptake of AS over time and to estimate the characteristics associated with the uptake of AS.
Statistical analysis
Descriptive statistics were used to describe the cohort. Medians and interquartile range (IQR) were reported for continuous variables, while proportions were used to report categorical variables. Medians were compared using Wilcoxon or the Kruskal-Wallis sum of rank tests, where appropriate. Chi-squared analyses were used to compare categorical variables, while the Chi-square test for trend was used to estimate whether there was a significant increase in the adoption of AS over time.
Baseline characteristics associated with the adoption of AS were evaluated using a non-linear mixed model adjusted for a priori defined covariates based on previous studies (Appendix 2 at www.cuaj.ca) and adjusted for physician- and institution-level clusters assuming cross-classified data (i.e., physicians could work in more than one institution).27
Estimates in the multivariable models are reported as odds ratios (ORs) with corresponding 95% confidence inter-vals (CIs). Physician- and institution-attributable intra-class correlations were obtained by calculating the ratio of the between-cluster variance to the total variance.28 Five
mod-els specified for each of the outcomes were constructed to account for explained and unexplained variances.
Sensitivity analyses were also performed using three dif-ferent definitions to identify men managed by AS (Appendix 3 at www.cuaj.ca). All statistical analyses were performed using SAS 9.4 and R version 3.1.3 statistical software. All analyses were two-sided, and p values less than 0.05 were considered statistically significant, with the exception of when multiple comparisons were required, at which time a Bonferroni correction was used.29
Results
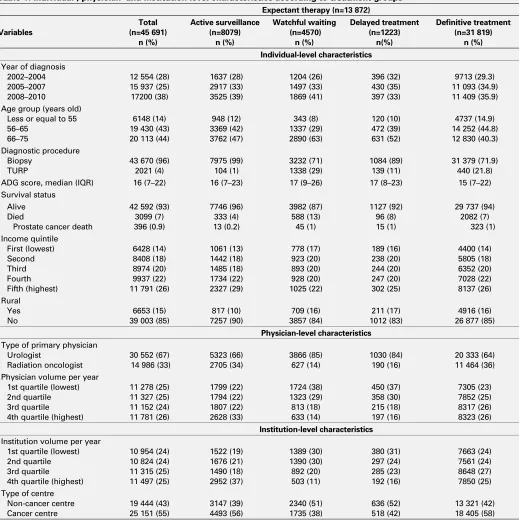
A total of 79 498 men diagnosed with PCa between 2002 and 2010 were identified, of which 33 807 were excluded for various reasons (Appendix 4 at www.cuaj.ca). The final cohort was composed of 45 691 men. The characteristics of these men and their treating physicians (n=424) and institu-tions (n=215) are listed in Table 1.
In multivariable analysis, older age, residing in an urban centre, being diagnosed in the later years of the study per-iod, having an average neighbourhood income in the highest quintile, and being primarily managed by an urologist were all associated with greater odds of receiving AS. A forest plot
summary of the effects of each covariate included in the full model (Model 5) is presented in Fig. 1.
Despite adding all individual-, physician-, and institution-level characteristics (Model 5; Appendix 6 at www.cuaj. ca), there remained significant variance between physicians
Table 1. Individual-, physician- and institution-level characteristics according to treatment groupsa Expectant therapy (n=13 872)
Variables Age group (years old)
Less or equal to 55
ADG score, median (IQR) 16 (7–22) 16 (7–23) 17 (9–26) 17 (8–23) 15 (7–22)
Survival status
Type of primary physician Urologist Physician volume per year
1st quartile (lowest)
Institution volume per year 1st quartile (lowest) Cancer centre
19 444 (43)
aAll adjusted p values were significant (p<0.001) when the active surveillance group was compared to the watchful waiting group, to the delayed treatment group, and to the definitive treatment
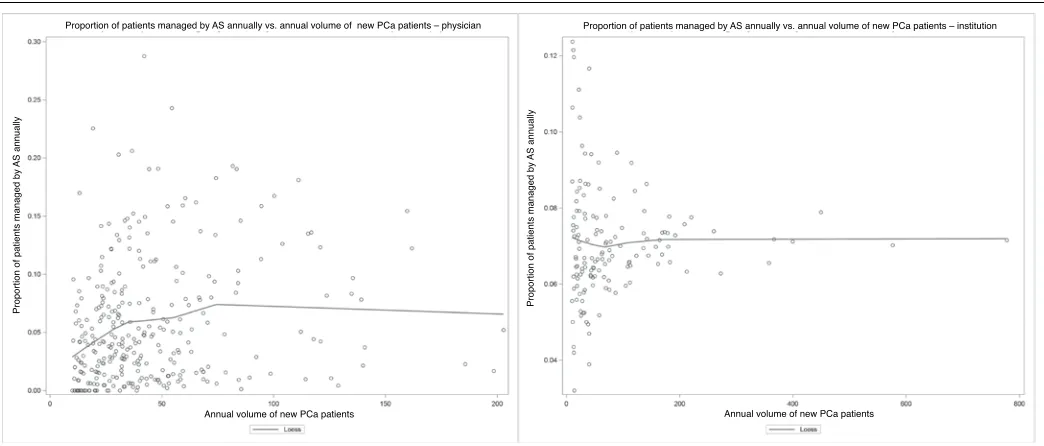
(14%) and institutions (36%). All three sensitivity analyses yielded similar results, with the exception of higher comor-bidity, which was associated with lower odds of adopting AS using the most liberal definition of AS (Appendix 7 at www. cuaj.ca). There was marked heterogeneity between phys-icians with regard to the annual proportion of new patients managed by AS. Such heterogeneity was also observed, but to a lesser degree, among the treating institutions (Fig. 2).
Discussion
In this first Canadian population-based study on AS, 18% of men diagnosed with localized PCa between 2002 and 2010
were managed by this approach. Since 2002, the use of AS has increased by approximately 1% per year to reach a rate of 21% in 2010. This supports the fact that there is a growing acceptance of AS and likely represents an underestimation of the true proportion of men managed by AS, as the study was not restricted to low-risk PCa.18,20,23 Assuming that 50%
of subject had low-risk disease15 and that the majority of
patients included in our AS group were indeed low-risk, one could postulate that approximately 36% of patients with low-risk disease were treated by this approach during the study period. These rates were similar to those in other population-based studies, which varied from 10‒38%
11,16-18,20-22 and in line with the recent single-institution series by
Cristea et al.24 Differences in study methodology (any-risk
cohort vs. low-risk cohort; pooling AS and WW together vs. presenting them separately) and the countries’ health-care systems could explain the divergent rates. Given the similarities of our single-payer healthcare system with that of Sweden, we expected our rates to more closely resemble theirs.19,20 In the Swedish study, which excluded men with
high-risk diseases, 38% of Swedish men were managed expectantly between 1998 and 2011.19 Rates of AS for the
period covering 2007 and 2011 were 59% and 41% for the very-low and low- and intermediate-risk groups, respect-ively. Although a direct comparison with our study is difficult because our cohort included men with high-risk PCa and restricted the age to ≤75 years (the Swedish trial included 10% of men >75 years of age), our rates were comparable.
The factors associated with the uptake of AS in this study were similar to those previously identified.14,18,19 Increasing
age was strongly associated with a greater likelihood of being managed by AS. This may reflect a degree of discom-fort either from physicians, patients, or both, with AS as a safe option for younger and healthier men. Contrary to previ-ous findings, we identified that men living in an urban area and men with the highest income quintile were more likely to receive AS.14,30 This may be explained by the universal
Variables No. of patients on AS (%) OR OR (95%CI) Age category
Less than 55 yo 948 (12) REF
56–65 yo 3369 (42) 1.18 (1.08–1.29)
66–75 yo 3762 (47) 1.56 (1.42–1.72)
Index year
2002–2004 1637 (28) REF
2005–2007 2917 (33) 1.66 (1.54–1.80)
2008–2010 3525 (39) 2.04 (1.88–2.22)
Income quintile*
First 1061 (13) REF
Second 1442 (18) 1.04 (0.94–1.15)
Third 1485 (19) 0.98 (0.89–1.09)
Fourth 1734 (22) 1.04 (0.94–1.14)
Fifth 2327 (29) 1.17 (1.06–1.28)
ADG score 8079 (100) 1.00 (0.998–1.003)
Area of residency
Rural 817 (10) REF
Urban 7257 (90) 1.28 (1.16–1.42)
Primary physician
Radiation oncologist 2705 (34) REF
Urologist 5323 (66) 2.26 (1.73–2.97)
Annual physician volume†
First quartile 1799 (22) REF
Second quartile 1794 (22) 0.95 (0.70–1.28)
Third quartile 1807 (23) 0.98 (0.68–1.40)
Fourth quartile 2628 (33) 1.31 (0.87–1.96)
Type of primary centre
Non-cancer centre 3147 (41) REF
Cancer centre 4493 (59) 1.13 (0.80–1.60)
Annual institution volume†
First quartile 1522 (20) REF
Second quartile 1676 (24) 0.60 (0.28–1.26)
Third quartile 1490 (20) 0.87 (0.24–1.50)
Fourth quartile 2952 (39) 1.13 (0.25–4.29)
*First refers to the lowest income quintile; fifth, the highest; †first refers to the lowest volume quartile, fourth, the highest.
0.5 1 1.5 2 2.5 3 4
Fig. 1. Forest plot of the odds ratio (OD) for each covariate included in the multivariable analysis – uptake of active surveillance. ADG: Aggregated Diagnosis Groups; AS: active surveillance.
Table 2. Type of management according to year of diagnosis (n=45 691)
Year of diagnosis Active surveillance n (%) Watchful waiting n (%) Delayed treatment n (%) Definitive treatment n (%) Total per year n (%)
2002 436 (11) 397 (10) 135 (3) 3044 (76) 4012 (9)
2003 545 (14) 388 (10) 124 (3) 2952 (74) 4009 (9)
2004 656 (15) 419 (9) 137 (3) 3321 (73) 4533 (10)
2005 801 (17) 433 (9) 148 (3) 3403 (71) 4785 (11)
2006 998 (19) 519 (10) 133 (3) 3716 (69) 5366 (12)
2007 1118 (19) 545 (9) 149 (3) 3974 (69) 5786 (13)
2008 1104 (20) 567 (10) 145 (3) 3773 (68) 5589 (12)
2009 1215 (21) 640 (11) 156 (3) 3835 (66) 5846 (13)
2010 1206 (21) 662 (12) 96 (2) 3701 (66) 5765 (13)
Total 8079 (18) 4570 (10) 1223 (3) 31 819 (70) 45 691 (100)
access to healthcare as opposed to a system in which care is more accessible to higher socio-economic groups. The lack of financial incentive to treat a patient with radical therapies in Canada could also be a plausible explanation as to why men treated in urban centres were more likely to undergo AS. Physicians working in designated cancer centres, which are usually located in urban centres, may have also adopted AS earlier than their other colleagues. Although plausible, this factor was not found to be significantly associated with the uptake of AS in our study.
A major strength of our study is that we used administra-tive data that encompasses the care of the entire Ontario population. Thus, whereas a study based on Surveillance, Epidemiology, and End Results (SEER) only included Medicare patients ≥65 years of age, our study included all men ≤75 years of age. This study also has several limitations. First, a repeat biopsy was used as a surrogate to identify patients who were managed by AS. Although patients should undergo a confirmatory biopsy (generally within the first year), some refuse.25 To partially account for this, we used
a minimum look-forward window of three years to identify a repeat biopsy. In addition, we also used several sensitivity analyses to validate our findings. Furthermore, the fact that we could not adjust for risk-group classification represents a significant limitation, as high-risk PCa and, for the most part, intermediate-risk PCa men are not generally considered can-didates for AS. Thus, our estimate of the rate of AS is likely conservative and our interpretation of the identified factors associated with the uptake is limited by this confounder.
In spite of these limitations, the study is the first one that attempts to estimate the proportion of men managed with AS in Canada. It supports a greater acceptance of AS as a
management option during the study period, but highlights the need for more widespread adoption. In this era of person-alized medicine and concerns regarding overtreatment, this study provides a starting point for further studies that should aim toward estimating the ideal proportion of patients (bench-mark) with low-risk PCa that should be managed by AS.
Conclusion
Between 2002 and 2010, 18% of men diagnosed with localized PCa in Ontario were managed by AS. Over the years, there has been a steady increase in the uptake of AS, which attests to the growing acceptance of this management option. The decision to adopt AS was influenced by several individual and physician characteristics. Further research is underway to better understand the forces influencing care and the rigour with which AS is being provided. The data suggest that there is significant opportunity for more wide-spread adoption of AS in Ontario.
Competing interests: Dr. Alibhai has received grants from Sanofi. The remaining authors report no competing personal or financial interests.
This paper has been peer-reviewed.
References
1. American Cancer Society. Cancer Facts and Statistics 2015. Available at http://www.cancer.org/ research/cancerfactsstatistics/index. Accessed August 29, 2016.
2. Public Health Agency of Canada. Public Health Portal. Available at http://www.cancer.ca/en/cancer-information/cancer-101/canadian-cancer-statistics-publication. Accessed August 29, 2016.
Proportion of patients managed by
AS annually
Proportion of patients managed by
AS annually
Annual volume of new PCa patients Annual volume of new PCa patients
Proportion of patients managed by AS annually vs. annual volume of new PCa patients – physician Proportion of patients managed by AS annually vs. annual volume of new PCa patients – institution
Fig. 2. Scatter plot of the proportion of patients managed by active surveillance annually vs. the annual volume of new prostate cancer patients (A) for each
3. Draisma G, Etzioni R, Tsodikov A, et al. Lead time and overdiagnosis in prostate-specific antigen screening: Importance of methods and context. J Natl Cancer Inst 2009;101:374-83. http://dx.doi.org/10.1093/ jnci/djp001
4. Dall’Era M, Konety B, Cowan J, et al. Active surveillance for the management of prostate cancer in a contemporary cohort. Cancer 2008;112:2664-70. http://dx.doi.org/10.1002/cncr.23502 5. Eggener S, Mueller A, Berglund R, et al. A multi-institutional evaluation of active surveillance for low-risk
prostate cancer. J Urol 2013;189:S19-26. http://dx.doi.org/10.1016/j.juro.2012.11.023 6. Klotz L, Vesprini D, Sethukavalan P, et al. Long-term followup of a large active surveillance cohort of patients
with prostate cancer. J Clin Oncol 2015;33:272-7. http://dx.doi.org/10.1200/JCO.2014.55.1192 7. Selvadurai E, Singhera M, Thomas K, et al. Medium-term outcomes of active surveillance for localized
prostate cancer. Eur Urol 2013;64:981-7. http://dx.doi.org/10.1016/j.eururo.2013.02.020 8. Soloway M, Soloway C, Eldefrawy A, et al. Careful selection and close monitoring of low-risk prostate
cancer patients on active surveillance minimizes the need for treatment. Eur Urol 2010;58:831-5. http://dx.doi.org/10.1016/j.eururo.2010.08.027
9. Bul M, van den Bergh R, Zhu X, et al. Outcomes of initially expectantly managed patients with low- or intermediate-risk screen-detected localized prostate cancer. BJU Int 2012;110:1672-7. http://dx.doi. org/10.1111/j.1464-410X.2012.11434.x
10. van den Bergh R, Roemeling S, Roobol M, al. Outcomes of men with screen-detected prostate cancer eligible for active surveillance who were managed expectantly. Eur Urol 2009;55:1-8. http://dx.doi. org/10.1016/j.eururo.2008.09.007
11. Carter H, Albertsen P, Barry M, et al. Early detection of prostate cancer: AUA guideline. J Urol
2013;190:419-26. http://dx.doi.org/10.1016/j.juro.2013.04.119
12. Heidenreich A, Abrahamsson P, Artibani W, al. Early detection of prostate cancer: European Association of Urology recommendation. Eur Urol 2013;64:347-54. http://dx.doi.org/10.1016/j.euru-ro.2013.06.051
13. Izawa J, Klotz L, Siemens D, et al. Prostate cancer screening Canadian guidelines. Can Urol Assoc J
2011;5:235-40. http://dx.doi.org/10.5489/cuaj.11134
14. Chamie KWS, Hu J. Population-based assessment of determining treatments for prostate cancer. JAMA Oncol 2015;1:60-7. http://dx.doi.org/10.1001/jamaoncol.2014.192
15. Cooperberg M, Broeing J, Carroll P. Time trends and local variation in primary treatment of localized prostate cancer. J Clin Oncol 2010;28:1117-23. http://dx.doi.org/10.1200/JCO.2009.26.0133 16. Cooperberg MR, Carroll PR. Trends in management for patients with localized prostate cancer, 1990-2013.
JAMA 2015;314:80-2. http://dx.doi.org/10.1001/jama.2015.6036
17. Filson C, Schroeck F, Ye Z, et al. Variation in use of active surveillance among men undergoing expect-ant treatment for early stage prostate cancer. J Urol 2014;192:75-81. http://dx.doi.org/10.1016/j. juro.2014.01.105
18. Hoffman K, Niu J, Shen Y, et al. Physician variation in management of low-risk prostate cancer: A population-based cohort study. JAMA Intern Med 2014;174:1450-9. http://dx.doi.org/10.1001/ jamainternmed.2014.3021
19. Loeb S, Berglund A, Stattin P. Population-based study of use and determinants of active surveillance and watchful waiting for low and intermediate risk prostate cancer. J Urol 2013;190:1742-9. http://dx.doi. org/10.1016/j.juro.2013.05.054
20. Loeb S, Folkvaljon Y, Makarov D, et al. Five-year nationwide followup study of active surveillance for prostate cancer. Eur Urol 2015;67:233-8. http://dx.doi.org/10.1016/j.eururo.2014.06.010 21. Mahmood U, Levy L, Nguyen P, et al. Current clinical presentation and treatment of localized prostate
cancer in the U.S. J Urol 2014;182:1650-6. http://dx.doi.org/10.1016/j.juro.2014.06.017 22. Weerakoon M, Papa N, Lawrentschuk N, et al. The current use of active surveillance in an Australian cohort
of men: A pattern of care analysis from the Victorian Prostate Cancer Registry. BJU Int 2015;115:50-6. http://dx.doi.org/10.1111/bju.13049
23. Womble P, Montie J, Ye Z, et al. Contemporary use of initial active surveillance among men in Michigan with low-risk prostate cancer. Eur Urol 2015;67:44-50. http://dx.doi.org/10.1016/j.eururo.2014.08.024 24. Cristea O, Lavallée LT, Montroy J, et al. Active surveillance in Canadian men with low-grade prostate
cancer. CMAJ 2016 [Epub ahead of print].
25. Mohler J, Armstrong A, Bahnson R, et al. Prostate cancer, version 3.2012: Featured updates to the NCCN guidelines. J Natl Compr Canc Netw 2012;10:1081-7.
26. Austin P, van Walraven C. The mortality risk score and the ADG score. Two points-based scoring systems for the Johns Hopkins aggregated diagnosis groups to predict mortality in a general adult population cohort in Ontario, Canada. Med Care 2011;49:940-7. http://dx.doi.org/10.1097/MLR.0b013e318229360e 27. Leckie G. Cross-classified multilevel models - Concepts. LEMMA VLE 2013;12:1-60.
28. Browne W, Subramanian S, Jones K, et al. Variance partitioning in multilevel logistic models that exhibit overdispersion. J R Stat Soc A 2005;168:599-613. http://dx.doi.org/10.1111/j.1467-985X.2004.00365.x
29. Cabin RJ, Mitchell RJ. To Bonferroni or not to Bonferroni: When and how are the questions. Bulletin of the Ecological Society of America 2000;81:246-8.
30. Mishra M, Shen X, Den R, et al. Patterns of care for elderly men diagnosed with favourable-risk prostate cancer from 2004‒2008: A population-based analysis.Am J Clin Oncol 2013;36:606-11. http://dx.doi. org/10.1097/COC.0b013e318261056c