Paul Toren, MD, FRCSC;
*Lih-Ming Wong, MBBS, FRACS;
†Narhari Timilshina, MSc;
§Shabbir Alibhai, MD, MSc, FRCSC;
¥John Trachtenberg, MD, FACS, FRCSC;
§Neil Fleshner, MD, FRCSC;
§Antonio Finelli, MD, FRCSC
§*Department of Urologic Sciences, University of British Columbia, Vancouver, BC; †Department of Urology, St. Vincent’s Hospital and Austin Health, University of Melbourne, Victoria, Australia; §Department of Surgery (Urology), University of Toronto, Princess Margaret Hospital, Toronto, ON; ¥Department of Medicine and Institute of Health Policy, Management, and Evaluation, University Health Network and University of Toronto, Toronto, ON
Cite as: Can Urol Assoc J 2014;8(9-10):e702-7. http://dx.doi.org/10.5489/cuaj.2121 Published online October 22, 2014.
Abstract
Introduction: The use of prostate-specific antigen (PSA) in active surveillance (AS) for prostate cancer is controversial. Some con-sider it an unreliable marker and others as sufficient evidence to exclude patients from AS. We analyzed our cohort of AS patients with a PSA over 10 ng/mL.
Methods: We included patients who had clinical T1c–T2a Gleason ≤6 disease, and ≤3 positive cores with ≤50% core involvement at diagnostic biopsy and ≥2 total biopsies. Patients were divided into 3 groups: (1) those with baseline PSA >10 ng/mL, (2) those with a PSA rise >10 ng/mL during follow-up; and (3) those with a PSA <10 ng/mL throughout AS. Adverse histology was defined as biopsy parameters exceeding the entry criteria limits. We further compared this cohort to a concurrent institutional cohort with equal biopsy parameters treated with immediate radical prostatectomy.
Results: Our cohort included 698 patients with a median follow-up of 46.2 months. In total, 82 patients had a baseline PSA >10 ng/ mL and 157 had a PSA rise >10 ng/mL during surveillance. No difference in adverse histology incidence was detected between groups (p = 0.3). Patients with a PSA greater than 10 were older and had higher prostate volumes. Hazard ratios for groups with a PSA >10 were protective against adverse histology. Larger prostate volume and minimal core involvement appear as factors related to this successful selection of patients to be treated with AS.
Conclusion: These results suggest that a strict cut-off PSA value for all AS patients is unwarranted and may result in overtreatment. Though lacking long-term data and validation, AS appears safe in select patients with a PSA >10 ng/mL and low volume Gleason 6 disease.
Introduction
The use of prostate-specific antigen (PSA) in active sur-veillance (AS) for prostate cancer is controversial. A PSA >10 ngmL is used as an exclusion criterion in many of the
large AS series.1 However, the evidence to support the use
of a PSA threshold is limited. Data from the PIVOT (Prostate Cancer Intervention Versus Observation Trial) study suggests that localized cancer with a PSA <10 may not require treat-ment.2 While it is clear from nomograms that a higher PSA
incurs a higher risk of high-grade cancer, it is unclear how applicable a threshold PSA of 10 ng/mL is in the selected AS population where the volume of biopsy-detected disease is by definition very low.
In clinical practice, the use of PSA as a threshold in sur-veillance varies widely. The largest AS series published to date3 had 13.1% of patients at onset of surveillance with a
PSA >10 ng/mL, and 38% with a PSA value over 10 at a median of 6.1 years of follow-up. PSA density can reduce the bias of PSA values induced by prostate size.4 Measurements
of PSA velocity or doubling time may also be used, but the absolute value of PSA can be a driver of both patient and physician anxiety to discontinue surveillance.
At our institution an elevated PSA has not been used as an absolute contraindication to AS. Therefore, we reviewed our experience with patients with an elevated PSA, both at entry and during surveillance for otherwise low-risk local-ized prostate cancer.
Methods
In previous publications we have strictly limited our analysis to men suitable for AS according to standard inclusion crite-ria.5-7 Thus, we examined men with clinical stage T1c–T2a,
Gleason score <6, and 3 or fewer cores positive with no more than 50% of a core involved at initial diagnostic biopsy and PSA <10 ng/mL. We also included men who pursued AS with either a PSA >10 ng/mL at baseline or experienced a PSA rise over 10 ng/mL during follow-up. Only patients with 2 or more biopsies were included.
Data on all patients on AS at our institution were pro-spectively collected in a database (1995-2011); with most patients enrolled in recent years. Institutional ethics board
approval was obtained. Our institution does not have a strict follow-up protocol, but we generally recommended PSA and digital rectal exam every 3 months initially (first 2 years) and then every 6 months subsequently. Prostate re-biopsy was recommended within the first 12 months of diagnosis and then every 2 to 3 years. “For-cause” biopsy based on physician discretion was allowed. For prostate re-biopsy, the transition zone was sampled, in addition to the standard extended peripheral zone template.7
The two groups of men with PSA >10 (at baseline and rise during AS) were compared to the remainder of patients on AS meeting standard entry criteria (Gleason score ≤6, ≤3 positive cores and all cores with ≤50% involvement) who never had a PSA >10 ng/mL. The primary outcome was the incidence of adverse histology at subsequent biopsies. Adverse histology was defined as biopsy parameters exceed-ing the entry criteria limits.
In a supplemental analysis, we compared our patients on AS with a concurrent cohort of men who underwent upfront radical prostatectomy (RP) at the same institution with identical biopsy features prior to RP (i.e., cT1c–T2a, maximum Gleason score of 6, ≤3 cores positive and ≤ 50% of any core involvement) during the period from 2000 to 2012. These patients were grouped into cohorts of a PSA <10 ng/mL or ≥10 ng/mL based on the last PSA prior to RP.
All statistical calculations were performed using SAS v.9.2 (SAS Institute, Cary, NC). Student T-tests were used to compare means, and Chi-squared test to compare pro-portions. Univariate and multivariate cox regression anal-ysis analyzed risk factors for adverse histology on repeat biopsies. Covariates were selected based on univariate val-ues (p < 0.10), except for the 3 groups of patients studied included a priori. Given our prior results demonstrating that 5-alpha reductase inhibitors (5ARI) prolong the time to pathologic progression (here referred to as adverse histol-ogy),5 we planned a sensitivity analysis excluding men on
5ARIs to determine the robustness of our findings.
Results
From our institutional AS database, 698 patients met the inclusion criteria; of these, 239 (34%) patients never had a PSA > 10ng/mL. Of the entire AS cohort, the mean age was 64.1 years, with a median follow-up of 46.2 months (interquartile range 29.6-66.6). Most had 2 to 3 biopsies on surveillance (Fig. 1). Excluded from the 698 analyzed patients were 17 patients with only 1 biopsy, 50 patients with baseline Gleason grade 4 disease and 40 patients with higher volume Gleason 6 disease on biopsy (>3 cores or >50% core involvement).
There were 82 patients with a PSA over 10 ng/mL at the start of AS, and 157 patients had a PSA rise over 10 during surveillance. Among these 157 patients, a change to active treatment without adverse histology occurred in 20 (12.7%) patients. Table 1 shows baseline characteristics of all men with entry biopsy criteria treated with AS, and those who had immediate RP. Notably, while men with a baseline PSA >10 ng/mL on AS had larger prostates and were older, there were no significant differences in initial biopsy characteris-tics between groups.
Comparing the initial 698 patient cohort with the 559 patients with immediate RP and an elevated PSA >10 ng/mL allowed us to assess the factors involved in patient selection for AS (Table 1). We found that men selected for AS were older and had larger prostates. On initial biopsy, they also had a lower mean percentage of maximal core involvement and a lower number of positive cores.
Table 2 summarizes the outcomes of AS by group. Rates of adverse histology on first repeat or subsequent biopsy did not significantly vary between groups. As expected, those with a baseline PSA>10 or a PSA rise >10 had a higher rate of treatment on AS (Table 2).
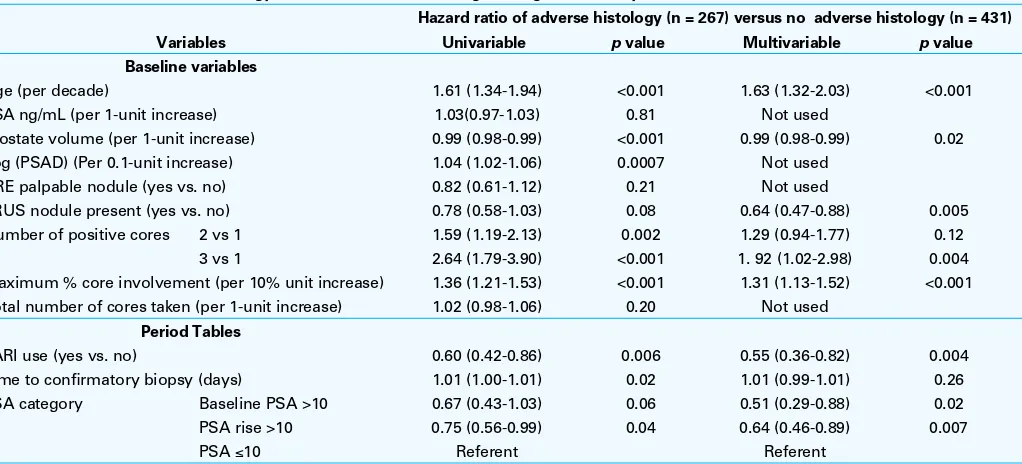
Using multivariate Cox regression analysis, higher age, number of positive cores and higher percentage of core involvement were risk factors for subsequent adverse
histol-7
6
5
4
3
2
8
7
6
5
4
3
2
6
5
4
3
2 Number of Biopsies
Baseline PSA >10 Number of BiopsiesPSA rise >10
Number of Biopsies PSA <10
37% 12%
51%
38%
33% 15% 8%
3% 2% 1%
32%
45% 17%
5% 1%
ogy (Table 3), while the presence of a transrectal ultrasound nodule and use of 5ARIs were protective. PSA density was excluded from the multivariate analysis due to collinearity with PSA groups. Surprisingly, a PSA >10 ng/mL, either at
baseline or during follow-up, was protective against adverse histology at subsequent biopsies. A sensitivity analysis exclud-ing patients on 5ARIs did not significantly change the results (data not shown).
Table 1. Baseline characteristics of patients with low risk (Gleason ≤6, ≤3 cores, ≤50% involvement of any core, ≤cT2a) who underwent AS or RP at a single institution
Cohort treated with AS (n = 698) Comparison cohort treated with immediate RP (n = 559) Median PSA (IQR) 12.4
(10.7-14.9)
Median PSAD, ng/mL2(IQR) 0.18
(0.14-0.27)
Median prostate volume,** mL (IQR)
DRE palpable nodule (%) 14 (17.1)
Previous negative biopsy (%)
involvement, mean (SD)†
6.0
TRUS hypoechoic nodule (%)
AS: active surveillance; RP: radical prostatectomy; DRE: digital rectal exam; PSA: prostate-specific antigen; PSAD: PSA density; IQR: interquartile range; TRUS: transrectal ultrasound. *Data available for 25 patients. **Prostate weight from RP used for patients treated with immediate RP. †This value is the core with the highest percentage of involvement of a given biopsy from a given patient. ††The denominator for these numbers is not 63, but the number for which this information was available.
Table 2. Outcomes of patients on AS by group (n = 698)
Baseline PSA >10 (n = 82)
PSA rise >10 (n = 157)
PSA ≤10
(n = 459) p value Median follow-up months (IQR) 33.8 (20.4-59.1) 53.9 (34.8-74. 36.3(19.4-62.2) 0.001 Median months to first repeat biopsy (IQR) 13.7 (6.6-24.1) 15.2 (7.6-28.4) 12.3 (6.1-20.1) 0.002
AH at first repeated biopsy (%) 18 (21.7) 43 (27.6) 102 (22.3) 0.37
AH at subsequent biopsy (%) 9 (13.9) 26 (23.0) 68 (19.1) 0.32
Reason for AH Number of cores involved (%) 9 (10.8) 29 (18.6) 62 (13.5) 0.18
Gleason score (%) 12 (14.5) 33 (21.2) 70 (15.3) 0.20
% core involvement (%) 4 (4.8) 16 (10.3) 30 (6.6) 0.20
Number who underwent treatment (%) 32 (38.5) 61 (39.1) 135 (29.5) 0.04
Number started on 5ARI (%) 16 (19.3) 29 (18.6) 80 (17.5) 0.89
Prostate mpMRI
A total of 228 (33%) patients in our cohort eventually underwent treatment; 103 of these patients underwent a RP. Among men with a PSA rise, the use of non-surgical treatment was higher (64% vs. 53% and 51% for men on AS with a PSA >10 at baseline and a PSA <10, respectively;
p = 0.03). Table 4 details the final pathologic outcomes by
group. Five men had a rise in PSA >10 ng/mL on surveil-lance and a high Gleason (≥8) disease at RP; however, no high-grade disease at RP was found among AS patients treated with RP who had a PSA >10 ng/mL at baseline. In the concurrent RP cohort of men treated with identical risk disease on biopsy, 63 (11.3%) had a PSA >10 ng/mL (Table 1). While the numbers were small, the final
pathol-ogy among those treated with immediate RP were more favourable compared to those progressing to RP from AS with an initial PSA >10, similar to our previously reported results.6
Discussion
AS is a treatment approach for low-risk localized prostate cancer; it is gaining widespread use as patients and physi-cians understand the burden of diagnosis and over-treatment. However, the detailed protocols for AS remain largely based on expert opinion. While PSA carries prog-nostic information, this series demonstrates that, with
appro-Table 3. Predictors of adverse histology reclassification on AS using Cox regression analysis (n = 698)
Hazard ratio of adverse histology (n = 267) versus no adverse histology (n = 431) Variables Univariable p value Multivariable p value
Baseline variables
Age (per decade) 1.61 (1.34-1.94) <0.001 1.63 (1.32-2.03) <0.001 PSA ng/mL (per 1-unit increase) 1.03(0.97-1.03) 0.81 Not used
Prostate volume (per 1-unit increase) 0.99 (0.98-0.99) <0.001 0.99 (0.98-0.99) 0.02 Log (PSAD) (Per 0.1-unit increase) 1.04 (1.02-1.06) 0.0007 Not used
DRE palpable nodule (yes vs. no) 0.82 (0.61-1.12) 0.21 Not used
TRUS nodule present (yes vs. no) 0.78 (0.58-1.03) 0.08 0.64 (0.47-0.88) 0.005 Number of positive cores 2 vs 1 1.59 (1.19-2.13) 0.002 1.29 (0.94-1.77) 0.12
3 vs 1 2.64 (1.79-3.90) <0.001 1. 92 (1.02-2.98) 0.004 Maximum % core involvement (per 10% unit increase) 1.36 (1.21-1.53) <0.001 1.31 (1.13-1.52) <0.001 Total number of cores taken (per 1-unit increase) 1.02 (0.98-1.06) 0.20 Not used
Period Tables
5ARI use (yes vs. no) 0.60 (0.42-0.86) 0.006 0.55 (0.36-0.82) 0.004
Time to confirmatory biopsy (days) 1.01 (1.00-1.01) 0.02 1.01 (0.99-1.01) 0.26 PSA category Baseline PSA >10 0.67 (0.43-1.03) 0.06 0.51 (0.29-0.88) 0.02 PSA rise >10 0.75 (0.56-0.99) 0.04 0.64 (0.46-0.89) 0.007
PSA ≤10 Referent Referent
AS: active surveillance; PSA: prostate-specific antigen; PSAD: PSA density; IQR: interquartile range; 5ARI: 5-alpha reductase inhibitor; DRE: digital rectal exam; TRUS: transrectal ultrasound.
Table 4. Pathologic outcomes among all patients undergoing RP
Active surveillance (n = 698) Immediate RP (n = 552)* Baseline
PSA>10 (n = 82)
PSA rise >10 (n = 157)
PSA ≤10 (n = 459)
p value RP with PSA
>10 (n = 63)
RP with PSA <10 (n = 489)
p value
RP (% of all treated) 15 (46.9) 22 (36.1) 66 (48.9) Gleason score at RP
(% of all RP-treated) ≤
3+3 8 (53.3) 4 (18.2) 20 (30.3) 0.007 22(34.9) 300 (61.4) <0.001 3+4 4 (26.7) 9 (40.9) 38 (57.6) 33(52.4) 172 (35.2)
4+3 3 (20) 4 (18.2) 5 (7.6) 7 (11.1) 14 (2.9)
≥8 0 5 (22.7) 3 (4.5) 1 (1.6) 3 (0.6)
Pathologic stage pT2 43 440 <0.001
pT3A 12 38
pT3B 4 5
pT4 4 6
Positive margins (positive/ total), (%)
4 /14 (28.6)
10/23 (43.5)
16/63 (25.4)
0.26 9/63 (14.5) 61/492 (12.4) 0.43
priate selection, some patients with an elevated PSA over 10 ng/mL may be safely followed on AS.
Our results are clinically relevant as many patients are recommended active treatment based on their PSA. One series reports that half of those who “progressed” did so because of a rising PSA.8 In that series PSA at diagnosis was
only predictive of PSA progression, not grade or volume progression. Two series have now reported surveillance out-comes among intermediate risk disease,9,10 though with short
follow-up. Our results resemble those of Cooperberg and colleagues, where most patients appeared to be classified as intermediate risk due to an elevated PSA (median 10.3 ng/ mL).10 Conversely, worse outcomes with intermediate-risk
disease on AS was seen in the ERSPC cohort. In that cohort, most patients had a PSA <10 ng/mL (median 5.3 ng/mL).9
Taken together with our results, this suggests that patients with an elevated PSA over 10 ng/mL as the only criterion for intermediate-risk classification may have equivalent out-comes to low-risk patients.
A PSA may be elevated for reasons other than adeno-carcinoma, with the common causes being benign prostatic hypertrophy and prostatitis. Evidence that these patients are enriched in our cohort is suggested by the higher average prostate volume and a higher proportion of prior negative biopsies in those with PSA >10 ng/mL. The varied RP pathol-ogy and longer follow-up in the cohort of men with a PSA over 10 ng/mL highlights the heterogeneity of the group. The selection of patients likely accounts for the protective hazard ratios for subsequent adverse histology found among those on AS with a PSA >10 ng/mL.
In our series, PSA on multivariate analysis was not clearly predictive of future adverse histology, though we found, as previously reported, that PSA density carries prognostic significance.11 Though not significant, there was a trend for
patients in our cohort with a PSA rising over 10 ng/mL on AS to have a higher Gleason score on follow-up biopsy (Table 2). Adverse histology in this group was also more common in those with a higher baseline PSA (Table 5). Further, a higher incidence of high-grade disease and positive margins at RP among those whose PSA rose over 10 ng/mL on surveillance
(Table 4) confirms that PSA monitoring can still yield import-ant information in identifying significimport-ant cancers.
Conversely, with our selection of patients, no patients who started AS with a PSA over 10 ng/mL had high-grade (Gleason ≥8) disease. This is consistent with prior publi-cations,12,13 that suggest that for low-risk disease baseline
PSA carries limited prognostic value, but is insufficient to discriminate whether surveillance is a safe strategy. Nomograms may allow for modest improvement on these limited test characteristics when the decision is made to pursue AS or immediate treatment.
To understand the patient selection which presumably caused the surprising finding that an elevated PSA was protective against future adverse histology among patients with a baseline PSA over 10 ng/mL, we examined a concur-rent cohort of men with an elevated PSA >10 ng/mL who opted for upfront surgical treatment (Table 6). As well as the expected bias with younger men receiving more immedi-ate treatment, this comparison yielded two considerations which may be useful in selecting patients for surveillance when the PSA is elevated. The enlarged prostate size sug-gests that benign prostatic hyperplasia (BPH) may be the main driver of the elevated PSA, thus creating a selection bias. Another possibility is that BPH itself may play a protec-tive role in prostate cancer progression.14 Minimal volume
of disease, as indicated in core involvement (i.e., 1-2 cores and low percentage of core involvement) also appeared as a selection factor; notably, it was also significantly protective of future histologic reclassification on multivariate analysis (Table 3).
The limitations of this study include a lack of long-term follow-up with definitive endpoints. Despite our efforts to compare the patients on AS with others concurrently treated with RP, we were not able to fully elucidate all selection fac-tors present, such as comorbidity or a diagnosis of prostatitis. The generalizability is also limited by the non-standardized AS surveillance protocols and follow-up. Finally, as a rela-tively small series, non-significant results make be due to inadequate power.
Table 5. Characteristics of men with a PSA rise >10 ng/mL during surveillance stratified by initial PSA (n = 157)
Variables
Baseline PSA group (ng/mL) 0-2
(n = 4)
2-4 (n = 22)
4-6 (n = 38)
6-8 (n = 50)
8-10 (n = 43) Age, mean (SD) 65.9 (3.9) 60.5 (6.4) 62.8 (6.9) 67.5 (7.4) 65.9 (6.2) Time to PSA >10, median (IQR), months 77.9 (38.3-137-9) 40.8 (15.3-61.0) 35.9 (14.8-56.6) 34.1 (15.0-46.9) 20.9 (8.8-32.0) Adverse histology Overall 2 (50) 5 (22.7) 16 (42.1) 26 (52.0) 21 (48.8)
Grade* 1 (25.0) 4 (18.2) 8 (21.1) 24 (48.0) 20 (46.5)
Volume** 1 (25.0) 4 (18.2) 14 (36.8) 16 (32.0) 16 (37.2)
PSAV, median (IQR), ng/mL/yr 0.40 (0.11, 0.65) 0.29 (-0.04, 0.99) 0.34 (-0.33, 1.02) 0.48 (-0.41, 1.17) 0.34 (-0.56, 1.28)
Conclusion
Data from this unique cohort suggests that a strict cut-off PSA value for all AS patients is unwarranted and may result in overtreatment. This study suggests that with appropriate patient selection, patients with very low volume Gleason 6 cancer and a PSA >10 ng/mL may be good candidates for AS. Further follow-up and definitive outcomes assessment are needed.
Competing interests: Dr. Toren, Dr. Wong, N. Timilshina, Dr. Alibhai and Dr. Trachtenberg all declare no competing financial or personal interests. Dr. Finelli has participated in clinical trials in the past 2 years for Amgen, Astellas, Janssen and Ferring. Dr. Fleshner is a member of the Advisory Board for Amgen, Janssen, Astellas and Eli Lily. He has received honoraria from Amgen, Janssen, Astellas and Eli Lily. He is and has participated in clinical trials for Amgen, Janssen, Medivation, OICR, and Prostate Cancer Canada.
This paper has been peer-reviewed.
References
1. Cooperberg MR, Carroll PR, Klotz L. Active surveillance for prostate cancer: Progress and promise. J Clin Oncol 2011;29:3669-76. http://dx.doi.org/10.1200/JCO.2011.34.9738
2. Wilt TJ, Brawer MK, Jones KM, et al. Radical prostatectomy versus observation for localized prostate cancer. N Engl J Med 2012;367:203-13. http://dx.doi.org/10.1056/NEJMoa1113162
3. Loblaw A, Zhang L, Lam A, et al. Comparing prostate specific antigen triggers for intervention in men with stable prostate cancer on active surveillance. J Urol 2010;184:1942-6. http://dx.doi.org/10.1016/j. juro.2010.06.101
4. Carter HB. Differentiation of lethal and non lethal prostate cancer: PSA and PSA isoforms and kinetics. Asian J Androl 2012;14:355-60. http://dx.doi.org/10.1038/aja.2011.141
5. Finelli A, Trottier G, Lawrentschuk N, et al. Impact of 5alpha-reductase inhibitors on men followed by active surveillance for prostate cancer. Eur Urol 2011;59:509-14. http://dx.doi.org/10.1016/j. eururo.2010.12.018
6. Satkunasivam R, Kulkarni GS, Zlotta AR, et al. Pathological, oncologic and functional outcomes of radi-cal prostatectomy following active surveillance. J Urol 2013;190:91-6. http://dx.doi.org/10.1016/j. juro.2013.01.019
7. Wong LM, Trottier G, Toi A, et al. Should follow-up biopsies for men on active surveillance for prostate cancer be restricted to limited templates? Urology 2013;82:405-9. http://dx.doi.org/10.1016/j. urology.2013.03.057
8. Adamy A, Yee DS, Matsushita K, et al. Role of prostate specific antigen and immediate confirmatory biopsy in predicting progression during active surveillance for low risk prostate cancer. J Urol 2011;185:477-82. http://dx.doi.org/10.1016/j.juro.2010.09.095
9. Bul M, van den Bergh RC, Zhu X, et al. Outcomes of initially expectantly managed patients with low or intermediate risk screen-detected localized prostate cancer. BJU Int 2012;110:1672-7. http://dx.doi. org/10.1111/j.1464-410X.2012.11434.x
10. Cooperberg MR, Cowan JE, Hilton JF, et al. Outcomes of active surveillance for men with intermediate-risk prostate cancer. J Clin Oncol 2011;29:228-34. http://dx.doi.org/10.1200/JCO.2010.31.4252 11. Wong LM, Alibhai SM, Trottier G, et al. A negative confirmatory biopsy among men on active surveillance
for prostate cancer does not protect them from histologic grade progression. Eur Urol 2013; http:// dx.doi.org/10.1016/j.eururo.2013.08.060. Epub 2013 Sept 9.
12. Fall K, Garmo H, Andren O, et al. Prostate-specific antigen levels as a predictor of lethal prostate cancer. J Natl Cancer Inst 2007;99:526-32. http://dx.doi.org/10.1093/jnci/djk110
13. Ng MK, Van As N, Thomas K, et al. Prostate-specific antigen (PSA) kinetics in untreated, localized prostate cancer: PSA velocity vs PSA doubling time. BJU Int 2009;103:872-6. http://dx.doi.org/10.1111/ j.1464-410X.2008.08116.x
14. Wadhera P. An introduction to acinar pressures in BPH and prostate cancer. Nat Rev Urol 2013;10:358-66. http://dx.doi.org/10.1038/nrurol.2013.86
Correspondence: Dr. Antonio Finelli, Princess Margaret Cancer Care Centre, 3rd Floor Rm. 130, 610 University Ave., Toronto, ON M5G 2M9; antonio.finelli@uhn.ca
Table 6. Predictors of adverse histology on AS using logistic regression analysis (n= 698)
Odds ratio (95% CI) adverse history (n = 267) vs. no adverse history (n = 431)
Variables Univariable p value Multivariable p value
Age (per decade) 1.57 (1.25-1.95) <0.001 1.67 (1.27-2.01) <0.001 PSA category Baseline PSA >10 0.78 (0.47-1.29) 0.34 0.78 (0.41-1.50) 0.46
PSA rise >10 1.35 (0.94-1.95) 0.10 1.13 (0.71-1.79) 0.61
PSA ≤10 Referent Referent
Baseline PSA ng/mL (per 1-unit increase) 1.02(0.98-1.06) 0.34 Not used
Baseline prostate volume (per 1-unit increase) 0.98 (0.98-0.99) <0.001 0.98 (0.97-0.99) <0.001 Log (baseline PSAD) (per 1-unit increase) 1.06 (1.03-1.09) <0.001 Not used
Baseline DRE palpable nodule yes vs. no 1.56 (1.04-2.35) 0.03 1.21 (0.74-1.97) 0.44 Baseline TRUS nodule present yes vs. no 0.85 (0.61-1.21) 0.38 Not used
Baseline positive biopsy cores 2 vs. 1 1.81 (1.24-2.61) 0.002 1.42 (0.92-2.19) 0.11 3 vs. 1 3.09 (1.73-5.54) <0.001 2.73 (1.33-5.62) 0.006 Baseline maximum % core involvement (per 10-unit
increase) 1.76 (1.38-2.45) <0.001 1.66 (1.23-2.24) <0.001
Baseline total number of cores taken (per 1-unit increase) 0.89 (0.85-0.94) <0.001 0.92 (0.87-0.98) 0.006
5ARI use yes vs. no 0.57 (0.37-0.87) <0.001 0.50 (0.29-0.85) 0.01
Time to confirmatory biopsy, months 1.02 (1.01-1.02) 0.002 1.01 (0.99-1.02) 0.08
Follow-up time, months 1.01 (1.00-1.01) 0.01 1.01 (1.00-1.01) 0.01