P R O C E E D I N G S
Open Access
Using gene expression data to identify
causal pathways between genotype and
phenotype in a complex disease:
application to Genetic Analysis Workshop
19
Holly F. Ainsworth
*and Heather J. Cordell
FromGenetic Analysis Workshop 19 Vienna, Austria. 24-26 August 2014
Abstract
We explore causal relationships between genotype, gene expression and phenotype in the Genetic Analysis Workshop 19 data. We compare the use of structural equation modeling and a Bayesian unified framework approach to infer the most likely causal models that gave rise to the data. Testing an exhaustive set of causal relationships between each single-nucleotide polymorphism, gene expression probe, and phenotype would be computationally infeasible, thus a filtering step is required. In addition to filtering based on pairwise associations, we consider weighted gene correlation network analysis as a method of clustering genes with similar function into a small number of modules. These modules capture the key functional mechanisms of genes while greatly
reducing the number of relationships to test for in causal modeling.
Background
Even though genome-wide association studies (GWAS) have been very successful over the past decade at identi-fying genetic variants associated with disease, the mech-anism underlying these associations is generally not known. It is hoped that gene expression data could pro-vide the missing link between genotype and phenotype. We are interested in exploring causal relationships be-tween genotype data, gene expression data, and phenotype.
There exist many techniques for causal analysis which could be applied to the Genetic Analysis Workshop 19 (GAW19) data. We choose to focus on structural equa-tion modeling (SEM) and a Bayesian unified framework (BUF) approach [1]. For both of these methods, graph-ical models provide a natural framework for describing
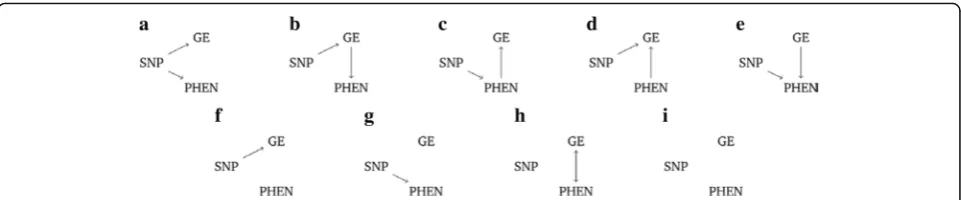
causal relationships. Suppose we have data from a single single-nucleotide polymorphism (SNP), gene expression measurements from a single probe, and data on a phenotype of interest. Some possible causal models are illustrated in Fig. 1. In this framework, nodes represent measured variables and the presence of a directed arrow between two nodes implies a causal link.
In Fig. 1 causal scenario (a), the SNP affects both gene expression (GE) and phenotype (PHEN) independently. Scenario (b) represents the situation where the pheno-type is indirectly influenced by the SNP through gene expression. Conversely, in scenario (c), gene expression is indirectly influenced by the SNP via the phenotype. Scenarios (d) to (i) depict further possible causal scenar-ios; the absence of an arrow between variables represents the lack of a causal relationship.
* Correspondence:[email protected]
Institute of Genetic Medicine, Newcastle University, International Centre for Life, Central Parkway, Newcastle upon Tyne NE1 3BZ, UK
Methods
We performed quality control (QC) on the GAW19 GWAS (SNP) data [2] using standard procedures out-lined in Anderson et al [3]. Individual level QC resulted in 4 individuals being excluded as a result of no geno-type data being available. A further individual was ex-cluded because of outlying ethnicity. SNP level QC removed 43,986 SNPs with low frequency (minor allele frequency <1 %) and 109 SNPs with high rates of missingness.
Gene expression measurements as described in Göring et al [4] are available on 638 of the individuals for whom we have GWAS data. For the causal analysis we decided to focus on the real phenotypes systolic (SBP) and dia-stolic blood pressure (DBP) and we only included indi-viduals for whom we have both GWAS and gene expression data. For each of the phenotypes, we adjusted for covariates using linear regression and took the aver-age of the residuals over the different time points within an individual as our final phenotype. Covariates in the models included age, medication status, smoking status, and (for DBP) age squared. This replicates the analysis performed by Eu-Ahsunthornwattana et al [5].
Filtering
Rather than conducting causal analysis for every possible trio of SNP, gene expression, and phenotype measure-ments, a filtering step was undertaken to identify poten-tially interesting trios (see, eg, Liu et al [6] and Shin et al [7]). First, association analysis was conducted to identify gene expression probes that were correlated with the phenotypes. This was done separately for SBP and DBP using linear regression with the gene expression mea-surements corrected for sex. For gene expression probes that showed an association with phenotype, a genome-wide association scan was carried out with gene expres-sion as the phenotype. This analysis was carried out using the Factored Spectrally Transformed Linear Mixed Model (FaST-LMM) software [8], which models related-ness between individuals as estimated through genome-wide SNP data. SNPs that showed an association with the gene expression probes were retained. The end result
of this filtering step is a significantly reduced number of trios of SNP/gene expression/phenotype variables on which to perform causal analysis.
Weighted gene correlation network analysis
An alternative to the above filtering step is to use the weighted gene correlation network analysis (WGCNA) approach [9], which allows us to group genes into a rela-tively small number of modules (clusters). These mod-ules contain sets of highly correlated genes based on their gene expression measurements. Each module can be summarized by an eigengene that can be taken for-ward to be used in further analyses. This process is de-scribed in Ghazalpour et al [10].
Causal modeling
Causal modeling was performed for all trios of SNP, gene expression, and phenotype that remained following filtering, using the 2 methods outlined below.
Structural equation modeling (SEM)
SEM is a regression-based approach to causal modeling. A system of linear equations can be constructed based on the relationships between nodes in the graphical model. The parameters in the model can be estimated using maximum likelihood and the fit of the model eval-uated using appropriate statistical tests. When more than 1 causal model is tested, the one with the lowest Akaike information criterion (AIC) can be thought of as representing the most plausible underlying causal mechanism.
A selection of possible causal models which can be tested in the SEM framework are depicted in Fig. 1. Note that biologically implausible models (ie, any model in which the SNP is causally affected by another vari-able) have been omitted.
Bayesian unified framework (BUF)
The BUF [1] is a flexible approach that can be used for univariable and multivariable testing. The approach has its foundations in Bayesian model comparison and model averaging. This approach partitions variables in
Table 1Results of causal analysis using gene expression probes
SNP Preferred model
SNP name Chromosome (bp position) Gene expression probe Phenotype SEM BUF rs9869956 3 (155164342) GI42661149 SBP (b) (b) rs11709568 3 (155177333) GI42661149 SBP (b) (b) rs6440993 3 (155180174) GI42661149 SBP (b) (b) rs9829532 3 (155181831) GI42661149 SBP (b) (b) rs7618495 3 (155184048) GI42661149 SBP (b) (a) rs4680185 3 (155213002) GI42661149 SBP (b) (b) rs822711 3 (165003805) GI42661149 SBP (b) (b) rs4921240 5 (159327355) GI42661149 SBP (b) (b) rs9640732 7 (78320848) GI42661149 SBP (b) (b) rs13246026 7 (78331066) GI42661149 SBP (b) (b) rs7793494 7 (78344389) GI42661149 SBP (b) (b) rs11768116 7 (78345207) GI42661149 SBP (b) (b) rs13242288 7 (78345298) GI42661149 SBP (b) (b) rs7779874 7 (78346879) GI42661149 SBP (d) (b) rs757395 7 (78356891) GI42661149 SBP (b) (f) rs1888238 7 (78390300) GI42661149 SBP (b) (b) rs13308578 7 (78408559) GI42661149 SBP (b) (b) rs7038267 9 (4821348) GI42661149 SBP (d) (f) rs34868670 5 (40237843) GI7706275 SBP (d) (a) rs10246727 7 (152876977) GI7706275 SBP (b) (b) rs2451078 13 (20098289) GI7706275 SBP (d) (a) rs1570621 13 (47170118) GI7706275 SBP (d) (f) rs4942556 13 (47174585) GI7706275 SBP (b) (b) rs1105813 17 (7721542) GI7706275 SBP (d) (f)
the model into subsets γ¼ðU;D;IÞ with respect to a predictor variable, in our case the SNP. The variables in
Uare unassociated with the SNP, the variables in Dare directly associated with the SNP and variables in I are indirectly associated with the SNP. For each possible partition, a Bayes’ factor is computed; the model with the highest Bayes’ factor can be interpreted as the one that best fits the data. For example, if the model with the highest Bayes’factor classifies gene expression as dir-ectly associated with the SNP (D) and phenotype as in-directly associated with the SNP (I) then this is equivalent to model (b) in Fig. 1.
Results
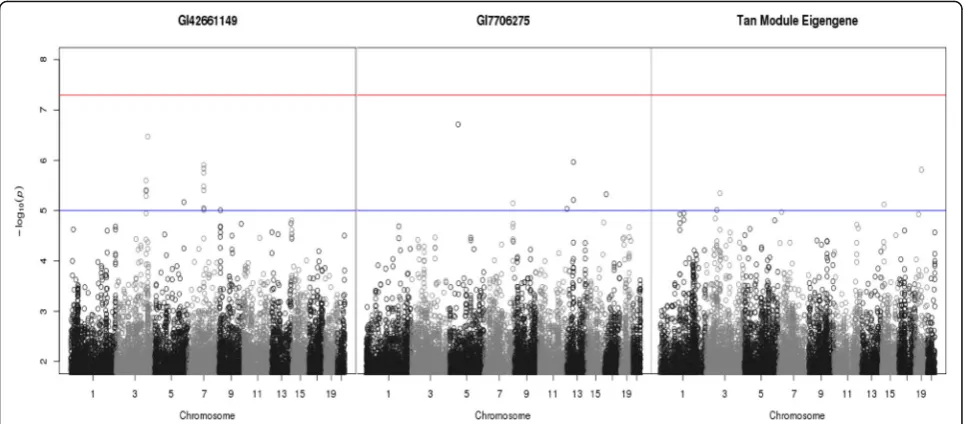
The first filtering step identified 2 gene expression probes that showed marginally significant correlation (−log10 p value >5) with SBP. These were GI42661149,
for which no further information was given in the map file, and GI7706275, which lies in the gene TPPP3 on chromosome 16 at coordinates 67423801 bp to 67423850 bp. Two GWAS were performed using these gene expression probes as the phenotype (Fig. 2). All SNPs that showed marginal significance (−log10 pvalue
>5) with either gene expression probe (a total of 24 SNPs) were taken forward to be used in causal analysis.
Table 1 shows the results of causal analysis. In 16 cases, both SEM and BUF agreed that the causal rela-tionships should be classified as model (b). In the other 8 cases, SEM and BUF disagreed. For example, in 3 cases the causal relationships were classed as model (d) by SEM and as model (f ) by BUF. Model (d) represents the scenario where gene expression is influenced independ-ently by both SNP and phenotype, while model (f ) rep-resents the scenario whereby gene expression is directly associated with SNP and phenotype is unassociated with SNP. Note that (d) is not currently tested for by BUF, and (f ) is not tested for by SEM.
Weighted gene correlation network analysis method
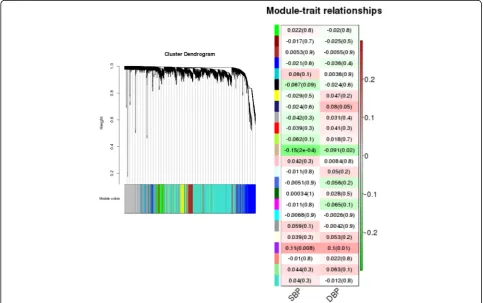
The WGCNA package in R [9] was used to cluster gene expression measurements into modules (typically identi-fied by different colors). A total of 24 modules were iden-tified; a dendrogram depicting the results of this clustering can be viewed in Fig. 3 (left-hand plot). For each module, the gene expression profile is summarized by a module eigengene. The correlation between the module eigengene and the phenotypes (SBP and DBP) was tested for each module (Fig. 3, right-hand plot). There was 1 module/phenotype pairing (the tan colored module and SBP) that was statistically significant (p value = 0.0002)
using a Bonferroni correction to set the appropriate threshold to account for multiple testing.
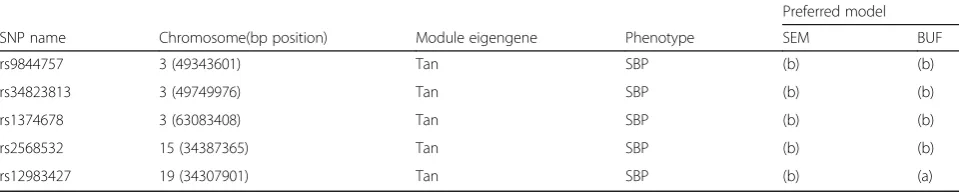
A GWAS was performed using the tan module eigen-gene as the phenotype (see right-hand plot of Fig. 2). This returned 5 SNPs that showed modest significance with the phenotype. These SNPs were taken forward to be used in causal analysis and Table 2 shows the results. As previously, in the majority of cases, both SEM and BUF suggested that the inferred causal relationship should be (b). There was also 1 case where SEM sug-gested (b) and BUF sugsug-gested (a).
Discussion
Two methods for causal inference were implemented to identify causal pathways between SNP, gene expression, and phenotype. Attempting causal analysis without a stringent filtering process would not be possible and WGCNA provides a convenient tool in this process. SEM and BUF were generally in agreement in their as-sessment of the underlying causal model, although the true underlying causal mechanisms are not known, so these inferences cannot be validated. However, when SEM and BUF disagreed, it must be noted that the dif-ference in Bayes’ factors between competing models in the BUF approach was very small.
SEM has the advantage of allowing models such as model (d), whereby the phenotype affects gene expression independently from the SNP, to be tested; in the BUF ap-proach, this relationship is not routinely tested. Despite this, the BUF approach is more flexible than SEM because in BUF, an exhaustive set of partitions for variables is automatically tested for; this could be especially useful if there were a large number of variables in the model.
A direct comparison between filtering and WGCNA is not straightforward; however, we note that there are no overlapping gene expression probes between the tan mod-ule and the probes obtained using filtering. WGCNA takes approximately 1.5 hours to run and the tan module eigengene accounts for 2.1 % of the variation in SBP. However, filtering takes only a few minutes and the 2 gene expression probes identified account for 3.6 % and 2.8 %, respectively, of the variation in SBP.
For our purposes, both SEM and BUF are very quick to perform, with both methods taking no more than a couple of seconds. However, it must be noted that when we consider the computational cost of our methods, we are focusing on the very simple case where we have only 3 variables. Where many more variables are present, we suggest more investigation is required to assess the scal-ability of SEM, BUF and WGCNA.
We also considered performing causal analysis on the simulated phenotypes in the GAW19 data set. However, at the first filtering step we failed to recover any signifi-cant associations between phenotype and gene expres-sion probes located in genes that featured in the true underlying simulation model. Consequently, we did not proceed any further with causal analysis.
Conclusions
Two methods for causal inference were implemented to identify causal pathways between SNP, gene expression, and phenotype on the reduced number of trios. The methods displayed reasonably good concordance with the same causal model being identified the majority of the time. Both methods were easy and quick to imple-ment for the simple cases we considered in this analysis. However, using these methods for an analysis with many more variables would require careful thought.
Acknowledgements
Support for this work was provided by the Wellcome Trust (grant references 087436/Z/08/Z and 102858/Z/13/Z).
Declarations
This article has been published as part ofBMC ProceedingsVolume 10 Supplement 7, 2016: Genetic Analysis Workshop 19: Sequence, Blood Pressure and Expression Data. Summary articles. The full contents of the supplement are available online at http://bmcproc.biomedcentral.com/ articles/supplements/volume-10-supplement-7. Publication of the proceedings of Genetic Analysis Workshop 19 was supported by National Institutes of Health grant R01 GM031575.
Authors’contributions
HFA conducted the statistical analysis and drafted manuscript. HJC conceived the overall study and critically revised the manuscript. Both authors read and approved the final manuscript. HFA and HJC contributed equally to this work.
Competing interests
The authors declare that they have no competing interests.
Table 2Results of causal analysis using WGCNA
Published: 18 October 2016
References
1. Stephens M. A unified framework for association analysis with multiple related phenotypes. PLoS One. 2013;8(7):e65245.
2. Blangero J, Teslovich TM, Sim X, Almeida MA, Jun G, Dyer TD, Johnson M, Peralta JM, Manning AK, Wood AR, et al. Omics squared: human genomic, transcriptomic, and phenotypic data for Genetic Analysis Workshop 19. BMC Proc. 2015;9 Suppl 8:S2.
3. Anderson CA, Pettersson FH, Clarke GM, Cardon LR, Morris AP, Zondervan KT. Data quality control in genetic case-control association studies. Nat Protoc. 2010;5(9):1564–73.
4. Göring HH, Curran JE, Johnson MP, Dyer TD, Charlesworth J, Cole SA, Jowett JB, Abraham LJ, Rainwater DL, Comuzzie AG, et al. Discovery of expression QTLs using large-scale transcriptional profiling in human lymphocytes. Nat Genet. 2007;39(10):1208–16.
5. Eu-Ahsunthornwattana J, Howey RA, Cordell HJ. Accounting for relatedness in family based association studies: application to genetic analysis workshop 18 data. BMC Proc. 2014;8 Suppl 1:S79.
6. Liu Y, Aryee MJ, Padyukov L, Fallin MD, Hesselberg E, Runarsson A, Reinius L, Acevedo N, Taub M, Ronninger M, et al. Epigenome-wide association data implicate dna methylation as an intermediary of genetic risk in rheumatoid arthritis. Nat Biotechnol. 2013;31(2):142–7.
7. Shin SY, Petersen AK, Wahl S, Zhai G, Römisch-Margl W, Small KS, Döring A, Kato BS, Peters A, Grundberg E, et al. Interrogating causal pathways linking genetic variants, small molecule metabolites, and circulating lipids. Genome Med. 2014;6(3):25.
8. Lippert C, Listgarten J, Liu Y, Kadie CM, Davidson RI, Heckerman D. Fast linear mixed models for genome-wide association studies. Nat Methods. 2011;8(10):833–5.
9. Langfelder P, Horvath S. WGCNA: an R package for weighted correlation network analysis. BMC Bioinformatics. 2008;9:559.
10. Ghazalpour A, Doss S, Zhang B, Wang S, Plaisier C, Castellanos R, Brozell A, Schadt EE, Drake TA, Lusis AJ. Integrating genetic and network analysis to characterize genes related to mouse weight. PLoS Genet. 2006;2(8), e130.
• We accept pre-submission inquiries
• Our selector tool helps you to find the most relevant journal • We provide round the clock customer support
• Convenient online submission • Thorough peer review
• Inclusion in PubMed and all major indexing services • Maximum visibility for your research
Submit your manuscript at www.biomedcentral.com/submit