R E S E A R C H A R T I C L E
Open Access
Paternal psychological response after
ultrasonographic detection of structural fetal
anomalies with a comparison to maternal
response: a cohort study
Anne Kaasen
1,2*, Anne Helbig
2,3†, Ulrik Fredrik Malt
4,5†, Tormod Naes
6†, Hans Skari
7†and Guttorm Nils Haugen
3,5†Abstract
Background:In Norway almost all pregnant women attend one routine ultrasound examination. Detection of fetal structural anomalies triggers psychological stress responses in the women affected. Despite the frequent use of ultrasound examination in pregnancy, little attention has been devoted to the psychological response of the expectant father following the detection of fetal anomalies. This is important for later fatherhood and the psychological interaction within the couple. We aimed to describe paternal psychological responses shortly after detection of structural fetal anomalies by ultrasonography, and to compare paternal and maternal responses within the same couple.
Methods:A prospective observational study was performed at a tertiary referral centre for fetal medicine. Pregnant women with a structural fetal anomaly detected by ultrasound and their partners (study group,n=155) and 100 with normal ultrasound findings (comparison group) were included shortly after sonographic examination (inclusion period: May 2006-February 2009). Gestational age was >12 weeks. We used psychometric questionnaires to assess self-reported social dysfunction, health perception, and psychological distress (intrusion, avoidance, arousal, anxiety, and depression): Impact of Event Scale. General Health Questionnaire and Edinburgh Postnatal Depression Scale. Fetal anomalies were classified according to severity and diagnostic or prognostic ambiguity at the time of assessment.
Results:Median (range) gestational age at inclusion in the study and comparison group was 19 (12–38) and 19 (13–22) weeks, respectively. Men and women in the study group had significantly higher levels of psychological distress than men and women in the comparison group on all psychometric endpoints. The lowest level of distress in the study group was associated with the least severe anomalies with no diagnostic or prognostic ambiguity (p < 0.033). Men had lower scores than women on all psychometric outcome variables. The correlation in distress scores between men and women was high in the fetal anomaly group (p < 0.001), but non-significant in the comparison group.
(Continued on next page)
* Correspondence:a.kaasen@online.no †Equal contributors
1Department of Health, Nutrition and Management, Oslo and Akershus University College of Applied Sciences, P.O.Box 4, St. Olavs Plass, NO-0130 Oslo, Norway
2
National Resource Centre for Women’s Health, Oslo University Hospital, Oslo, Norway
Full list of author information is available at the end of the article
(Continued from previous page)
Conclusion:Severity of the anomaly including ambiguity significantly influenced paternal response. Men reported lower scores on all psychometric outcomes than women.
This knowledge may facilitate support for both expectant parents to reduce strain within the family after detection of a fetal anomaly.
Keywords:Fetal anomaly, Paternal psychological response, Pregnancy, Prenatal diagnosis, Psychological distress, Ultrasonography
Background
In Norway about 98% of pregnant women attend the routine ultrasound examination at 18 weeks of gestation. Detection of fetal structural anomalies triggers psychological stress responses in the women affected [1]. The expectant fathers will also be emotionally affected, not in the least because most men are present at these ultrasound examinations. The father’s response will most likely influence the mother’s response (and vice versa), according to observations made in studies on responses to stressful life events in couples [2]. Nevertheless, little is known about men’s psychological reaction following the detection of a fetal anomaly in their partner’s pregnancy, including the influence of background variables on these responses. In a study by Skari et al. [3], men reported lower postpartum levels of distress than women after prenatal detection of a fetal anomaly. The responses were stronger than those seen if the anomaly was detected after birth. However, that study did not address the association between the psychological response and the severity of the anomaly, and all distress assessments were performed postpartum.
From studies addressing the impact of routine ultrasound examination on the psychological well-being of expecting parents, we know that men report less distress symptoms compared to women [4]. In these studies, also non-pregnancy related variables are predictors of distress responses (e.g. poor marital relationship and poor social networks) [5, 6]. On the other hand, expectant fathers with insufficient information about pregnancy and childbirth showed somewhat increased risk of being distressed [7]. However, one study conducted among partners with a child with congenital anomaly reported no significant difference in overall burden and grief between mothers and fathers one year after birth [8].
Objective
In a previous study we showed that maternal psychological distress shortly after detection of a fetal malformation was related to the severity of the anomaly, diagnostic and prognostic ambiguity, and gestational age [1]. The aim of the present study was to describe the acute psychological and behavioural responses, i.e. social dysfunction, health perception (somatic symptoms) and psychological distress (symptoms of intrusion, avoidance, arousal, anxiety and
depression) in partners of pregnant women shortly after detection of a fetal structural anomaly, and compare these results to partners of women with normal ultra-sound findings. We hypothesised that the distress level was related to severity of the anomaly, diagnostic and prognostic ambiguity, and advanced gestational age. We also expected higher levels of psychological and behavioural distress compared to those with normal ultra-sound findings. Men were expected to report lower scores than their partners.
Methods
Participants
Pregnant women and their partners were included consecutively from May 2006 to February 2009. Con-venience sampling for both groups was undertaken, i.e. inclusion of subjects was not performed during vaca-tions and in periods with heavy clinical workload. This paper concerns the responses of the fathers. The women (and their partners) were excluded if they were not fluent in Norwegian, were less than 18 years old, had an overt psychiatric diagnosis (e.g. psychosis, severe bipolar disorder, or drug abuse), or the woman expected multiplets.
The study group consisted of 155 male partners of pregnant women with confirmed fetal structural anomalies detected by ultrasound. The women were referred to our tertiary referral centre based on suspicion of a structural fetal anomaly during obstetric ultrasound examination after 12 gestational weeks (median 134, range 84–269 gestational days).
The comparison group included 100 male partners of women scheduled for delivery at our hospital. They had no history of fetal anomalies or severe obstetric complications, and were included following a routine ultrasound scan with normal findings (median 136, range 90–155 gestational days).
Ultrasound examination and counseling
The ultrasound examinations at our tertiary centre were performed by consultants in fetal medicine. Before inclusion all couples were counselled by the fetal medicine specialists and specialists in pediatrics, pediatric surgery, pediatric cardiology, medical genetics, or neurosurgery, as required.
Classification of fetal anomaly
Fetal diagnoses were classified according to severity and significant prognostic or diagnostic ambiguity at the time of inclusion. Ambiguity was defined as: a) the anomaly had significant inherent prognostic variation, or b) a defin-ite diagnosis was dependent on the results of further investigations (e.g. an invasive test). See Table 1, footnotes. If the results of further investigations were assumed to be important for the diagnosis or prognosis, severity was categorised as “severity not classified; anomaly awaiting clarification”. Fetal diagnoses were classified as previously described in Kaasen et al. [1], see Table 1. Classification was performed by three of the authors. Inter-rater agreement was high (κ= 0.86); for details see [1, 9].
Psychometric questionnaires
Participating men completed the questionnaires within a few days after the ultrasound examination at our tertiary referral centre. The questionnaires were completed at the hospital (a few men in the comparison group filled out the questionnaires at home) and the participants were instructed not to discuss their responses before completion. Social dysfunction and health perception (somatic symptoms) were assessed by the corresponding subscales of General Health Questionnaire (GHQ-28) [10]. Endpoints of psychological distress were assessed by the anxiety and depression subscales of GHQ-28, Impact of Events Scale (IES-22) [11, 12], and Edinburgh Postnatal Depression Scale (EPDS) [13].
IES-22 measures three subscales of psychological and behavioural distress during the previous week: intrusion (7 items), avoidance (8 items), and arousal (7 items). Intru-sion is characterised by unbidden thoughts and images, troubled dreams, strong waves of feelings, and repetitive behaviour, related to the experience of knowing about the fetal condition. Avoidance includes ideational constriction related to the fetal condition, denial of the consequences of the anomaly, blunted sensations, behavioural inhibition, and emotional numbness. Arousal measures distress-asso-ciated psycho-physiological activation and includes items addressing anger and irritability, a heightened startle re-sponse, concentration difficulties, and hypervigilance. Each IES item has a score range of 0–5 yielding a scoring range of 0–35 for intrusion and arousal, and 0–40 for avoidance. A score < 9 in any of the dimensions was considered to be within the normal range, 9–19 was defined as a moderate
response, while 20 or more indicated intrusion, avoidance, or arousal of clinical importance [14].
GHQ-28 has four subscales, each with seven items, measuring social dysfunction, health perception (somatic symptoms) and psychological distress (anxiety and severe depressive symptoms) during the preceding two weeks. Likert scoring (item scores 0-1-2-3, total range 0–84) was used to compare distress levels within and between groups. Case score is a dichotomous scoring method (item scores 0-0-1-1). The GHQ-28 sum case score provides an estimate of the prevalence of clinically significant psychological distress, defined as a sum case score≥6 (total range 0–28). Clinically significant depression was defined as a GHQ-28 depression subscale case score≥2. GHQ items 24, 25, 27, and 28, were used to assess suicidal ideation [15].
The EPDS consists of ten questions and is a self-rating scale designed to detect postnatal depression. Five items measure dysphoric mood, two measure anxiety, and three (one per item) measure guilt, suicidal ideas, and “not coping”experienced during the previous week. The EPDS-10 has been validated for use during pregnancy, including men [16, 17]. We scored the EPDS-10 with Likert’s score (item score 0-1-2-3; total sum score range 0–30). EPDS sum score≥10 was considered to be associated with mild depression and a score≥13 was used to identify at least moderate depression [18, 19].
Statistics
Sample size calculation was based on Skari et al. [3] who reported that GHQ sum Likert scores differed by ⅔ SD for parents of fetuses diagnosed at 25 – 30 weeks of gestational age compared to those diagnosed earlier in pregnancy. Each gestational age group (see Table 1) would require 40 patients to obtain the same difference with α= 0.05 and a statistical power of 85%. Effect size was assessed by Cohen’s d.
The questionnaires were optically readable. Completed questionnaires were scanned with Cardiff TeleForm version 10.1 (Autonomy Corporation plc, Cambridge, England), and stored in Access version 97 (Microsoft Corporation, Redmond, Washington). Calculations were performed with SPSS version 18.0 (Statistical Package for the Social Sciences, SPSS Inc., Chicago, Illinois).
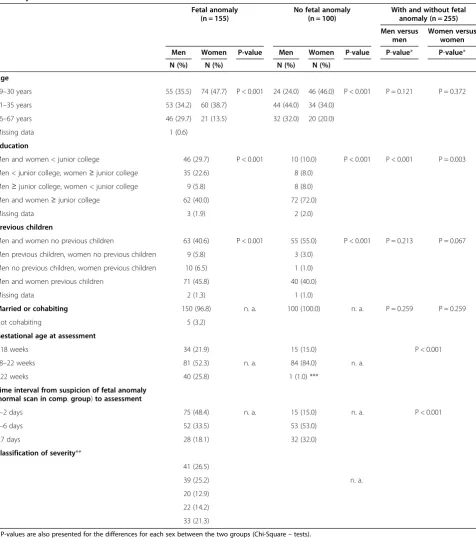
Table 1 Characteristics for men and women in groups with and without fetal anomaly, shortly after detection of fetal anomaly or normal ultrasound scan
Fetal anomaly (n = 155)
No fetal anomaly (n = 100)
With and without fetal anomaly (n = 255)
Men versus men
Women versus women
Men Women P-value Men Women P-value P-value* P-value*
N (%) N (%) N (%) N (%)
Age
19–30 years 55 (35.5) 74 (47.7) P < 0.001 24 (24.0) 46 (46.0) P < 0.001 P = 0.121 P = 0.372 31–35 years 53 (34.2) 60 (38.7) 44 (44.0) 34 (34.0)
36–67 years 46 (29.7) 21 (13.5) 32 (32.0) 20 (20.0)
Missing data 1 (0.6)
Education
Men and women < junior college 46 (29.7) P < 0.001 10 (10.0) P < 0.001 P < 0.001 P = 0.003
Men < junior college, women≥junior college 35 (22.6) 8 (8.0)
Men≥junior college, women < junior college 9 (5.8) 8 (8.0)
Men and women≥junior college 62 (40.0) 72 (72.0)
Missing data 3 (1.9) 2 (2.0)
Previous children
Men and women no previous children 63 (40.6) P < 0.001 55 (55.0) P < 0.001 P = 0.213 P = 0.067
Men previous children, women no previous children 9 (5.8) 3 (3.0)
Men no previous children, women previous children 10 (6.5) 1 (1.0)
Men and women previous children 71 (45.8) 40 (40.0)
Missing data 2 (1.3) 1 (1.0)
Married or cohabiting 150 (96.8) n. a. 100 (100.0) n. a. P = 0.259 P = 0.259
Not cohabiting 5 (3.2)
Gestational age at assessment
<18 weeks 34 (21.9) 15 (15.0) P < 0.001
18–22 weeks 81 (52.3) n. a. 84 (84.0) n. a.
>22 weeks 40 (25.8) 1 (1.0) ***
Time interval from suspicion of fetal anomaly
(normal scan in comp.group)to assessment
0–2 days 75 (48.4) n. a. 15 (15.0) n. a. P < 0.001
3–6 days 52 (33.5) 53 (53.0)
≥7 days 28 (18.1) 32 (32.0)
Classification of severity**
1 41 (26.5)
2 39 (25.2) n. a.
3 20 (12.9)
4 22 (14.2)
5 33 (21.3)
* P-values are also presented for the differences for each sex between the two groups (Chi-Square–tests). ** Classification of severity of anomaly.
1: Lethal or serious with no available treatment, with or without prognostic ambiguity (e.g., acrania, skeletal dysplasia with small thorax, holoprosencephaly). 2: Serious with available treatment but all with prognostic ambiguity (e.g. myelomeningocele with hydrocephalus, hypoplastic left heart syndrome). 3: Mild to moderate severity with available treatment, often with good result, but all with prognostic ambiguity (e.g. bilateral clubfoot or cleft lip with no other markers, but condition known to be associated with syndromes not apparent prenatally). 4: Mild to moderate severity with available treatment, often with good result, without prognostic ambiguity (e.g. gastroschisis, unilateral clubfoot). 5: Severity not classified; awaiting clarification, all with prognostic or diagnostic ambiguity. Prognosis highly dependent on the results of an invasive test (e.g. omphalocele, bilateral clubfoot with chromosomal soft markers), or a reliable diagnosis was not available at inclusion due to an incomplete ultrasound examination (e.g. maternal obesity).
expected cell frequency were fulfilled. To study correlation between men and women (within the couple) we used Spearman’s Rho.
ANOVA was first performed with each of the inde-pendent variables separately. Subsequently, a full analysis was run of all the relevant independent variables with all possible two-way interaction effects for each of the responses. Interaction effects with p > 0.1 were excluded. After reanalysing the data, the interaction effects with p < 0.05 were included in the final model. To control the overall significance of the test for those variables with more than two levels we used Tukey’s HSD post hoc test for detailed analyses of the effects. This meth-odology is underlying all statements in the results section when more than one level was used. Standard residual plots were used for model evaluation. Levene’s test of equality of error variances was used to test the assumptions underlying the analysis of variance. We used a significance level > 0.05 to avoid violation of the assumption of homogeneity of variance.
Ethical issues
The study was approved by the Regional Ethics Committee of Southern Norway December 21st 2005 (Reference number S-05281). Written informed consent was obtained before participation. In accordance with the study protocol, any participant with a case score of‘1’on items addressing suicidal ideation was contacted for clinical evaluation within the same day, and if necessary, offered psychiatric assistance.
Results
The mean paternal age was almost the same in the study-and comparison group; 33 (SD 6) study-and 34 years (SD 5), respectively. Age within gender category did not differ between the groups (p > 0.120). In both groups men were significantly older than women (p < 0.001). In the study group, more men than women had junior college or less (52% versus 35%, p < 0.001). There was no such difference in education in the comparison group. For other back-ground variables see Table 1.
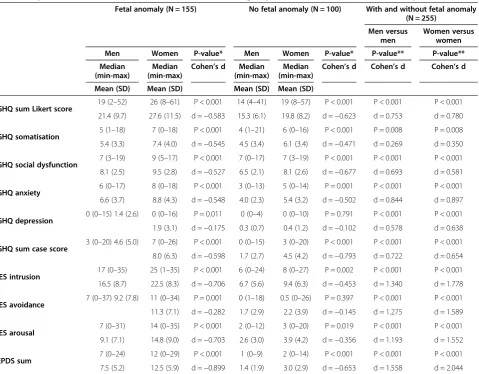
All psychometric responses were higher in the study group than in the comparison group (Table 2). Within both groups all psychometric responses were significantly lower in men than in women, except for GHQ depression and IES avoidance in the comparison group. These two scores also had a small effect size (Table 2). The differ-ences between the groups and genders are also illustrated by the number of men and women who scored above conventional cut-off levels (Table 3).
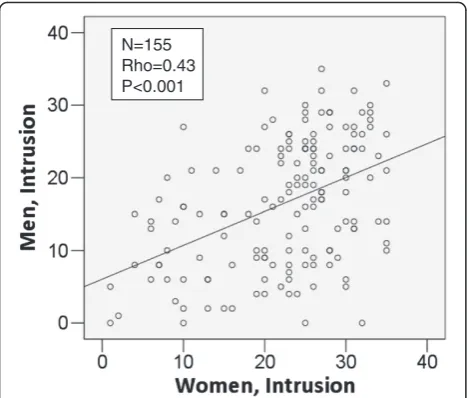
In the study group the correlations in psychometric scores within the couples were highly significant for all psychometric endpoints (i.e. IES intrusion, avoidance, arousal, GHQ sum Likert, and EPDS sum) with p < 0.001,
see one example, Figure 1. No significant correlations were observed in the comparison group.
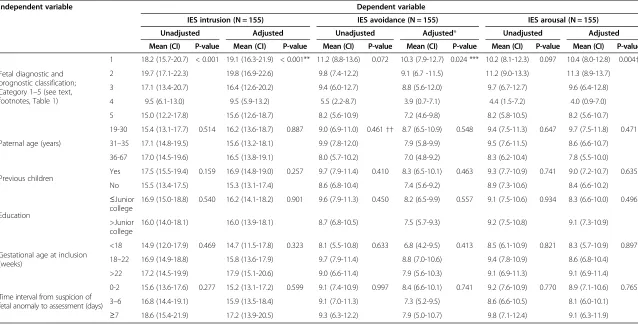
We performed unadjusted ANOVAs for the men in the study group, with six independent variables (i.e., severity of fetal anomaly, paternal age, number of previous chil-dren, education, gestational age at assessments, and time interval from suspicion of fetal anomaly to assessments). The outcome variables were IES intrusion, avoidance, and arousals, GHQ sum Likert, and EPDS sum. Fetal diagnostic and prognostic severity with inherent ambiguity was the only explanatory factor that reached statistical sig-nificance concerning three of the psychometric measures (Tables 4 and 5).
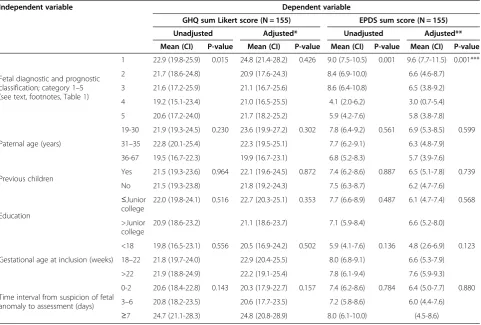
Adjusted ANOVAs in the study group of men with the same explanatory variables showed that diagnostic and prognostic severity of fetal anomaly was significant for all IES subscales (i.e. intrusion, p < 0.001; avoidance, p = 0.024; arousal, p = 0.004) and sum EPDS (p = 0.001). GHQ sum Likert did not reach significance (p = 0.426). There were no consistent patterns in the interactions among components, see Table 5.
Post hoc tests (Tukey HSD test) showed that the men in the category“Mild to moderate severity with available treatment, often with good result, without prognostic ambiguity” had significantly lower scores than the men in the other categories as presented in Table 4 for IES and Table 5 for EPDS.
Discussion
Expectant fathers experienced psychological distress after prenatal detection of a fetal anomaly. We observed a significant difference in all psychometric assessments between the men in the fetal anomaly group and the men in the group with no fetal anomaly, e.g. mean (SD) values for IES intrusion were 16.5 (8.7) and 6.7 (5.6), respectively. Distress levels were lower than for the women in the respective groups. This pattern concurs with findings by Skari et al. [15] in fathers after the birth of a healthy baby versus a baby with a prenatally detected congenital malformation [3]. Epidemiological studies of distress have also reported lower scores in men than in women [20]. The reason for this dissimilarity may be due to gender-specific differences in the experience of pregnancy and the biology of reproduction; paternal experience has to either be through the woman or to be theoretical [21].
After prenatal detection of a fetal anomaly both parents will experience psychological shock and acute grief [22]. In our study, the only independent variable that predicted paternal stress levels was the prognostic classification of fetal anomalies, as shown in Tables 4 and 5. For many of the cases, the prognosis was ambiguous because the prenatal diagnosis was known to have significant inherent prognostic variation. At the time of psychometric assess-ment 33 pregnant women and their partners were awaiting further diagnostic classification, either because the diagnosis was highly dependent on the results of an invasive test or because the ultrasonographic examination was technically incomplete. The counseling was performed on the basis of these uncertainties. The category with best prognosis and no ambiguity (category 4) caused the lowest distress levels, as expected. In the adjusted analyses the p-values
were < 0.025 for all distress scores with the exception of GHQ sum Likert score (Tables 4 and 5). GHQ measures general health perception, social dysfunction and psycho-logical distress during the last two weeks, and is not related to any specific event. This may explain why this measure (GHQ sum Likert score) did not reach significance, even though the score in the fetal anomaly group was elevated compared to the group without fetal anomaly.
Matthey et al. [16] discussed the antenatal use of EPDS to measure mood in expectant fathers. They concluded that EPDS is a reliable and valid measure, but that the cut-off point for clinical significant psychological distress level in fathers is two points lower than in mothers for depression and anxiety. Their argument is the question on crying, in which there was a significant difference in
Table 2 Psychometric scores for men and women within each group, i.e. with and without fetal anomaly
Fetal anomaly (N = 155) No fetal anomaly (N = 100) With and without fetal anomaly (N = 255)
Men versus men
Women versus women
Men Women P-value* Men Women P-value* P-value** P-value**
Median (min-max)
Median (min-max)
Cohen’s d Median (min-max)
Median (min-max)
Cohen’s d Cohen’s d Cohen’s d
Mean (SD) Mean (SD) Mean (SD) Mean (SD)
GHQ sum Likert score 19 (2–52) 26 (8–61) P < 0.001 14 (4–41) 19 (8–57) P < 0.001 P < 0.001 P < 0.001
21.4 (9.7) 27.6 (11.5) d =−0.583 15.3 (6.1) 19.8 (8.2) d =−0.623 d = 0.753 d = 0.780
GHQ somatisation 5 (1–18) 7 (0–18) P < 0.001 4 (1–21) 6 (0–16) P < 0.001 P = 0.008 P = 0.008
5.4 (3.3) 7.4 (4.0) d =−0.545 4.5 (3.4) 6.1 (3.4) d =−0.471 d = 0.269 d = 0.350
GHQ social dysfunction 7 (3–19) 9 (5–17) P < 0.001 7 (0–17) 7 (3–19) P < 0.001 P < 0.001 P < 0.001
8.1 (2.5) 9.5 (2.8) d =−0.527 6.5 (2.1) 8.1 (2.6) d =−0.677 d = 0.693 d = 0.581
GHQ anxiety 6 (0–17) 8 (0–18) P < 0.001 3 (0–13) 5 (0–14) P = 0.001 P < 0.001 P < 0.001
6.6 (3.7) 8.8 (4.3) d =−0.548 4.0 (2.3) 5.4 (3.2) d =−0.502 d = 0.844 d = 0.897
GHQ depression 0 (0–15) 1.4 (2.6) 0 (0–16) P = 0.011 0 (0–4) 0 (0–10) P = 0.791 P < 0.001 P < 0.001
1.9 (3.1) d =−0.175 0.3 (0.7) 0.4 (1.2) d =−0.102 d = 0.578 d = 0.638
GHQ sum case score 3 (0–20) 4.6 (5.0) 7 (0–26) P < 0.001 0 (0–15) 3 (0–20) P < 0.001 P < 0.001 P < 0.001
8.0 (6.3) d =−0.598 1.7 (2.7) 4.5 (4.2) d =−0.793 d = 0.722 d = 0.654
IES intrusion 17 (0–35) 25 (1–35) P < 0.001 6 (0–24) 8 (0–27) P = 0.002 P < 0.001 P < 0.001
16.5 (8.7) 22.5 (8.3) d =−0.706 6.7 (5.6) 9.4 (6.3) d =−0.453 d = 1.340 d = 1.778
IES avoidance 7 (0–37) 9.2 (7.8) 11 (0–34) P = 0.001 0 (1–18) 0.5 (0–26) P = 0.397 P < 0.001 P < 0.001
11.3 (7.1) d =−0.282 1.7 (2.9) 2.2 (3.9) d =−0.145 d = 1.275 d = 1.589
IES arousal 7 (0–31) 14 (0–35) P < 0.001 2 (0–12) 3 (0–20) P = 0.019 P < 0.001 P < 0.001
9.1 (7.1) 14.8 (9.0) d =−0.703 2.6 (3.0) 3.9 (4.2) d =−0.356 d = 1.193 d = 1.552
EPDS sum 7 (0–24) 12 (0–29) P < 0.001 1 (0–9) 2 (0–14) P < 0.001 P < 0.001 P < 0.001
7.5 (5.2) 12.5 (5.9) d =−0.899 1.4 (1.9) 3.0 (2.9) d =−0.653 d = 1.558 d = 2.044
P-values and Cohen’s d are presented for the differences between men and women within each group and for each sex between the two groups. * Wilcoxon Signed Ranks Test (non parametric, related samples).
** Independent Samples Mann–Whitney U tests (non parametric, unrelated samples). Abbreviations:
endorsement between men and women,“- men tend not to cry when unhappy, but rather express their unhappiness through other behaviors” [16]. In our study there was a considerable gender difference; 15% of the men compared to 60% of the women in the study group had a score of two (yes, very often) or three (yes, almost all the time) for the EPDS question:“Have you in the last seven days been so unhappy that you have been crying?”In the comparison group none of the men and only one woman scored in this range.
The lower scores in men compared to women for IES and GHQ might be due to the same mechanism, i.e. gender differences in the response to some of the
questions. However in an evaluation of IES after 20 years of use, no gender difference was detected [23]. Goulia et al. assessed distress in younger and older patients with chronic medical conditions using GHQ-28 [24]. Stress levels were not influenced by gender [24]. Thus, the demonstrated gender difference in distress levels in our study might be pregnancy-specific.
In contrast, Clarke et al. argue that there is evidence in social psychology research literature for females generally reporting higher levels of depression, anxiety and psycho-somatic stress than males [25]. These differences are the result of several factors including cultural and societal expectations, biological mechanisms, and care giving practices. From our study we are not able to state why men have lower scores than women. Men and women respond differently to stressful events, including those relating to parenting and chronic illness in a child [25]. A retrospective study found that mothers reported higher levels of stress than fathers only during the early stages of children’s illness and active treatment, and argued that gender differences diminish over time [26].
A study from Australia and New Zealand describes how first time fathers experience significant distress even in normal pregnancies [5]. It highlights vulnerability in the transition to fatherhood if the relationship with the partner and the social network is poor. Pregnancy-related paternal depression or anxiety is a new research agenda and there is no consensus on this issue [6]. In our study we did not investigate social network or relationship with the partner during pregnancy.
The background variables age, educational level and number of previous children were significantly different between men and women in the two groups, but only education was different between the men in the two groups. The men tended to be older than the women and the women had higher educational level than the
Table 3 Number of men and women within each group (i.e. with and without fetal anomaly) above clinically accepted psychometric cut-off values
Fetal anomaly (N = 155) No fetal anomaly (N = 100) With and without fetal anomaly (N = 255)
Men versus men Women versus women
Men Women P-value* Men Women N (%) P-value* P-value* P-value*
N (%) N (%) N (%)
GHQ sum case score≥6 50 (32.3) 88 (56.8) P = 0.001 8 (8.0) 37 (37.0) P = 0.240 P < 0.001 P = 0.003
IES intrusion≥20 65 (41.9) 112 (72.3) P < 0.001 2 (2.0) 8 (8.0) P = 0.371 P < 0.001 P < 0.001
IES avoidance≥20 18 (11.6) 23 (14.8) P = 0.007 1 (1.0) 1 (1.0) n.a. P = 0.001 P < 0.001
IES arousal≥20 13 (8.4) 44 (28.4) P < 0.001 1 (1.0) 1 (1.0) n.a. P = 0.008 P < 0.001
EPDS sum≥13 28 (18.1) 71 (45.8) P = 0.006 0 2 (2.0) n.a. P < 0.001 P < 0.001
P-values are presented for the differences between men and women within each group and for each sex between the two groups. * Chi square.
Abbreviations:
EPDSEdinburgh Postnatal Depression Scale. GHQGeneral Health Questionnaire. IESImpact of Event Scale.
N=155 Rho=0.43 P<0.001
Figure 1Correlations for IES Intrusion within couples in the fetal anomaly group; scatter plot including regression line and correlation statistics (Spearman’s Rho).The plot represents paired samples (within the couple). Abbreviations: IES; Impact of
Table 4 Unadjusted and adjusted values of the subscale scores from the impact of event scale as dependent variable for the men in the fetal anomaly group
Independent variable Dependent variable
IES intrusion (N = 155) IES avoidance (N = 155) IES arousal (N = 155)
Unadjusted Adjusted Unadjusted Adjusted* Unadjusted Adjusted
Mean (CI) P-value Mean (CI) P-value Mean (CI) P-value Mean (CI) P-value Mean (CI) P-value Mean (CI) P-value
Fetal diagnostic and prognostic classification; Category 1–5 (see text, footnotes, Table1)
1 18.2 (15.7-20.7) < 0.001 19.1 (16.3-21.9) < 0.001** 11.2 (8.8-13.6) 0.072 10.3 (7.9-12.7) 0.024 *** 10.2 (8.1-12.3) 0.097 10.4 (8.0-12.8) 0.004†
2 19.7 (17.1-22.3) 19.8 (16.9-22.6) 9.8 (7.4-12.2) 9.1 (6.7 -11.5) 11.2 (9.0-13.3) 11.3 (8.9-13.7)
3 17.1 (13.4-20.7) 16.4 (12.6-20.2) 9.4 (6.0-12.7) 8.8 (5.6-12.0) 9.7 (6.7-12.7) 9.6 (6.4-12.8)
4 9.5 (6.1-13.0) 9.5 (5.9-13.2) 5.5 (2.2-8.7) 3.9 (0.7-7.1) 4.4 (1.5-7.2) 4.0 (0.9-7.0)
5 15.0 (12.2-17.8) 15.6 (12.6-18.7) 8.2 (5.6-10.9) 7.2 (4.6-9.8) 8.2 (5.8-10.5) 8.2 (5.6-10.7)
Paternal age (years)
19-30 15.4 (13.1-17.7) 0.514 16.2 (13.6-18.7) 0.887 9.0 (6.9-11.0) 0.461†† 8.7 (6.5-10.9) 0.548 9.4 (7.5-11.3) 0.647 9.7 (7.5-11.8) 0.471
31–35 17.1 (14.8-19.5) 15.6 (13.2-18.1) 9.9 (7.8-12.0) 7.9 (5.8-9.9) 9.5 (7.6-11.5) 8.6 (6.6-10.7)
36-67 17.0 (14.5-19.6) 16.5 (13.8-19.1) 8.0 (5.7-10.2) 7.0 (4.8-9.2) 8.3 (6.2-10.4) 7.8 (5.5-10.0)
Previous children Yes 17.5 (15.5-19.4) 0.159 16.9 (14.8-19.0) 0.257 9.7 (7.9-11.4) 0.410 8.3 (6.5-10.1) 0.463 9.3 (7.7-10.9) 0.741 9.0 (7.2-10.7) 0.635 No 15.5 (13.4-17.5) 15.3 (13.1-17.4) 8.6 (6.8-10.4) 7.4 (5.6-9.2) 8.9 (7.3-10.6) 8.4 (6.6-10.2)
Education
≤Junior college
16.9 (15.0-18.8) 0.540 16.2 (14.1-18.2) 0.901 9.6 (7.9-11.3) 0.450 8.2 (6.5-9.9) 0.557 9.1 (7.5-10.6) 0.934 8.3 (6.6-10.0) 0.496
>Junior college
16.0 (14.0-18.1) 16.0 (13.9-18.1) 8.7 (6.8-10.5) 7.5 (5.7-9.3) 9.2 (7.5-10.8) 9.1 (7.3-10.9)
Gestational age at inclusion (weeks)
<18 14.9 (12.0-17.9) 0.469 14.7 (11.5-17.8) 0.323 8.1 (5.5-10.8) 0.633 6.8 (4.2-9.5) 0.413 8.5 (6.1-10.9) 0.821 8.3 (5.7-10.9) 0.897
18–22 16.9 (14.9-18.8) 15.8 (13.6-17.9) 9.7 (7.9-11.4) 8.8 (7.0-10.6) 9.4 (7.8-10.9) 8.6 (6.8-10.4)
>22 17.2 (14.5-19.9) 17.9 (15.1-20.6) 9.0 (6.6-11.4) 7.9 (5.6-10.3) 9.1 (6.9-11.3) 9.1 (6.9-11.4)
Time interval from suspicion of fetal anomaly to assessment (days)
0-2 15.6 (13.6-17.6) 0.277 15.2 (13.1-17.2) 0.599 9.1 (7.4-10.9) 0.997 8.4 (6.6-10.1) 0.741 9.2 (7.6-10.9) 0.770 8.9 (7.1-10.6) 0.765
3–6 16.8 (14.4-19.1) 15.9 (13.5-18.4) 9.1 (7.0-11.3) 7.3 (5.2-9.5) 8.6 (6.6-10.5) 8.1 (6.0-10.1)
≥7 18.6 (15.4-21.9) 17.2 (13.9-20.5) 9.3 (6.3-12.2) 7.9 (5.0-10.7) 9.8 (7.1-12.4) 9.1 (6.3-11.9) Abbreviations:
CIConfidence interval 95%,IESImpact of Event Scale.
The analyses are performed using ANOVA (Analysis of variance) in the group of men in the study group (with fetal anomaly). * Left out three outliers due to violation to the significant level of Levene’s test.
** Tukey Honestly Significant Difference (Tukey HSD) test: significant difference between category 4 and 1, p = 0.001; 4 and 2, P < 0.001; 4 and 3, P = 0.032. *** Tukey HSD test: significant difference between category 4 and 1, P = 0.009; 4 and 2, P = 0.037.
†Tukey HSD test: significant difference between category 4 and 1, P = 0.016; 4 and 2, P = 0.003. ††Two outliers removed to not violate the Levene’s test of equality of error variance.
BMC
Pregnancy
and
Childbirth
2013,
13
:147
Page
8
o
f
1
0
ntral.com/1
men. These trends are consistent with the traditional societal pattern in Norway over the last decades. It is unlikely that these differences can explain the difference in psychological stress scores between men and women or between the men in the two groups.
The correlation of psychometric measurements within couples in the study group (Figure 1) is probably explained by the severity of fetal anomaly; this is the same for each couple and is the independent variable with the greatest explanatory value to the psychological distress in both men and women [1]. Additionally, there was a lack of correlations between men and women in the comparison group. The comparison group only scored on a limited interval or range of the scales for distress measurements. This might be the reason why it is not possible to detect a significant correlation between men and women in a sample of 100 couples in normal pregnancies.
A weakness of the study is that we do not have distress measurements prior to the event, i.e. prior to the ultra-sound examination detecting fetal anomaly. Due to the
unpredictable occurrence of fetal anomalies this was not feasible. The strength of the study is the sample size, the incorporation of a comparison group, and the use of validated and widely applied questionnaires.
The selection of instruments to assess psychological response during pregnancy may be subject to discussion [27], although without any clear recommendations so far. We have chosen a broad variety of instruments covering general health perception, social dysfunction, key compo-nents of psychological distress, the response to a specific stressful event related to detection of fetal anomaly, and one questionnaire validated for use during pregnancy in both men and women. The chosen questionnaires have been used in other related studies, thereby enabling the comparison of results.
Conclusion
Despite the frequent use of ultrasound examination in pregnancy, little attention has been devoted the psycho-logical response of the expectant father to the detection
Table 5 Unadjusted and adjusted values of general health questionnaire sum Likert score and Edinburgh postnatal depression scale sum score as dependent variables for the men in the fetal anomaly group
Independent variable Dependent variable
GHQ sum Likert score (N = 155) EPDS sum score (N = 155)
Unadjusted Adjusted* Unadjusted Adjusted**
Mean (CI) P-value Mean (CI) P-value Mean (CI) P-value Mean (CI) P-value
Fetal diagnostic and prognostic classification; category 1–5 (see text, footnotes, Table1)
1 22.9 (19.8-25.9) 0.015 24.8 (21.4-28.2) 0.426 9.0 (7.5-10.5) 0.001 9.6 (7.7-11.5) 0.001***
2 21.7 (18.6-24.8) 20.9 (17.6-24.3) 8.4 (6.9-10.0) 6.6 (4.6-8.7)
3 21.6 (17.2-25.9) 21.1 (16.7-25.6) 8.6 (6.4-10.8) 6.5 (3.8-9.2)
4 19.2 (15.1-23.4) 21.0 (16.5-25.5) 4.1 (2.0-6.2) 3.0 (0.7-5.4)
5 20.6 (17.2-24.0) 21.7 (18.2-25.2) 5.9 (4.2-7.6) 5.8 (3.8-7.8)
Paternal age (years)
19-30 21.9 (19.3-24.5) 0.230 23.6 (19.9-27.2) 0.302 7.8 (6.4-9.2) 0.561 6.9 (5.3-8.5) 0.599
31–35 22.8 (20.1-25.4) 22.3 (19.5-25.1) 7.7 (6.2-9.1) 6.3 (4.8-7.9)
36-67 19.5 (16.7-22.3) 19.9 (16.7-23.1) 6.8 (5.2-8.3) 5.7 (3.9-7.6)
Previous children Yes 21.5 (19.3-23.6) 0.964 22.1 (19.6-24.5) 0.872 7.4 (6.2-8.6) 0.887 6.5 (5.1-7.8) 0.739 No 21.5 (19.3-23.8) 21.8 (19.2-24.3) 7.5 (6.3-8.7) 6.2 (4.7-7.6)
Education
≤Junior college
22.0 (19.8-24.1) 0.516 22.7 (20.3-25.1) 0.353 7.7 (6.6-8.9) 0.487 6.1 (4.7-7.4) 0.568
>Junior college
20.9 (18.6-23.2) 21.1 (18.6-23.7) 7.1 (5.9-8.4) 6.6 (5.2-8.0)
Gestational age at inclusion (weeks)
<18 19.8 (16.5-23.1) 0.556 20.5 (16.9-24.2) 0.502 5.9 (4.1-7.6) 0.136 4.8 (2.6-6.9) 0.123
18–22 21.8 (19.7-24.0) 22.9 (20.4-25.5) 8.0 (6.8-9.1) 6.6 (5.3-7.9)
>22 21.9 (18.8-24.9) 22.2 (19.1-25.4) 7.8 (6.1-9.4) 7.6 (5.9-9.3)
Time interval from suspicion of fetal anomaly to assessment (days)
0-2 20.6 (18.4-22.8) 0.143 20.3 (17.9-22.7) 0.157 7.4 (6.2-8.6) 0.784 6.4 (5.0-7.7) 0.880
3–6 20.8 (18.2-23.5) 20.6 (17.7-23.5) 7.2 (5.8-8.6) 6.0 (4.4-7.6) ≥7 24.7 (21.1-28.3) 24.8 (20.8-28.9) 8.0 (6.1-10.0) (4.5-8.6) Abbreviations:
CIConfidence interval 95%,EPDSEdinburgh Postnatal Depression Scale,GHQGeneral Health Questionnaire.
The analyses are performed using ANOVA (Analysis of variance) in the group of men in the study group (with fetal anomaly). * Interaction: Paternal age* Time interval from suspicion of fetal anomaly to inclusion, P = 0.016.
** Interaction: Fetal diagnostic and prognostic classifications* Gestational age at inclusion, P = 0.017; Paternal age* Previous children, P = 0.023.
of fetal anomalies. Men in the group with fetal anomaly had significantly higher scores on all distress measures than the men in the group without fetal anomaly. The se-verity of anomaly and diagnostic and prognostic ambiguity influenced the paternal psychological response. Although men had lower scores than women on all psychometric outcomes, the correlation of distress levels associated with the detection of fetal anomalies within couples was high. This knowledge may facilitate intensified support for both expectant parents in situations of detected fetal anomaly and thus help reduce strain within the family.
Abbreviations
EPDS:Edinburgh postnatal depression scale; GHQ: General health questionnaire; IES: Impact of event scale.
Competing interests
The authors declare that they have no competing interests.
Authors’contributions
AK planned and performed the study, analysed the data, and wrote the paper. AH participated in performing the study and writing of the paper. UFM participated in planning the study and writing of the paper. TN participated in analyzing the data and writing of the paper. HS participated in planning the study and writing of the paper. GH participated in planning and performing the study, and writing of the paper. All authors read and approved the final manuscript.
Acknowledgements
The authors want to express their gratitude to all women who participated in the study. We acknowledge Professor Arvid Heiberg for contribution to the design of the study and Torhild Garen for preparing the Cardiff TeleForm scanning.
Funding
This study was supported by The Norwegian Women’s Public Health Association and National Resource Centre for Women’s Health.
Author details
1
Department of Health, Nutrition and Management, Oslo and Akershus University College of Applied Sciences, P.O.Box 4, St. Olavs Plass, NO-0130 Oslo, Norway.2National Resource Centre for Women’s Health, Oslo University Hospital, Oslo, Norway.3Department of Obstetrics, Oslo University Hospital, Oslo, Norway.4Department of Neuropsychiatry and Psychosomatic Medicine, Oslo University Hospital, Oslo, Norway.5University of Oslo, Oslo, Norway. 6
Nofima Mat, Ås, Norway and University of Copenhagen, Copenhagen, Denmark.7Department of Gastrointestinal- and Pediatric Surgery, Oslo University Hospital, Oslo, Norway.
Received: 6 September 2012 Accepted: 8 July 2013 Published: 12 July 2013
References
1. Kaasen A, Helbig A, Malt UF, Naes T, Skari H, Haugen G:Acute maternal social dysfunction, health perception and psychological distress after ultrasonographic detection of a fetal structural anomaly.BJOG2010, 117:1127–1138.
2. Tifferet S, Manor O, Constantini S, Friedman O, Elizur Y:Sex difference in paternal reaction to pediatric illness.J Child Health Care2011,15:118–125. 3. Skari H, Malt UF, Bjornland K, Egeland T, Haugen G, Skreden M,et al:
Prenatal diagnosis of congenital malformations and parental psychological distress–a prospective longitudinal cohort study.Prenat Diagn2006 Nov,26:1001–1009.
4. Ekelin M, Crang SE, Larsson AK, Nyberg P, Marsal K, Dykes AK:Parental expectations, experiences and reactions, sense of coherence and grade of anxiety related to routine ultrasound examination with normal findings during pregnancy.Prenat Diagn2009,29:952–959.
5. Condon JT, Boyce P, Corkindale CJ:The first-time fathers study: a prospective study of the mental health and wellbeing of men during the transition to parenthood.Aust N Z J Psychiatry2004,38:56–64. 6. Schumacher M, Zubaran C, White G:Bringing birth-related paternal
depression to the fore.Women Birth2008,21:65–70.
7. Boyce P, Condon J, Barton J, Corkindale C:First-time fathers' study: psychological distress in expectant fathers during pregnancy.Aust N Z J Psychiatry2007,41:718–725.
8. Hunfeld JA, Tempels A, Passchier J, Hazebroek FW, Tibboel D:Brief report: parental burden and grief one year after the birth of a child with a congenital anomaly.J Pediatr Psychol1999,24:515–520.
9. Fleiss JL:Measuring nominal scale agreement among many raters.
Psychol Bull1971,76:378–382.
10. Goldberg DP, Hillier VF:A scaled version of the general health questionnaire.Psychol Med1979,9:139–145.
11. Horowitz M, Wilner N, Alvarez W:Impact of event scale: a measure of subjective stress.Psychosom Med1979,41:209–218.
12. Weiss D, Marmar C:The Impact of Event Scale -revised. InAssessing psychological trauma and PTSD.Edited by Wilson J, Keane T. New York: Guildford; 1997.
13. Cox JL, Holden JM, Sagovsky R:Detection of postnatal depression. Development of the 10-item Edinburgh postnatal depression scale.
Br J Psychiatry1987,150:782–786.
14. Tjemsland L, Soreide JA, Malt UF:Posttraumatic distress symptoms in operable breast cancer III: status one year after surgery.Breast Cancer Res Treat1998,47:141–151.
15. Skari H, Skreden M, Malt UF, Dalholt M, Ostensen AB, Egeland T,et al: Comparative levels of psychological distress, stress symptoms, depression and anxiety after childbirth–a prospective population-based study of mothers and fathers.BJOG2002,109:1154–1163.
16. Matthey S, Barnett B, Kavanagh DJ, Howie P:Validation of the Edinburgh postnatal depression scale for men, and comparison of item endorsement with their partners.J Affect Disord2001,64:175–184. 17. Murray D, Cox JL:Screening for depression during pregnancy with the
Edinburgh depression scale (EPDS).J Reprod Infant Psychol1990,8:99–107. 18. Boyce PM, Stubbs J, Todd AL:The Edinburgh postnatal depression scale:
validation for an Australian sample.Aust N Z J Psychiatry1993,27:472–476. 19. Murray L, Carothers AD:The validation of the Edinburgh post-natal
depression scale on a community sample.Br J Psychiatry1990, 157:288–290.
20. Donath S:The validity of the 12-item general health questionnaire in Australia: a comparison between three scoring methods.Aust N Z J Psychiatry2001,35:231–235.
21. Condon J:What about dad? Psychosocial and mental health issues for new fathers.Aust Fam Physician2006,35:690–692.
22. Statham H, Solomou W, Chitty L:Prenatal diagnosis of fetal abnormality: psychological effects on women in low-risk pregnancies.Baillieres Best Pract Res Clin Obstet Gynaecol2000,14:731–747.
23. Sundin EC, Horowitz MJ:Horowitz's impact of event scale evaluation of 20 years of use.Psychosom Med2003,65:870–876.
24. Goulia P, Papadimitriou I, Machado MO, Mantas C, Pappa C, Tsianos E,et al: Does psychological distress vary between younger and older adults in health and disease?J Psychosom Res2012,72:120–128.
25. Clarke NE, McCarthy MC, Downie P, Ashley DM, Anderson VA:Gender differences in the psychosocial experience of parents of children with cancer: a review of the literature.Psycho-oncol2009,18:907–915. 26. Freeman K, O'Dell C, Meola C:Childhood brain tumors: parental concerns
and stressors by phase of illness.J Pediatr Oncol Nurs2004,21:87–97. 27. Meades R, Ayers S:Anxiety measures validated in perinatal populations: a
systematic review.J Affect Disord2011,133:1–15.
doi:10.1186/1471-2393-13-147