Subsurface structure and faulting of the Median Tectonic Line,
southwest Japan inferred from GPS velocity field
Takao Tabei1, Manabu Hashimoto2, Shin’ichi Miyazaki3, Kazuro Hirahara4, Fumiaki Kimata4, Takeshi Matsushima5, Torao Tanaka6, Yasuhide Eguchi1, Takashi Takaya1, Yoshinobu Hoso2, Fumio Ohya2, and Teruyuki Kato3
1Faculty of Science, Kochi University, Kochi 780-8520, Japan 2Disaster Prevention Research Institute, Kyoto University, Uji 611-0011, Japan 3Earthquake Research Institute, The University of Tokyo, Tokyo 113-0032, Japan 4Graduate School of Environmental Studies, Nagoya University, Nagoya 464-8602, Japan
5Graduate School of Science, Kyushu University, Shimabara 855-0843, Japan 6Faculty of Science and Technology, Meijo University, Nagoya 464-8502, Japan
(Received December 30, 2001; Revised July 30, 2002; Accepted August 19, 2002)
The Median Tectonic Line (MTL) is the longest arc-parallel fault system in southwest Japan whose right-lateral strike-slip is related to oblique subduction of the Philippine Sea plate (PH). We constructed a dense Global Positioning System network along a 200 km-long traverse line across the MTL in 1998 to estimate deep fault structure and slip distribution. Horizontal velocities were determined at 65 sites through campaign measurements and show crustal shortening in the direction of the plate convergence. Using multi-rectangular segments and depth-dependent coupling at the plate interface, we calculate and remove elastic deformation caused by the PH subduction. The residual velocity field shows right-lateral strike-slip block motion of about 5 mm/yr across the MTL, consistent with geological estimates. However, the block boundary does not coincide with the surface trace of the MTL, being displaced 20–30 km to the north. The residual velocity field is reproduced by a model with a 35–45◦ northward-dipping fault plane, full locking of the upper portion to a depth of 15 km, and steady slip of 5 mm/yr below. GPS results are supported by imaging of an inclined fault plane revealed by seismic profiling and currently low activity of shallow earthquakes.
1.
Introduction
The Median Tectonic Line (MTL) is the longest arc-parallel strike-slip fault system in southwest Japan (Fig. 1). Its right-lateral strike-slip motion originates from oblique subduction of the Philippine Sea plate (PH) at the Nankai Trough, separating the Nankai forearc from the continental plate. Average slip rate along the MTL in the late Quaternary is estimated as 5–10 mm/yr based on geological and geomor-phological observations, making it one of the most active in-land faults in Japan (Research Group for Active Faults of Japan, 1991). The fault is believed to have been unruptured at least for the last 1000 years because there is no histori-cal record of destructive earthquakes in the region. Current seismic activity is relatively low so that no linear distribution of microearthquakes is found along the MTL (Okano and Kimura, 1996). Though recent trench excavations have sug-gested a partial rupture at the end of 16th century (Tsutsumi and Okada, 1996), most of the MTL has the potential to rup-ture in a large event in the furup-ture.
Geographical Survey Institute (GSI) established a Japanese nationwide continuous array of the Global Posi-tioning System (GPS) in 1994 (Tsujiet al., 1995). With on-going expansion and densification, the number of stations
Copy right cThe Society of Geomagnetism and Earth, Planetary and Space Sciences (SGEPSS); The Seismological Society of Japan; The Volcanological Society of Japan; The Geodetic Society of Japan; The Japanese Society for Planetary Sciences.
has exceeded 1000 and the average station separation has shortened to 15–30 km, as of the end of 2000. The most significant feature of the deformation in southwest Japan is crustal shortening in the direction of plate convergence (Fig. 1). This shows interseismic strain accumulation in the earthquake deformation cycle at the Nankai Trough, which is the elastic deformation caused by strong coupling at the plate interface (Ozawaet al., 1999). While most of the accu-mulated strain will be released at the time of the next great interplate earthquake, it is natural to think that compressional force acting obliquely on the fault plane of the MTL may generate small but permanent right-lateral strike-slip during the ‘interseismic’ period. Taking into account the absence of creep motion at the surface and low seismic activity along the surface trace, steady-state aseismic slip may be occurring on the deeper portion of the MTL.
While the fault plane of the MTL was previously thought to be nearly vertical based on surface field observations, re-cent geophysical studies have provided a new image of the MTL. Itoet al.(1996) conducted seismic reflection survey across the fault segment of the MTL in eastern Shikoku Is-land (Fig. 2) and found a sharp reflector dipping 30–40 de-grees north and extending at least to a depth of 5–6 km. Combining density structure from gravity survey and resis-tivity structure from magnetotelluric measurements with the seismic reflection profile, they concluded that the fault plane
131E 133E 135E 137E 32N
34N 36N
Nankai
Trough
50 mm/yr Amurian Plate
Median
Tectonic Line
130E 140E
30N 40N
50N
Philippine Sea Plate Amurian
Plate (Fixed)
Pacific
Plate North American Plate
Philippine Sea Plate
50mm/yr
Fig. 1. Plate tectonic setting of the Japanese Islands (left) and horizontal velocity field of southwest Japan obtained by the nationwide continuous GPS array (right). All velocities are plotted with respect to the Amurian plate. Data period used for the velocity estimation in the right figure is from April 1996 to July 1999. Velocity uncertainties are approximately 2.1 and 1.7 mm/yr for the east and north components, respectively (Miyazaki and Heki, 2001), but omitted for clarity.
133E 134E
34N 35N
50km 10mm/yr
MTL
Chugoku District
Shikoku Island
Fig. 2. Horizontal site velocities in the Amurian plate reference frame with 3σ(99%) error ellipses. Velocities at 23 campaign stations are obtained from three campaign measurements from 1998 to 2000. Velocities at 42 continuous stations are derived from data obtained in the same period as the three campaigns. Each continuous station has a secular velocity calculated from continuous data (plotted in Fig. 1). Secular velocities are not shown here because they nearly overlap with the campaign-mode velocities. Open rectanglur embedded in the figure represents the area of seismic reflection study by Itoet al.(1996).
of the MTL dips to the north at a shallow dip angle. Onishiet al.(1999) analyzed data from deep seismic reflection exper-iment and confirmed that the north-dipping reflector found by Itoet al.(1996) extended to about 4 seconds in two-way
time domain, which is translated into about 10 km in depth. Further extension is not clear.
Such a shallow dip angle may affect the pattern of crustal deformation across the MTL. Unfortunately, the station spacing of the continuous GPS array is too sparse to investi-gate this possibility. Therefore, in 1998 we started GPS cam-paign measurements along a traverse across the MTL in or-der to improve the spatial resolution of the pre-existing GPS array. After subtracting the elastic loading effect of the sub-ducting PH slab, we estimate a depth of the upper locking zone and a steady-state slip velocity for the deeper portion of the MTL.
2.
GPS Campaign Measurements and Analysis
In addition to the nationwide GPS array, since 1996 GSI has deployed 11 additional stations along the surface trace of the MTL for earthquake risk assessment. If upper zone of the fault is locked to a certain depth, however, significant relative motion is not expected in the vicinity of the fault. Alterna-tively deployment of dense GPS array along a line perpen-dicular to the fault will be more effective in estimating deep fault structure and slip at depth from surface deformation data. We constructed 23 campaign stations along a 200 km-long traverse line in 1998. Combining the traverse campaign array with the pre-existing continuous one, station coverage around the MTL has been greatly improved (Fig. 2).
We have conducted four observation campaigns (Table 1). All stations were occupied simultaneously and measured continuously for at least five consecutive days in each cam-paign. We used 16 Ashtech Z-12 and 7 Trimble 4000SSi GPS receivers following a principle that the same kind of in-strument must be used at each station through all campaigns. GPS receiver antennas were screwed onto the anchored bolt or the specially designed pillar to exclude re-centering error and unstable motion during the observation.
pro-Table 1. Repeatabilities of daily coordinate solutions.
Campaign No. Stations Total No. Data RMS Residuals (mm)
Core Time Occupied∗ Analyzed (days) North East Up
Oct. 9–13, 1998 71 407 1.4 1.8 12.9
Oct. 6–10, 1999 68 398 2.2 2.1 9.6
Sept. 29–Oct. 3, 2000 70 345 2.3 3.4 12.3
Oct. 4–8, 2001 71 — — — —
∗Includes continuous GSI stations.
cessing. We processed data at 23 campaign stations together with those obtained in the same period at 42 continuous sta-tions of GSI and 6 International GPS Service (IGS) stasta-tions in the western Pacific region. Thus we connected our lo-cal network with the nationwide array and the global ref-erence frame. We calculated daily station coordinates with tropospheric gradient estimation and ocean-loading correc-tion, and then combined them into campaign solutions. Data from the latest (October 2001) campaign are not used in this study. Repeatabilities of daily coordinate solutions in each campaign are summarized in Table 1. While horizontal com-ponents of station coordinates are determined within an ac-curacy of 1–3 mm, repeatability of the vertical component is much worse than the horizontal one. We use only horizontal components in the rest of this study.
Finally we determined station velocities by fitting linear trend to campaign solutions, based on velocities at the 6 IGS sites that are catalogued on the International Terrestrial Ref-erence Frame 97 (ITRF97). Velocity uncertainties are 0.8 and 0.6 mm/yr for the east and north components, respec-tively, which are formal errors in the Bernese output but seem underestimated. Apart from the above velocity estimation, GSI has calculated velocities at all stations of the nation-wide array by fitting linear trend and seasonal variation to the continuous data. We use these secular velocities to check our campaign-mode velocities. However, it is impossible to directly compare the errors because error-estimating method is not the same between the continuous and campaign data analyses. In the former, white and flicker noises were intro-duced to 40-month-long time series and velocity uncertain-ties of 2.1 and 1.7 mm/yr were derived for the east and north components, respectively (Miyazaki and Heki, 2001).
3.
Horizontal Velocity Field
Horizontal velocities calculated from three sets of cam-paign solutions from 1998 to 2000 are shown in Fig. 2, where velocities at 23 campaign and 42 continuous stations are plotted in the Amurian plate (AM) reference frame. Since no significant earthquakes occurred in this region in the data period, velocities shown here can be considered as currently stationary. In addition to the campaign-mode velocity, each of the 42 continuous stations has a secular velocity calcu-lated from continuous data from April 1996 to July 1999. Though the data periods are not identical, the continuous and campaign station velocities are in good accord. Con-tinuous station velocities are not shown in the figure since they nearly overlap with the campaign-mode velocities. The average discrepancy is about 2 mm/yr and so we think that
133E 134E
34N 35N
50km 10mm/yr
MTL
Fig. 3. Calculated elastic deformation caused by the subduction of the PH slab. The backward normal slips predicted from the Euler vector of the PH-AM convergence (Miyazaki and Heki, 2001) are given on the multi-rectangular plate interfaces at the Nankai Trough (Sagiya and Thatcher, 1999). Full coupling at the depth of 5–25 km, transition at 25–35 km, and no interaction below 35 km are assumed. Velocities at 23 campaign and 42 continuous stations are predicted.
our campaign-mode velocities are highly accurate.
The most significant feature in the velocity field obtained is the elastic loading caused by the subduction of the PH and the strong coupling at the plate interface. The velocity is a maximum at the southern tip of Shikoku and rapidly decreases with increasing distance from the Nankai Trough. Strain rate is as large as 2.2–3.4×10⁻⁷/yr, consistent with
that expected from the amount of coseismic elastic rebound and the recurrence time (Ozawaet al., 1999). However the elastic loading may become an obstacle to estimating MTL fault-origin deformation.
133E 134E 34N
35N
5mm/yr 50km
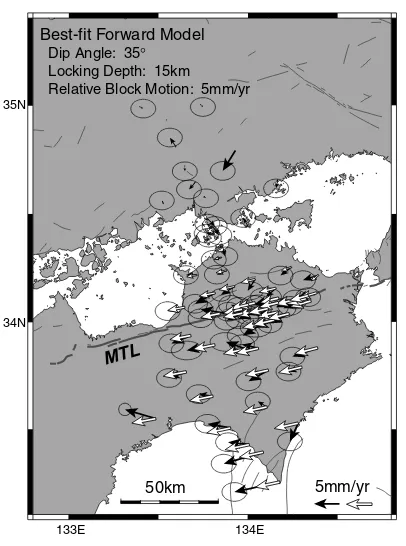
MTL Best-fit Forward Model
Dip Angle: 35° Locking Depth: 15km Relative Block Motion: 5mm/yr
Fig. 4. Residual velocities after removing the effects of the PH subduction (solid arrows) and calculated velocities from the best-fit forward model of the MTL (open arrows). Parameters giving the best-fit model are annotated in the figure and parameter descriptions are given in Fig. 6. Residual velocities at three sites were removed before calculating the best-fit model because they abnormally deviate from the regional velocity field. See Fig. 5 for more detail of the velocity field near the surface trace of the MTL.
each segment of multi-rectangular fault planes of the Nankai Trough (Sagiya and Thatcher, 1999). We assume full cou-pling in the depth range 5–25 km, a transition between 25 and 35 km, and no interaction below 35 km following a ther-mal model of the seismogenic zone (Hyndmanet al., 1995). Calculated elastic deformation is shown in Fig. 3, which reproduce general feature of the observed velocity field in Fig. 2.
Residual velocities after removing the PH subduction ef-fects are shown in Fig. 4. Stations located in the southern block of the MTL show westward motion of 3–5 mm/yr ex-cept at the southeastern tip of the island. Similar westward motion is seen also at stations densely distributed near the MTL (Fig. 5). On the other hand, stations located further north show no systematic motion and most velocities are within the error.
The most important result is a location of the boundary of block-like motion. As clearly shown in Fig. 5, it is located 20–30 km north of the MTL and no velocity discontinuity is detected across the surface trace of the MTL. Miyazaki and Heki (2001) has already pointed out west-southwestward motion of 2–5 mm/yr of the southern block after removing the effects of the PH subduction. However, the location of block boundary and the transition of block motion from south to north were difficult to identify in their study because station distribution of GSI’s continuous array was too sparse.
133 30' 134 00' 134 30' 34 00'
34 30'
5mm/yr
Observed
10km
MTL
133 30' 134 00' 134 30' 34 00'
34 30'
5mm/yr
Calculated
10km
MTL
Fig. 5. Residual velocities (upper) and predictions from the best-fit model (lower) near the surface trace of the MTL. See also the caption of Fig. 4.
LOCKED D
STEADYSLIP N
S MTL
-200 -150 -100 -50 0 50 100 150 200
Fault-normalDistance,km
Fault-parallel
Velocity,
mm/yr
5km 15km 30km RelativeBlockMotion
(=5mm/yr)
-3.0 -2.0 -1.0 0 1.0 2.0 3.0
LockingDepth D Dip-angle =35deg
(South) (North)
MTL
δ δ
Fig. 6. Model calculation of surface deformation due to deep steady slip on an inclined fault. (Upper) Definition of dip angle and depth of upper locking zone of the fault. Steady right-lateral slip occurs below a depth
4.
Subsurface Structure and Faulting of the MTL
Surface deformation caused by steady slip on a deep por-tion of the fault can be simply modeled by superposing a deformation due to slip deficit on the upper locking zone of the fault upon a relative block motion between both sides of the fault (Matsu’uraet al., 1986). Sample calculation results are shown in Fig. 6, where fault-parallel velocities are plot-ted against fault-normal distance for three different locking depths. According to new seismic reflection survey results by Itoet al.(1996) and Onishiet al.(1999), dip angle of 35 degrees is assumed. Rate of relative block motion of 5 mm/yr is adopted from the residual velocity field in Figs. 4 and 5. It is assumed that the upper zone is fully locked but its lower limit is variable. Fault length is fixed to 100 km because the most likely rupture length for the segment across which the GPS traverse line runs is 100–120 km (Tsutsumi and Okada, 1996).
Velocity profiles in Fig. 6 show small (<15%) change on the southern block of the MTL even when locking depth changes from 5 km to 30 km. On the northern side, in contrast, velocity profiles vary significantly with the locking depth.
Though structure beneath Shikoku Island is heterogenous, effects of such a structure on surface deformation are not understood well. Therefore, we simply assume that the cou-pling model for the Nankai Trough is valid enough to remove the effects of the PH subduction, and also the inclined fault model for the MTL to estimate the residual deformation. We search the best-fit model for the residual velocity field in Figs. 4 and 5 by varying locking depth and rate of relative block motion with steps of 2.5 km and 1 mm/yr, respectively, for three different dip angles of 30, 35, and 40 degrees. Only fault-parallel components of the residual velocities (Fig. 7) are used for the estimation. The model giving the smallest root-mean-square residual has a locking depth of 15 km, a rate of relative block motion of 5 mm/yr, and a dip angle of 35 degrees. Errors of estimated locking depth and rate of relative block motion are approximately 5 km and 1mm/yr, respectively. Surface deformations calculated from this sim-ple model reproduce the residual velocity field, which are shown in Figs. 4, 5, and 7. Estimated rate of block motion is consistent with the long-term slip rate of the MTL from geological and geomorphological observations.
The above forward modeling using the residual velocity field is based on several assumptions: (1) a full plate cou-pling on shallow fault plane of the Nankai Trough, (2) negli-gible change of plate convergence direction in spite of lateral motion of the Nankai forearc bounded by the Nankai Trough and the MTL, (3) a full locking on the upper zone of the MTL, and (4) deeper extension of the inclined fault plane of the MTL revealed by seismic reflection surveys. If the assumptions (1)–(3) are in doubt, an inversion analysis will give answers by estimating simultaneously backslip vectors on plate interface, a rate of block motion across the MTL, and slip deficits on the upper fault zone of the MTL. As for the assumption (4), however, currently we have no tool to judge its correctness. Therefore, we maintain this assump-tion also in the following inversion analysis.
Miyazaki and Heki (2001) made an inversion analysis us-ing velocity data from GSI’s array, dividus-ing the MTL into
-12.0
Fault-parallel Velocity, mm/yr Surface Trace of MTL
N14ºW S14ºE
Fig. 7. Plots of velocity components parallel to the strike of the MTL as a function of normal distance from the MTL. Open diamond with an error bar represents fault-parallel component of the residual velocity. Solid diamond represents velocity component predicted from the best-fit forward model.
five vertical subfault segments. Although statistical results showed that the MTL was a boundary of block motion, slip deficits on the upper fault zone was not significant through-out all segments because the formal uncertainties exceeded the estimates. This is chiefly because of the poor spatial res-olution of the continuous GPS data.
We tried a similar inversion analysis. Differences from that of Miyazaki and Heki (2001) include our larger data set and inclusion of dip angle of the MTL. We add 23 campaign-mode velocities to GSI’s secular velocities in Shikoku Island and Chugoku district. Constraining a depth of upper fault locking zone to 15 km, we conduct inversions for various dip angles. The optimum model obtained is the one with a dip angle of 30 degrees, showing a rate of block motion of 3 mm/yr and nearly full locking on the upper fault zone of the MTL. Estimated slip deficit on the upper fault zone is statistically significant for the segment in eastern Shikoku, in contrast with the results by Miyazaki and Heki (2001). How-ever, larger uncertainties are inevitable for other segments of the MTL because of low spatial resolution of GPS data.
Another important result of the inversion analysis is that the estimated backslip vectors on the plate interface are sta-ble, showing no significant changes from those predicted from the Euler vector of the PH-AM convergence. On the interface segments in the depth range 5–25 km, average and maximum deviations of the estimated backslip vector from the prediction is 1.3 mm/yr and 3.4 mm/yr in rate and 1.3◦ and 3.7◦ in azimuth, respectively. This implies that current plate coupling is nearly full and convergence direction does not change significantly even if oblique subduction causes small lateral motion of the forearc block. However, the in-version results are still preliminary, and further check will be needed.
and compressional horizontal strain at a high angle to the fault strike make us expect a thrust movement rather than a strike slip. In the studied area, vertical offset across the MTL shows uplift of the northern block against the southern one, consistent with the above expectation. However, verti-cal slip rate estimated from surface field observation is much smaller than the lateral one, about one tenth of the latter (Re-search Group for Active Faults of Japan, 1991). Earthquake deformation cycle at the Nankai Trough may give a possible interpretation to the reason why thrust movement is not dom-inant. Although crustal shortening in the direction of plate convergence (nearly ‘margnormal’) is dominant in the in-terseismic period, most of accumulated strain is released at the time of the great interplate earthquake. Eventually, strain regime in the forearc block is far from ‘margin-normal’ com-pression in a long time scale (Wang, 2000).
In central and western Shikoku, west of roughly 133.7◦ East, local topography shows uplift of the southern block of the MTL, in contrast to the east, though right-lateral strike-slip is still dominant. How far the inclined fault plane found in eastern Shikoku extends laterally and why vertical move-ment in a reverse sense has occurred in central and western Shikoku are not the main subjects of this study. Further mul-tidisciplinary observations including a dense GPS traverse survey are desired to image deep structure and slip mode of other segments of the MTL.
5.
Conclusions
Depth of shallow locking zone and deep steady slip of the MTL, southwest Japan are estimated using 65 hori-zontal crustal velocities from dense GPS traverse surveys. Campaign-mode velocities show good accordance with those from continuous data. The most dominant feature of the ob-served velocity field is the elastic loading by the subduct-ing PH slab. The effect can be reproduced and removed by forward modeling that applies backward normal slip on the plate interface. Residual velocities after removing the sub-duction effects show a block motion across the MTL and steep transition at 20–30 km north of the MTL. New results from other geophysical data suggest that the MTL fault plane dips to the north at 30–40 degrees, and we use this constraint to estimate a locking depth and a relative block motion from GPS residual velocities. The best-fit model has a locking depth of 15 km and a relative block motion of 5 mm/yr when fault dip angle is 35 degrees. We tried also an inversion anal-ysis to simultaneously estimate a rate of block motion across the MTL and slip deficits on the upper fault zone of the MTL together with backslip vectors on the plate interface. The optimum model gives nearly the same results as the forward modeling.
It seems that steady aseismic slip at depth has continued
to load shear stress on the shallower part of the fault plane of the MTL. Although current seismic activity is low, seismic potential of the MTL may thus be high. Profiling subsurface structure in more detail and continuously monitoring present movements will be more important for earthquake risk as-sessment and disaster reduction in the future.
Acknowledgments. This study is based on a project in which a number of people participated. We thank all collaborators and the authorities concerned. Comments by T. Sagiya and an anonymous reviewer helped improve the manuscript. This work was supported by the Grant-in-Aid for Scientific Research (B)(1) 10440129 from the Ministry of Education, Science, Sports and Culture (1998– 2000) and also by the Team Research 13P-2 from the Disaster Prevention Research Institute, Kyoto University (2001–).
References
Hyndman, R., K. Wang, and M. Yamano, Thermal constraints on the seis-mogenic portion of the southwestern Japan subduction thrust,J. Geophys. Res.,100, 15,373–15,392, 1995.
Ito, T., T. Ikawa, S. Yamakita, and T. Maeda, Gently north-dipping Me-dian Tectonic Line (MTL) revealed by recent seismic reflection studies, southwest Japan,Tectonophys.,264, 51–63, 1996.
Matsu’ura, M., D. D. Jackson, and A. Cheng, Dislocation model for aseis-mic crustal deformation at Holister, California, J. Geophys. Res., 91, 12,661–12,674, 1986.
Miyazaki, S. and K. Heki, Crustal velocity field of southwest Japan: Sub-duction and arc-arc collision,J. Geophys. Res.,106, 4305–4326, 2001. Okano, K. and S. Kimura, Crustal movements in and around Shikoku,
southwest Japan associated with great Nankai earthquakes,J. Seism. Soc. Japan,49, 361–374, 1996 (in Japanese).
Onishi, M., T. Ikawa, T. Matsuoka, T. Kawamura, T. Echigo, M. Orito, T. Ito, N. Hirata, T. Iwasaki, E. Kurashimo, and H. Sato, Deep seismic reflection experiment with a highly dense array of seismograms near the Median Tectonic Line, Shikoku, Japan,Abstr. 1999 Fall Meeting of the Seismological Society of Japan, P107, 1999.
Ozawa, T., T. Tabei, and S. Miyazaki, Interplate coupling along the Nankai Trough off southwest Japan derived from GPS measurements,Geophys. Res. Lett.,26, 927–930, 1999.
Research Group for Active Faults of Japan,Active Faults in Japan: Sheet Maps and Inventories, Univ. of Tokyo Press, 437 pp., 1991 (in Japanese). Sagiya, T. and W. Thatcher, Coseismic slip resolution along a plate bound-ary megathrust: The Nankai Trough, southwest Japan,J. Geophys. Res., 104, 1111–1129, 1999.
Savage, J. C., A dislocation model of strain accumulation and release at a subduction zone,J. Geophys. Res.,88, 4984–4996, 1983.
Tsuji, H., Y. Hatanaka, T. Sagiya, and M. Hashimoto, Coseismic crustal deformation from the 1994 Hokkaido-Toho-Oki earthquake monitored by a nationwide continuous GPS array in Japan,Geophys. Res. Lett.,22, 1669–1672, 1995.
Tsutsumi, H. and A. Okada, Segmentation and Holocene surface faulting on the Median Tectonic Line, southwest Japan,J. Geophys. Res.,101, 5855–5871, 1996.
Wang, K., Stress-strain ‘paradox’, plate coupling, and forearc seismicity at the Cascadia and Nankai subduction zones,Tectonophys.,319, 321–338, 2000.