TOOLS AND TECHNIQUES FOR THE TECHNOLOGICAL INTEGRATION
OF MULTI-HAZARD POST-INCIDENT ASSESSMENT
Final Report
NSF Grant # CMS-0353175
Dr. Debra F. Laefer
Dr. William Rasdorf
Anu R. Pradhan
DEPARTMENT OF CIVIL, CONSTRUCTION, AND ENVIRONMENTAL ENGINEERING NORTH CAROLINA STATE UNIVERSITY
RALEIGH, NC
TABLE OF CONTENTS
LIST OF TABLES ...iv
LIST OF FIGURES ...v
1. INTRODUCTION...1
1.1 Disasters...1
1.2 GIS Use in Disaster Management ...3
1.3 The Six Disaster Phases...3
2. LITERATURE REVIEW ...5
2.1 Existing Systems ...6
2.1.1 Inadequacies of Current Systems ...6
2.1.2 HAZUS-MH...7
2.1.3 CATS ...7
2.1.4 DMI-Services ...7
2.1.5 Deaton and Frost Commercial System ...7
3. SYSTEM REQUIREMENTS ...9
3.1 Baseline System ...9
3.1.1 Common Data Set ...9
3.1.2 Common Data Characteristics... 10
3.1.2.1 Comprehensive ... 10
3.1.2.1.1 Scope ... 10
3.1.2.1.2 Formats... 11
3.1.2.2 Accurate ... 12
3.1.2.2.1 Existing Data ... 12
3.1.2.2.2 New Data... 12
3.1.2.3 Timely... 12
3.1.2.4 Accessible ... 13
3.2 Spatial Querying... 14
3.3 Ubiquitous Computing... 14
4. COGENT DATA FRAMEWORK ... 15
4.1 Requirements... 15
4.1.1 Depiction... 15
4.1.1.1 Selection ... 15
4.1.1.2 Collection ... 16
4.1.1.2.1 Identification... 16
4.1.1.2.2 Acquisition ... 16
4.1.1.2.3 Verification... 16
4.1.1.2.4 Storage... 16
4.1.1.3 Digitization... 18
4.1.2 Integration ... 18
4.1.2.1 Data Format Standardization ... 19
4.1.2.2 Data Access Mechanism Standardization... 19
4.1.3 Connection ... 19
4.1.3.1 Object-relational Data Model ... 20
4.1.4 Evolution... 22
4.3 Temporal Database ... 23
4.4 DIORAMA Design Outline ... 23
5. ENTERPRISE GIS ARCHITECTURE ... 25
5.1 Backend Database System (Data Tier) ... 26
5.1.1 Importance of a Standard Data Format and Retrieval Mechanism ... 26
5.1.2 Importance of an Integrated Repository System ...27
5.1.3 Challenges of an Integrated Repository System ... 27
5.2 Middleware System (Business Logic Tier) ... 28
5.3 Parallel and Distributed Computing ... 29
5.3.1 Parallel Algorithm Implementation... 30
5.3.2 Hardware Costs ... 30
5.4 Customized Client Applications ... 30
6. NC STATE DISASTER MANAGEMENT SYSTEM (DIORAMA) ... 32
6.1 Database Server (Data Tier) ... 32
6.2 Application Server (Business-logic Tier) ... 34
6.2.1 Capturing Business Logic ... 35
6.3 NCSU Customized Client Application... 36
6.3.1 Features of NCSU Client Application ... 36
6.3.1.1 Ease of Use... 37
6.3.1.2 Robust Error Checking Mechanism... 37
6.3.1.3 Support for Sophisticated Spatial and Attribute-based Queries ... 37
6.4 Parallel Computing ... 42
6.5 DIORAMA’s Contribution ... 42
7. CONCLUSIONS ... 45
8. FUTURE RESEARCH RECOMMENDATIONS ... 46
8.1 Service-Oriented Inter-Agency Participation Framework ... 46
8.2 Accommodation of GPS Handheld Devices in Enterprise System ... 48
8.2.1 Web Service Framework ... 48
8.2.2 Platform Independent Code ... 48
8.3 Disaster specific analysis capabilities ... 48
9. REFERENCES... 49
10. APPENDICES ... 55
10.1 Design of Data Model ... 55
10.1.1 Requirements Analysis ... 55
10.1.1.1
Representation of Requirements Analysis ... 55
10.1.2 Conceptual Model ... 57
10.1.2.1 Different Entity Attribute Types... 58
10.1.2.1.1 Simple Versus Composite ... 58
10.1.2.1.2 Single-Valued Versus Multi-Valued Attributes ... 58
10.1.2.1.3 Stored Versus Derived Attributes ... 58
10.1.2.1.4 Complex Attributes ... 58
10.1.2.2 Representation of ER Model... 58
10.1.3 ER – to – Relational Mapping...59
10.1.3.1
Regular Entity Types... 59
10.1.3.2 Weak Entity Types... 62
10.1.3.4 1:N Relationships... 62
10.1.3.5 Multi-Valued Attribute ... 62
10.2 SQL Code... 63
8.2.1 SQL Code for Creating Tables... 63
LIST OF TABLES
Table 1 Sampling of Disaster Categories...2
Table 2 Existing System's Capabilities ...8
Table 3 Storage Requirements... 17
Table 4 Non-Normalized Table ... 63
LIST OF FIGURES
Figure 1 Disaster Preparedness Phases (adapted from Johnson 2003 and USDFA 2003) ...2
Figure 2 Disaster Community Need ...5
Figure 3 Disaster Preparedness Phases ...6
Figure 4 Data Sets Showing Common Data Set... 10
Figure 5 Data Collection Plan ... 17
Figure 6 Graphical and Tabular Information Representations ... 20
Figure 7 ORDM Building Representations ... 21
Figure 8 ER Diagram for a prototype IMIS ... 22
Figure 9 Inheritance ... 23
Figure 10 Types of Generic System Architecture ... 25
Figure 11 NCSU 3-Tiered System Architecture Design... 26
Figure 12 Middleware (adapted from Bernstein 1996)... 28
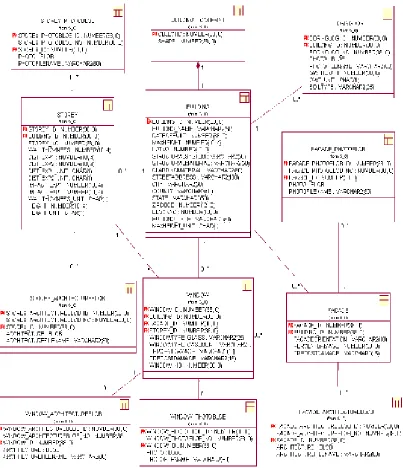
Figure 13 UML Conceptual Schema for DIORAMA’s Database (Pradhan 2003)... 33
Figure 14 DIORAMA’s Three Tiered System Architecture Design ... 34
Figure 15 Use Case Modeling for Querying Database ... 35
Figure 16 Sequence Diagram for Querying Database ... 35
Figure 17 Example of Querying Portion of Graphical User Interface... 36
Figure 18 Popup Menu for Adding/Updating/Deleting Building Information ... 37
Figure 19 GUI Frame to Enter Building Information... 38
Figure 20 Error-Checking Mechanism ... 38
Figure 21 Query Interface ... 39
Figure 22 Façade Query GUI ... 40
Figure 23 Query Results... 41
Figure 24 Displayed Query Results ... 41
Figure 25 Speedup Graph for Parallel Dijkstra & Parallel Floyd-Warshall Algorithms ... 43
Figure 26 Interagency Participation Network ... 46
Figure 27 SOA Components ... 47
Figure 28 Data Modeling Process... 55
Figure 29 Use Case Modeling for Data Entry/Update/Delete... 56
Figure 30 Use Case Modeling for Querying Database ... 57
Figure 31 Notations for ER diagrams (adapted from Elmasri and Navathe 2000) ... 59
Figure 32 ER Diagram for DIORAMA ... 60
1. INTRODUCTION
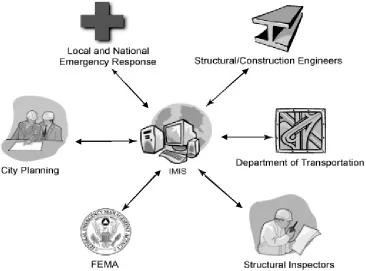
The September 11, 2001 attacks on the World Trade Center (WTC) acutely demonstrated the need for an integrated management information system (IMIS) to assist in simultaneously assigning governmental services and resources for regular programs and emergency response (Flax et al. 2002). Although the majority of American cities now have electronic base-maps to facilitate urban planning, few of these base-maps have disaster management capabilities. Even amongst those that do, there are significant functional limitations with respect to (1) accessing data collected by non-disaster management branches of government and (2) supporting data analysis capabilities. Impediments exist because of organizational, computing, and charter characteristics of these systems (e.g. Uddin and Engi 2002).
The challenges of data access, spatial querying, and information sharing across multiple users, particularly during disaster response have been identified as major technical challenges (Goodchild 2003, Mansourian et al. 2005, Zerger and Smith, 2003). These obstacles exist in large part due to the proprietary, standalone, and segregated nature of the current disaster management systems (DMSs), which prevents participation in efficient data gathering and sharing capabilities beyond the purview of individual departmental authority. Consequently, these systems are of circumscribed utility, when responding to major disasters (Greene 2002, Flax et al. 2002, Cutter 2003). A new approach to the design and implementation of IMISs for managing disasters is needed. This report assesses various disaster related phases in terms of the emergency response community, outlines current system limitations, defines essential system features, and introduces a portion of DIsaster Operations, Risk, Abatement, and MAnagement (DIORAMA), a recently prototyped disaster management system (DMS) developed by the authors.
The initial motivation to develop DIORAMA was to create a system capable of supporting highly detailed, blast-damage analysis for urban areas that had been subjected to high explosive detonations. Patterns of energy dissipation and blast-damage cannot be understood thoroughly, without powerful three-dimensional (3D) querying capacities. Since inclusion of actual pre-and post-blast condition data of building components, as well as entire structures, was deemed crucial to comprehending vulnerabilities, extensive data collection of the built-environment became paramount. Such information was essential both in terms of post-incident performance assessment and in applying those assessment outcomes to other structures. As such, a continuous cycle of information was needed to analyze urban explosions and their attendant hazards throughout all phases of the disaster management process. In this report, the requisite computer architecture for such a disaster management system is illustrated and multi-hazard, disaster analysis needs are used to illustrate how the concepts here presented are widely applicable.
1.1 Disasters
A disaster is defined as a “sudden calamitous event bringing great damage, loss, or destruction” (Merriam Webster 2003). A sampling of disasters may be generalized into interrelated or similar groupings based on the cause, location, and type of community affected (Table 1). Although these broad categories include events that are highly distinct in their nature, environment, and impact, many have commonalties with respect to the data sets required to address these disasters in a multi-phase context (Figure 1). A simple example is in the planning and execution of large-scale evacuations. Such evacuations may be necessary during earthquakes, hurricanes, forest fires, and nuclear contamination. To find proper evacuation routes, the same road network data set is required, irrespective of the disaster. By focusing on common data sets, although not fully reflective of any particular disaster or specific phase of the disaster management cycle, an initial framework can be created from which to prototype a system to address a wide range of disasters.
Such an approach holds promise for addressing the complexities of disaster management. Unfortunately, as will be fully described below, the emerging geographic information system (GIS) based solutions being developed by governmental agencies and private companies do not accommodate the multiple phases that occur as part of the disaster management process.
Table 1 Sampling of Disaster Categories
1.2 GIS Use in Disaster Management
Increasingly, community vulnerability to natural and manmade disasters is being recognized (Godschalk 2003). The level of vulnerability is an indication of the extent of the community’s disaster readiness. Although disasters occur in a wide variety of manifestations, all happen within a specified geographic area, and, thus, all disaster analysis must be viewed in relation to that location (Johnson 2003). Understanding geographically-based information is critical to protecting communities from disasters (Radke et al. 2000).
The general availability of computing as a routine part of community planning and management facilitates an information technology role in decision-making before, during, and after disasters. For instance, during a disaster, multiple emergency management responders need to share information, which requires access to databases and computer-generated maps. Simultaneously, they need to perform mission-critical, data analysis to assist search and rescue operations (ESRI 1999). GIS-based tools have proven to be important aids in disaster preparation and rapid response (Johnson 2003). Digital maps and spatial analysis tools (enabled by GIS) offer a common template on which a wide variety of data can be quickly placed, measured, and analyzed, which can result in better informed decisions (Greene 2002). Thus, to be truly prepared for a disaster, emergency managers need a GIS-based tool to organize, integrate, analyze, and distribute data associated with various phases of disaster management.
The applications of GIS range from identifying evacuation routes during flooding to determining hazard zones during forest fires. GIS is being increasingly favored, because of its capacity to associate existing databases with geographic features, to query existing databases based on the geographic features, and to render multi-dimensional visualization of spatially queried data. These capabilities are especially useful in relation to disaster events, because of the dual spatial and temporal nature of these incidents. For instance, GIS can help both identify the likely path of a flood based on topographic features and determine the level of flood at a particular time. Similarly, for forest fires, GIS can help both identify areas of highly flammable vegetation near populated areas and calculate the evacuation time based on the rate of fire expansion.
Advances in GIS can play an important role in smart decision making before, during, and after a disaster. For example, urban planners need detailed information related to arrangements of buildings, roads and utilities to conduct risk assessments, while emergency personnel require much of the same basic information for search and rescue operations during and after a disaster. Digital maps and spatial analysis of this kind can be produced by GIS-based system, where a common template is created on which varied data can be quickly placed, measured, and analyzed – resulting in more well-informed decisions (Greene 2002).
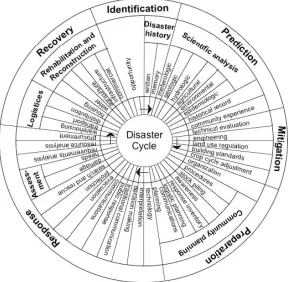
1.3 The Six Disaster Phases
The authors propose that the success of any disaster management system is dependent upon capabilities in six disaster-related phases: (a) Identification, (b) Prediction, (c) Mitigation, (d) Preparation, (e) Response, and (f) Recovery (Figure 1). Within DIORAMA these terms have been defined as follows.
• Identification is an inventorying of a community’s assets focusing mainly on the physical infrastructure (e.g. roads, buildings, bridges), although human-oriented capacities such as fire stations and hospital beds may also be included.
• Prediction is the conceiving of a danger and assessing its potential impact on the community, which may include property damage, service interruption, and loss of life. Prediction also estimates losses for a particular disaster of a certain magnitude for a specific community.
• Preparation includes those activities needed to prepare for emergencies that cannot be fully mitigated against either because of cost or the nature of the disaster. Preparation may include expanding emergency services, identifying emergency housing areas, or posting of evacuation routes.
• Response occurs during and immediately following a disaster and is typically focused on rescue activities, fire fighting, and looting prevention.
• Recovery is the rebuilding of the community and restoring services.
To illustrate these six phases and to demonstrate the multi-disaster applicability of the proposed structure, a hurricane evacuation scenario is provided. To minimize hurricane-induced losses, each of the above-defined phases must be addressed within the disaster management system (DMS). The DMS must host the required data and support relevant analytical capabilities.
• Identification designates at risk communities and other key infrastructure elements vulnerable based on past hurricanes and anticipated weather trends.
• Prediction establishes the level of vulnerability of a particular town or region to a hurricane of a specific magnitude; for a hurricane this would include damage caused by both high winds and flooding, and their impacts on transportation, housing, and commerce.
• Mitigation includes changing the zoning laws thereby decreasing the number of at risk facilities, altering the features of the coast by dredging, beach restoration or installation of wave breakers.
• Preparation determines safe routes for hurricane evacuation and makes such information available. Changing conditions must be reflected and communicated without any delay (e.g. due to alteration of the hurricane’s path).
• Response encompasses the immediate rescuing of individuals and arranging of their subsequent housing and feeding, as well as road closing.
• Recovery includes debris removal, building inspection, and bridge reconstruction. Prioritization schemes need to be developed based on real-time information.
2. LITERATURE REVIEW
The required system must accommodate several levels of data entry and access for each temporally-based phase in a systematic way. At this most fundamental level, there must be a map depicting streets, utilities, buildings, and other major components of infrastructure in an electronic format. The next level of functionality is integration of associated attribute data with these key features of the infrastructure. A variety of feature attributes must be assigned to each component of the infrastructure (e.g. for a utility, its size, shape, age, and depth of embedment). These key features of the infrastructure should be linked to their visual representations in an identifiable manner (e.g. gas lines distinguishable from water lines, locatable emergency services). Recording of data must be mutable (as external factors change) and capable of integration with other mutable data. Thus, in its most elementary form the conditions, collectively known as a baseline data system of a community, must be represented. The baseline data system can be defined as the scope and nature of the overall informational resources needed to prepare for and respond to a variety of disasters.
Apart from the establishment of baseline system, the disaster management system should support complex spatial analysis and querying (e.g. finding the shortest path for the safe evacuation during a hurricane). GIS-based systems help to consolidate the establishment of such baseline system and provides powerful spatial analysis capabilities thus making them indispensable for disaster management systems. Finally, the system must be configured to meet real-time data collection and dissemination needs of disparate agencies that occur during a disaster (Figure 2).
2.1 Existing Systems
Unfortunately, despite multi-billion dollar investments in preparedness and simulated training exercises (GAO 2003), the majority of American cities and municipalities are still inappropriately or minimally prepared for disasters as clearly demonstrated by emergency response to hurricanes Katrina and Rita. Reasons range from the fiscal to the political, but the computer architecture of many of the best known DMSs have inherent computing limitations that prevent their full applicability to disaster management. Existing systems are typified by discrete, non-networked arrangements that are largely ineffectual in disaster prediction, and completely incapable of assisting in various phases of disaster preparedness as depicted in Figure 3. Thus, a system founded on robust enterprise-level architecture capable of supporting multiple users concurrently and processing complex analysis in real time is required, while providing adequate redundancy for possible data transfer failures.
2.1.1 Inadequacies of Current Systems
Some cities such as New York have established baseline systems with digital maps of public utilities, road networks, and building footprints. Unfortunately these systems are typically standalone and of circumscribed functionality, because they lack the capability to exploit the stored data for analysis (Flax et al. 2002). The establishment of a baseline system represents a necessary but insufficient condition for a viable, fully functional, multi-phase system. Of those cities with baseline systems, only a small percentage of them have disaster related capabilities, and of those, no city has yet designed and implemented a computer system capable of supporting the requisite Response and Recovery that are critical during a major natural or manmade disaster. Instead, emergency aspects of Response and Recovery are strictly supported by 911 calls and aerial surveillance, which do not support other aspects of disaster management.
Existing systems are typified by discrete, non-networked arrangements that are largely ineffectual in many aspects of disaster management. Two of the best-known DMSs are known by their acronyms HAZUS and CATS. Evaluations of these and the Denton and Frost commercial system are presented below, with respect to multi-phase disaster needs.
Figure 3 Disaster Preparedness Phases
Identification
Prediction Preparation
Recovery Response
2.1.2 HAZUS-MH
The Federal Emergency Management Agency (FEMA) developed a hazard prediction program under contract with the National Institute of Building Sciences: Hazards United States – Multi-hazard (HAZUS-MH) uses GIS software to map and graphically depict hazard data, economic losses, and buildings and infrastructure damage from hurricanes, floods, and earthquakes (HAZUS 2005). The GIS technology combines hazard layers with national databases, including datasets of demographics, building inventory, critical facilities, transportation systems, and utilities. The system applies both loss estimation and risk assessment methodologies for a limited set of disasters.
Although HAZUS-MH is equipped to model the probability and level of pre-incident risk for a variety of disaster events, a major limitation of the system is its incapability to support real-time response and recovery activities and multiple device types (ubiquitous computing) following a disaster. Thus the software addresses only identification, prediction, and preparation phases of Figure 3.
2.1.3 CATS
The Consequences Assessment Tool Set (CATS) is a product of the Defense Threat Reduction Agency in conjunction with FEMA (DTRA 2002). CATS is an ArcView application for predicting hazards from hurricanes, earthquakes, weapons of mass destruction, and conventional explosives and for assessing the ensuing consequences. CATS allows the user to simulate scenarios for training and planning, assess affected population and infrastructure based on real-time weather information, initiate resource deployment, evaluate further needs, and locate resources for a sustained response. As CATS is primarily a training tool, it cannot support real-time Response and Recovery activities (Table 2).
2.1.4 DMI-Services
Similarly, Marine Corps Systems Command and FEMA have initiated another multi-million dollar project named Disaster Management Interoperability Services (DMI-Services) to provide a shared “information backbone” regarding emergency information management among emergency responders, government offices, and authorized non-government organizations during a crisis (DMI-Services 2003). The intent of this service is to leverage existing databases and applications to provide an interoperable suite of tools that organizations can use to obtain needed capability, information, and seamless connectivity to other stakeholders in the incident response community. Though this system provides a strong information background, it lacks the tools needed to do proper damage assessment before, during, and following a disaster. Therefore, this system provides the basic “information backbone” infrastructure to address response and recovery phases of Figure 3, but does not provide the adequate tools to do proper analytical assessment of any of those phases.
2.1.5 Deaton and Frost Commercial System
There are also commercially available programs for post-disaster data consideration, such as the one developed by Deaton and Frost (2001), which integrates a global positioning system, GIS software, digital photography, and handheld computing technology. The system allows both quantitative and qualitative data collection, but primarily focuses on baseline and post-disaster data collection. Thus, this system addresses only the Identification and Recovery phases (Table 2).
Table 2 Existing System's Capabilities
Disaster Related Phases
Hazus-MH CATS DMI-Services Deaton & Frost DIORAMA
(Present + Future)
(a) Identification P P P P
(b) Prediction P P F
(c) Mitigation P P F
(d) Preparation P P F
(e) Response P F
(f) Recovery P P F
(Note: P stands for present features of the system, while F stands for future additions to the system) Existing
3. SYSTEM REQUIREMENTS
An ideal DMS should be enabled for performance in all six disaster management phases within a single integrated system. To achieve this, a DMS must have three components: (a) a baseline system, (b) spatial querying, and (c) ubiquitous computing.
3.1 Baseline System
A baseline system establishes the basic information backbone required for a DMS (Laefer et al. 2005a). To best achieve deployment and use of a disaster management system, it should be sharable across local, state, and federal jurisdictions, thereby reducing duplication of data collection efforts across organizational units. The development of data collection methods for pre- and post-disaster related activities using a multi-hazard approach is critical to this effort (Uddin and Engi 2002, Uddin et al. 2003). All of this, however, is predicated upon a strong consensus amongst the necessary players as to what data is to be collected, the collection mechanism, and its format.
3.1.1 Common Data Set
The multi-event nature of a disaster can be considered in a more systematic method in terms of commonalities between disaster events. Disasters can be generalized into interrelated or similar groupings, such as cause (i.e. natural or manmade), location (e.g land, water, air), and the type of community impacted (urban or rural). Although these broad categories include events that are highly distinct in nature, intensity, geographic distribution, and duration, many share commonalties related to the data sets required to address these disasters in a multi-phase, multi-event context.
For instance, evacuation may be a required process during earthquakes, hurricanes, forest fires, and nuclear contamination. To find proper evacuation routes, the same road network data set is required, irrespective of the disaster. Yet an effective DMS system must be more than a repository of street layouts and fire hydrant locations. A more detailed level of knowledge is needed. For example, safe congregation areas should be identifiable for emergency medical treatment administration and decontamination. This requires identification of empty lots, barricadable roads, and public assembly structures, as well as an assessment of their occupancy capacity and their proximity to water and electricity.
Figure 4 Data Sets Showing Common Data Set
All of this, however, is predicated upon a strong consensus amongst the necessary players as to what data is to be collected, the collection mechanism, and its format. What is presently needed is guidance in the prototyping of a data collection system that is appropriate for urban planning, risk analysis, and disaster management. This report outlines the requirements to prototype such a data subset and the general characteristics of the data beyond its mere content, specifically in the four areas of comprehensiveness, accuracy, timeliness, and accessibility. The applicability of each is shown through its application to a common data set.
3.1.2 Common Data Characteristics
For an effective DMS baseline data system, the following common data needs were identified as part of the 2004 National Science Foundation workshop: (1) unique designators for infrastructure elements, (2) access routes, (3) safe congregation areas, (4) building egress points, (5) building structural support systems, and (6) high vulnerability elements. These six common needs are used to illustrate the common data characteristics of comprehensive, accurate, timely, and accessible. The emphasis in this report is on buildings, because in many ways they represent the greatest data collection challenge, because their ownership is more distributed than publicly financed projects, and because their construction exhibits an extraordinarily high level of variability in composition, geometry, and usage.
3.1.2.1 Comprehensive
The term comprehensive, in relation to data collection, should not be misunderstood to signify everything that can be collected. If a community collected and electronically stored each detail of every constructed facility in all of its minutia, the likelihood that the system could be accessed quickly and efficiently for disaster response would be low – simply as a direct outgrowth of the magnitude of the data being stored. What is needed to adequately depict the multi-phase, multi-event nature of a disaster is a subset of the infrastructure data. Such data relates to road networks, utility systems, building layouts, and the relationships between all of these elements. Collection of such disparate data requires consensus as to both scope and format. Cities and municipalities cannot mandate data collection from facility owners and utilities without adequate knowledge of the scope and format in which to specify the collected data. The concepts are illustrated below using the above listed, six common data needs.
3.1.2.1.1 Scope
clearly specified. As an example, unique designators for infrastructure elements would consist of street addresses (or cross-streets) and GPS positions. Access routes between points of interest for emergency vehicles require information on the transportation grid of roads, tunnels, and bridges, especially height, width, and weight restrictions due to the potential need to transport heavy rescue and recovery equipment. Information for safe congregation areas must extend beyond knowledge of street layouts and fire hydrant locations. For staging temporary medical treatment areas and creating post-evacuation meeting points, parking lots, wide sidewalks, and other unobstructed areas should be identifiable, as well as information about their proximity to water and electricity. To facilitate search and rescue, immediate identification of all above-ground and subsurface egress points should be known for all multiple-occupancy and public assembly structures. Building floor plans and elevations are needed to identify doors, windows, and stairwells. Subsurface transportation routes and large-diameter, utility line layouts are also required.
The structural aspects of buildings impacted by disasters also need to be known for potential damage assessment, as well as for risk evaluation of adjacent structures. The type and layout of the structural support system (e.g. unreinforced masonry, steel skeleton, prefabricated concrete) and its key features must be known, along with all high vulnerability elements (e.g. glazing and glass cladding) via plans and section drawings. A full set of structural drawings is ideal to secure this knowledge but may not be reasonable due to data storage requirements. Furthermore, post-disaster building inspectors could preview each building’s structural system and cladding details just prior to its post-disaster, field inspection for improved accuracy and safety. As personal digital assistant systems continue to evolve in their applicability to disaster management (Deaton and Frost 2001), the value of such information to on-site rescue and recovery personnel will continue to increase (Huyck and Adams 2003). The scope of the available data in an IMIS system should be reflected in a detailed catalogue viewable by entity, quantity, source, and format.
3.1.2.1.2 Formats
A major impediment to an effective IMIS is finding existing data in a format that can be stored and retrieved in a rapid and understandable manner. Data formatting is especially important as it may restrict or promote cross-format sharing and ultimately usability. For example, the data harvesting and integration efforts in New York after September 11 were severely hampered by the wide variety of data types and formats collected by each of the contributing entities (Huyck and Adams 2003). As a result, only the most rudimentary conversions and connections were made between the data (Flax et al. 2002). To facilitate ease of use for both data entry and retrieval, there should be a predefined set of data categories available for each database field, in addition to open querying.
Presently, data may be in the form of a spatial representation (where a structure or element is physically located, as in the case of access routes and safe congregation areas), an attribute (e.g. sizing, material characteristics, age for high vulnerability elements and unique designators for infrastructure elements), or a graphical depiction (photographs, videos, or drawings of building egress points and building structural support systems). Of particular interest are the spatial and geometric features of the total infrastructure and of specific building geometries, structural systems, and cladding materials. Relevant information should appear in a relational database so that it can be queried. The information should also appear in 3D, GIS manifestations.
integration. Among the most useful standards (in terms of completeness, flexibility, and life expectancy) are the Simple Features Specification and the Spatial Data Transfer Standard (SDTS 1997). The Open GIS Consortium (OGC) organization, was established by the United States Geological Survey USGS for standardized data exchange (OGC 2003). These standards aid data digitization, modeling, and storage (SDTS 1997).
3.1.2.2 Accurate
Accuracy is the second key characteristic for baseline data (Rasdorf 2000). Broadly speaking, data errors emerge from two sources: (1) new data entry and (2) errors in existing records. The second scenario is complicated by the fact that the data is retrieved from disparate sources (because of incomplete existing records), which may themselves contain inaccuracies. For older cities, where buildings may date as far back as the eighteenth century, much of the data may not be available in any format. Even important landmark buildings may be without known as-built drawings, as was the case with Carnegie Hall until late, twentieth century renovations (Laefer et al. 2002). In reference to egress points, structural support systems, and high vulnerability elements, the lack of as-built drawings poses a substantial impediment. Accurate as-built drawings hold within them the data that empowers the base IMIS and all supplementary pre- and post-disaster analyses. Much of this data is available from existing sources.
3.1.2.2.1 Existing Data
Existing data sources may include Sanborn maps (ProQuest UMI 2003), local colleges, design offices, government agencies, architectural organizations, historical societies, older community residents, and Internet sources. Unique designators, and access route information may be available from governmental records, and maps (both digital and non-digital). Identification of safe congregations areas requires those above-listed elements, as well as building typology data and capacity, not dissimilar to the base information needed for egress points, structural support systems, and high vulnerability elements. The focus is the building’s geometry and nature and how it is assembled. Critical data should be verified via multiple, published and web-based sources to minimize new errors and to prevent further propagation of old ones.
3.1.2.2.2 New Data
To reflect the evolving nature of a community, new data must be collected continuously. The occurrence of events (both disaster and non-disaster related), from flooding to new road construction must be documented promptly and accurately to exploit the full potential of the IMIS. This new data must be combined and integrated with the existing data within the IMIS. Each update establishes a new baseline condition (Lim et al. 2001).
3.1.2.3 Timely
The third criterion is timeliness. With existing and new data constantly being added, a baseline system must provide efficient data storage, because of the need to obtain real-time data as a disaster is occurring. Decision makers, incident commanders, emergency responders, and city managers simultaneously need time-sensitive, spatial information. Since timing is critical for evacuation, search and rescue, and prioritization of utility service restoration, all required data sets must be pre-stored in a centralized repository system. Such pre-emptive activity ensures that mission-critical data can be retrieved and disseminated amongst the necessary personnel and agencies for timely analysis.
the severity of the observed damage. Additionally, all images must be date stamped, and data must be entered into the system contemporaneously with any changes that occur. The building permitting process provides a likely venue for this. Currently, construction information is submitted to the local building authorities as the basis for permitting and inspections. Depending upon building usage, different levels of documentation are required for framing, general layout, foundations, and utilities.
Once a permit is issued, many accuracy-related problems may arise. Plans may change after the permit is issued, either because of differing site conditions or the owner’s evolving needs, all while the information on file remains unchanged. The accuracy of as-built drawings is a regular problem in the construction industry, even for non-digitized drawings required by contract at the end of a project.
A fully functioning IMIS requires a high degree of compliance in the submission of accurate, as-built drawings to the permitting agency. This will require a change in culture, as well as procedure. The current manual method still used by most communities is dated and inefficient, resulting in delays and higher costs from unnecessarily slow processing time. As documents wait for approval, so does the construction. Manual data entry offers few benefits and requires enormous resources from both owners and public officials. Consequently, data is often simply not updated, limiting the usefulness of the file records. Keeping the system updated, however, is a major task, which requires constant inputting of new and changed data, as well as regular error checking. Structures and sites are dynamic. Thus, record systems must reflect these changes, whether this is a modification to access routes in the road network or alterations of egress points in a school building, or the unique designators of major infrastructure elements due to bridge widening.
The permitting process has the potential to become highly automated and entirely electronic. The permit issuer could connect to the IMIS, allowing for an immediate updating of proposed changes for local structures (both existing and new), with electronic copies of plans and specifications attached for ease of retrieval. The IMIS could be internet-enabled and accessible on a limited basis via a username and password. This would allow secure access at virtually any internet-enabled location. Automation of the permitting process has the dual benefit of ameliorating the aforementioned accuracy issues and keeping the IMIS updated. As part of the attribute data, drawings and photos can be archived to reflect the evolution of a building or site, potentially providing long-term planning benefits for disaster and non-disaster scenarios. Changes in the building’s structural support systems, and high vulnerability elements aspects need to be accurately reflected, especially in the aftermath of a crisis, when a multitude of changes may need to be documented. Instead of being overwritten, the data can be archived in the same manner as the drawings and photos are, allowing the user to see both a visual and text oriented timeline of the evolution of the building, including any disasters that have damaged the building and any subsequent repairs.
3.1.2.4 Accessible
accessibility do not address a wide variety of computer processing concerns related to concurrent data entry, data conflict resolution, and redundancy (Pradhan 2003).
Finally, an in-depth understanding of images must be established as to an appropriate subset of data so that content can be readily archived in a manner that is meaningfully catalogued and available for retrieval, analysis, and display. A methodology of pictorial collection standardization is a critical component for a fully functioning IMIS. More difficult than culling visual components for textual entry into the relational database is having the capacity to query graphical elements in a highly exact manner. There must be a visual marking and querying system based on both a point and click system and with a textual tagging component. To date such a system is not yet available.
3.2 Spatial Querying
A DMS should support the complex spatial analysis required for all of the six disaster-related phases. As mentioned earlier, from identification to prediction, mitigation to preparation, response to recovery, each phase inevitably leads to the next, in a continual quest for a safer environment in which to live and work (Johnson 2003). Complex spatial queries offer unprecedented opportunities for advances in community safety. Examples of useful spatial queries include locating the shortest evacuation path and optimizing post-disaster resource distribution (e.g. shelters, food depots) for displaced people.
3.3 Ubiquitous Computing
4. COGENT DATA FRAMEWORK
To have an effective disaster management system, three criteria must be met:
• Cogent data framework (CDF),
• Efficient infrastructure management information system architecture, and
• Adequate data analysis capabilities.
This section addresses the first criterion, the establishment of a cogent data framework, by defining the roles that data play in the construction and usage of an infrastructure management information system. The basis on which to judge the framework’s cogency is exclusively reliant upon the rules, context, and format in which the data is collected, stored, and updated, as will be outlined in detail in this section.
4.1 Requirements
For a data framework to be cogent, it must accommodate four key components: depiction, integration, connection, and evolution.
• Depiction is the physical representation in a digital format of the physical environment including streets, utilities, buildings, and other major infrastructure components.
• Integration is the combination of various required data sets into a single, integrated repository (e.g. layouts of all utility systems).
• Connection is the establishment of relationships between key infrastructure features and various attribute data (e.g. size, shape, age, and depth of embedment of a section of a utility line) and their linkage to identifiable visual representations (e.g. a gas line versus a water line).
• Evolution is the periodic updating of a data set reflective of changes instigated by various external factors (e. g. replacing or extending utility lines).
For an IMIS to be effective, a community’s infrastructure must be represented including building, utilities, roads, and bridges. In many ways, buildings represent the greatest challenge, because their construction and ownership is more distributed than publicly financed projects or private utilities (Kevany 2003). This distributed ownership leads to an extraordinarily high level of variability in their composition, geometry, and usage. As such, the topic of buildings will be used to provide a detailed illustration of the four key components listed above.
4.1.1 Depiction
The first step towards establishing a CDF is the depiction of the built environment. Depiction includes data selection, collection, and digitization. The data may include various data sets including photographs; digitized and paper drawings of architectural and structural elements; transportation network information; utility maps; periodic building or façade inspection reports; GIS maps; and GPS building and street locations. The first subtask in depiction is selection.
4.1.1.1 Selection
Consensus across the disaster management community must be established as to requirements for data selection, both scope and format. Depending upon the needs, concerns, and resources of a community, this may be as basic as all structural drawings and all floor plans for every structure, except single-family homes. In contrast, the needs may be as elaborate as identifying glazing specifics (e.g. casement type, glass thickness), hazardous materials locations, and protruding architectural details for every multi-story structure. Data selection must be based on perceived or established needs. Once data is selected, it must then be collected.
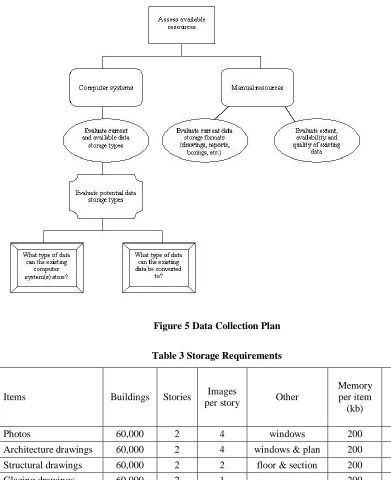
4.1.1.2 Collection
Data collection encompasses establishing requirements, committing resources (staff, hardware, and software), and developing a project plan (Figure 5). Critical to the feasibility of the establishment of an IMIS system is the incorporation of current data and existing systems to develop the baseline system using the following: GIS, a relational database, photographs, and CAD drawings. There must be recognition that many communities already have a wide variety of disparate local data repositories. A new framework must accommodate and integrate the unique characteristics of existing local archiving and address the non-digitized nature of most available data, which is especially relevant for older buildings and smaller communities. Historical data also tends to be highly disparate and extremely decentralized, as it commonly exists in a paper format in city planning departments, older design firms, local libraries, colleges, and historical societies. The dispersed character of the data presents logistical complications for cost-effective collection.
Even data currently being regularly collected is typically warehoused in many physical locations, stored in incompatible formats, and commonly inaccessible to other agencies (Zerger 2003). The existence of relevant data possessed by one agency may even be unknown to another, even though the data may be directly pertinent to the mission of both agencies. To create and implement an effective GIS-based disaster management system, such technical and administrative barriers must be eliminated. The extensive challenges related to data collection include identification, acquisition, verification, and storage.
4.1.1.2.1 Identification
The first step is to evaluate the wide variety of current resources, both manual and digital. Determining the location and extent of both historical and current information is a substantial topic, which requires both the identification of existing resources and the creation of new ones (Laefer et. al. 2005a).
4.1.1.2.2 Acquisition
Gathering all necessary baseline data represents a formidable challenge. Required steps include physical retrieval and logging of what has been obtained, from whom, from where, and what remains to be acquired, as well as a detailed listing of all locations where data has been sought and/or obtained to prevent duplication of effort.
4.1.1.2.3 Verification
All information gathered must be checked for internal consistency and against any other information with which it may be in conflict. As an example, not only must utility and transportation networks be continuous, but they must be physically connected to other elements of the built environment for them to be accurate.
At a minimum, to adequately represent a building, architectural and structural drawings and photographs should be collected and stored for each story of each building side, as well as glazing details; a two-story building was selected as typical. A rough estimate of computer storage is approximately 400GB (Table 3) for the above-mentioned items for a municipal area of 100,000 people that incorporates approximately two buildings per three individuals (residential, commercial, and public sector structures).
Figure 5 Data Collection Plan
Table 3 Storage Requirements
Items Buildings Stories Images
per story Other
Memory per item (kb)
Total memory (GB)
Photos 60,000 2 4 windows 200 103.0
Architecture drawings 60,000 2 4 windows & plan 200 114.5
Structural drawings 60,000 2 2 floor & section 200 114.5
Glazing drawings 60,000 2 1 200 46.0
Total
(GB) 378.0
and analysis. A robust and efficient database system is required to store, retrieve, and analyze excerpts from a potentially enormous multi-media data set. Current GIS data storage file systems (e.g. ArcInfo Coverage format, ArcView Shapefile format) do not allow storing multimedia data sets. Recent advances made in relational databases allow efficient storing and retrieving huge multimedia data sets, but analysis of such data is not yet possible.
4.1.1.3 Digitization
As a prerequisite for retrieval and analysis, meaningful storage of graphical data requires complete digitization. Digitization is the process of converting information from analog to digital information (Smith 2001). In an IMIS system, inspection reports and photographs may need to be digitized, as well as the information pertaining to the road networks, utility lines, building footprints, structural and architectural drawings. Prior to digitization, guidelines need to be developed to achieve necessary data accuracy, consistency, quality, and storage size. Without guidelines, it is difficult for large-scale digitization to meet long-term project goals (UNC-CH 2003). Guideline adoption is standard procedure for libraries prior to digitization of collections (Hazen 1998). As an example, the adopted library digitization guidelines from the University of North Carolina at Chapel Hill propose that images be stored in a Tag Image File Format (TIFF), a type of raster data format.
Digitized data are typically stored in either vector or raster data formats. Vector data is comprised of lines or arcs defined by beginning and end points (Longley 2001). Examples are land parcels, county boundaries, road networks, and utility lines, which are represented as a series of connecting arcs. In raster data, each area is divided into rows and columns, which form a regular grid structure (AGI 2003). Each cell within this grid contains an attribute value, as well as location co-ordinates. The spatial location of each cell is implicitly contained within the ordering of the matrix, unlike a vector structure, which stores topology explicitly. The surface of an area is represented in raster format, where each cell represents the elevation of the area. Output format selection as vector or raster depends on feature types and usage requirements. Geometrical transformations and visualization can be performed faster in a vector format than in raster one, while operations requiring information concerning surface coverage can be performed more easily in a raster format. Roads, utility lines, and building footprints are normally digitized to vector formats, while raster formats are commonly used for elevation data.
4.1.2 Integration
After depiction, the various data sets must be integrated into a single repository. Presently, such integration is rare, even for communities that have already committed extensive resources to related activities. For example, New York City (NYC) has a highly detailed GIS-based base map but has had no plans to: (1) link GIS features to a database of site relevant properties, (2) use the post-incident building inspection reports and documentation (as well as owner-based repair records) related to the September 11 attacks to create detailed, location-based records of changes in baseline condition or (3) compare the state of pre-existing conditions to that of buildings in post-disaster scenarios (Kevany 2003, Dorf 2002).
4.1.2.1 Data Format Standardization
A data format is defined as a specification that defines the order in which data is stored or a description of the way data is held in a file or record (AGI 2003). The selected formats must support community-developed disaster management programs and must be sharable across, federal, state, and local jurisdictions, as there are many elements of the infrastructure that are not wholly controlled by the local building authorities. These range from the obvious (e.g. interstate highways), to high profile targets such as federal courthouses. The problem is difficult to surmount and is exacerbated by decades of non-coordinated data generation. To prepare for disasters, the scope and format of pre-incident data collection efforts need to be both identified and mandated in order to facilitate data incorporation into an IMIS (Laefer et. al. 2005a).
Standardized data formats across multiple organizations, promote cost-effective data sharing. In order to achieve this, standards are needed that allow users to find information and processing tools when and where needed; to understand and employ information and tools independent of platform and location, and help expand GIS capabilities without dominance by a single commercial vendor (Carroll 2003). Such standards are called open standards and they promote data sharing and integration from various sources. Contemporary GIS data formats are inadequate, because both spatial data and affiliated attribute information are stored in a variety of proprietary file formats (e.g. ESRI shapefile, ESRI coverage, AutoCAD dxf). Proprietary file formats hinder integration as they are not based on open standards. Industry consortiums such as the Open GIS Consortium (OGC) have formulated the “simple features specification” (OGC 2003), and the United States Geological Survey has established the “Spatial Data Transfer Standard” specification explicitly for standardized data exchange (SDTS 1997).
Over the past several years, international geospatial standards for GIS have been pioneered to reduce work duplication, optimize resource expenditure, and facilitate information exchange (Clément 2000). Even, the Federal Geographic Data committee has identified as a part of national security concerns (i) development of guidelines and standards for a comprehensive spatial data infrastructure, (ii) interoperability of the systems that process this information, and (iii) guideline establishment for commonality of the processes that collect, manage, and disseminate geospatial information (FGDC 2002).
The common standards help fulfill a key aspect of an enterprise GIS system that of non-proprietary data storage formatting. This, however, only aids data storage. To make the data available to user or client applications, data access mechanisms must also be standardized.
4.1.2.2 Data Access Mechanism Standardization
Standardized data access mechanisms aid the data retrieval process. Structured Query Language (SQL), established by American National Standards Institute, is a comprehensive database language that provides statements for data definition, querying, and updating (Elmasri 2000). Most relational database management systems support SQL as a common standard to facilitate data querying and manipulation, but relation database management systems do not support spatial data. For a CDF to succeed, support for spatial data types is mandatory. OGC’s “Simple Features Specification for SQL” defines a standard SQL schema to handle spatial attributes. Use of both standards for data formatting and manipulation are vital to the success of a cogent CDF to ensure maximum data exchange using minimum resource allocation.
4.1.3 Connection
condition, and speed limit. Likewise, a building, which is represented as a spatial feature, has attributes such as height, street address, and number of stories. By establishing connections between each spatial feature and relevant attribute information, the existing system can be transformed into a substantially more powerful tool than a simple digital map, because of the capability for spatial querying based on the attribute data. For instance, since glazing comprises 90% of all blast-related injuries from an explosion (Mays 1995), window information including glass type, glazing thickness, casement type, damage percentage, and breakage patterns (in the form of photographic images) are requisite for meaningful post-disaster analysis and pre-post-disaster planning.
Figure 6 Graphical and Tabular Information Representations
For blast analysis, total building attribute information such as physical location, number of stories, structural support system, and cladding information must be also housed in the database (Figure 6). Additionally information such as story height, wall thickness, percentage damage, and distance from an explosion are needed and must be systematically stored. Yet, a building is comprised of multiple facades, floors, and windows, and attribute data may need to be simultaneously affiliated with multiple elements. To create multiple, simultaneous connections between spatial features and attribute data, a robust and effective data model is required.
4.1.3.1 Object-relational Data Model
This complexity needs to be captured by the data model for successful analytical GIS operations. Concurrently such operations require systematic and easily retrieved stored data. Distinct attribute information needs to be stored for the building’s individual façades, but a polygon feature does not allow storing the attribute information of an individual façade (Figure 7). Thus, a better representation of a façade is as an individual line feature, where its attribute information can be represented as the attribute data of that line feature (e.g. façade orientation, cladding material, number of windows, etc). Unfortunately, unlike a polygon feature, a line feature representation does not by itself allow complex relations to be established, such as finding the area enclosed by a group of lines that represent the perimeter of a building (an operation supported by a polygon feature). Thus, if a building is treated as a group of line features, such representation requires the development of customized and complicated applications (programs or scripts) to enable the execution of typical spatial operations related to polygon features.
Figure 7 ORDM Building Representations
In order to model such complexity, an object-relational data model (ORDM) is required. An ORDM possesses the capabilities of both object-oriented and traditional relational models (Darwin 2000). With an object-oriented data model, the real world entities are captured as objects, where the data model collectively captures the associated data and the methods to manipulate that object. In contrast, in a relational data model, only the attribute data is captured without the methods to manipulate the entity. In an object-oriented data model, the building’s attributes data (height, address) and methods to manipulate the information (calculating the area of a building) are both encoded in the data model.
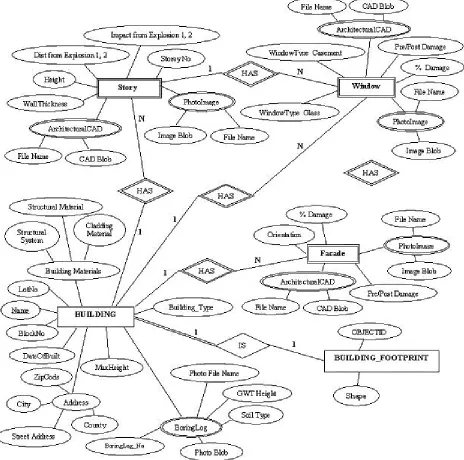
The objective of an ORDM is to collect geographic objects and define the relationships between them to allow representation of a mini-world entity (regardless of complexity and structure) in a database by a single object. Since a geographic entity can be composed of multiple sub-entities, an ORDM allows designing and implementing a geographic entity as composed of sub-entities (Dittrich 1988). For instance, a building, which is represented as a single entity, is composed of facades as sub-entities. An ORDM allows the entry of attribute information for individual façades and considers the building as a single entity without the need for sophisticated and customized programs to handle such relationships. Such required sophistication is inherent to the data model, thus eliminating the need to develop customized applications.
Figure 8 ER Diagram for a prototype IMIS
4.1.4 Evolution
The fourth requirement for a CDF is the capacity for evolution. As communities grow, age, and experience disasters, the configurations and conditions of the infrastructure changes. To address the changeable nature of the data, the CDF data model should be extensible to accommodate future data fields, and the database system should be able to time stamp changes. To facilitate evolution, both an abstract data model and a temporal database are essential.
4.2 Abstract Data Model
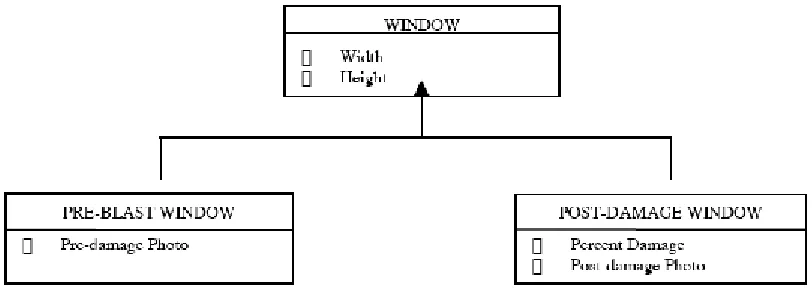
share all attribute information of previously defined windows. As an example, if there is a bomb blast, the windows before and after the blast share common attributes such as width, height and location. They do not, however, share other attributes such as percent of damage (Figure 9). A well-abstracted data model defines the universal set of properties that are true for a broad class of situations. As the data model requires capturing specific classes, sub-classes are extended from the abstract model (e.g. pre-blast window and post-blast window) (Liskov 2000). The extended sub-classes inherit all the base attributes of the parent class (Figure 9). This is known as inheritance in object-oriented modeling. An object-oriented data model provides such abstraction, which is invaluable in the design of a flexible data model to accommodate future and unforeseen needs.
Figure 9 Inheritance
4.3 Temporal Database
A major goal of the IMIS is complete integration with various agencies and entities to accommodate future updates or changes (e.g. architectural and structural renovation of a building). Normally, such changes override the previous versions of the data. In an IMIS, however, maintaining previous versions is imperative to understand the temporal evolution of the data. The system should be able to reflect the culmination of a community’s changes over time and be viewable at previous points in its evolution. This capacity requires time stamping of the data. Spatial features and attribute information that mutate in both disaster and non-disaster environments must have the capability to be updated. Incorporating temporal evolution mandates time stamping all data and maintaining it as queriable information. To achieve this goal, two data time stamps are required: (i) the time when a user enters the new or updated data into the database and (ii) the time when the data was created (i.e. a disaster may occur on May 15, but some of the data may not be entered until three months later). The temporal database should be queriable by date of entry, date of creation/mutation, a queuing mechanism that defaults to retrieve the most recent entry, and one sufficiently flexible to query a user defined point in time. As an example of the applicability of a CDF to multiple disasters, a hurricane scenario is be presented as the application.
4.4 DIORAMA Design Outline
5. ENTERPRISE GIS ARCHITECTURE
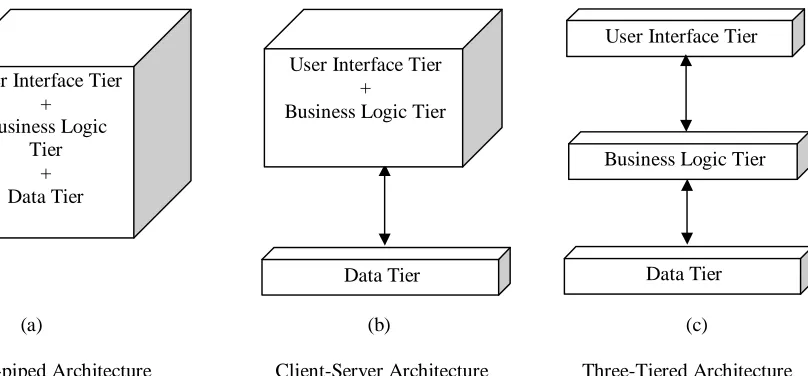
Current disaster management systems are standalone and, thus, do not harness the power of an enterprise GIS framework. These systems are designed either as stovepipe or client-server architecture. In stove-piped applications, the three logical components of GIS: {data, business logic, and user interface (also known as client)} are tightly coupled and distributed as a single entity (Figure 10a). The data component contains the organization’s data, while the business logic implements the functionality or business rules of an application. The user interface component interacts with the business logic component to access the data component. In contrast, in client-server architecture, the data management and the user interface responsibilities are distinct, with no defined place for operations and business logic (Figure 10b). A profound departure from these arrangements is a three-tiered with the capability of being an N-tiered design (Figure 10c), where there is a loose coupling and separation of at least three logical components, which is typical of an enterprise framework.
(a) (b) (c)
Stove-piped Architecture Client-Server Architecture Three-Tiered Architecture
Figure 10 Types of Generic System Architecture
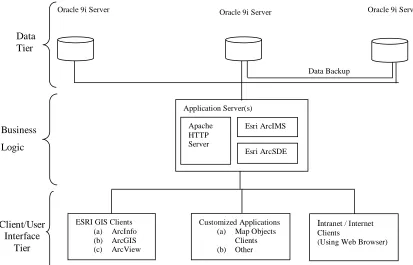
The three-tiered approach, commonly referred to as N-tiered architecture, is an allusion to the unlimited number, N, of intermediary layers between the client and server, which reduces redundancies in both data entry and processing. In N-tiered architecture, the operations and analysis components are explicitly restricted from being coupled to the user interface and data components (Morais 2000). The introduction of the business logic tier enhances performance, flexibility, and maintainability by centralizing process logic. With other architectural designs, a change to a function (service) would need to be written into every application (Eckerson 1995). N-tiered architecture circumvents this requirement, thereby promoting a substantially more efficient and flexible system. The NCSU IMIS system architecture has Oracle 9i database servers as a data tier, application servers (Apache HTTP server, Esri ArcSDETM, Esri ArcIMSTM) as a business logic tier, and client applications (customized client application, Esri GIS applications, and Intranet/Internet clients) as a user interface tier (Figure 11).
Business Logic Tier
Data Tier User Interface Tier
Data Tier User Interface Tier
+
Business Logic Tier User Interface Tier
+ Business Logic