MAXIMUM LIKELIHOOD ESTIMATION
OF
LINKAGE AND INTERFERENCE FROM TETRAD DATARICHARD SNOW
Department of Genetics, University of California, Davis, California 95616
Manuscript received May 23, 1978 Revised copy received November 20, 1978
ABSTRACT
Maximum likelihood equations have been derived for estimation of map distance and interference from two-point and ranked tetrad data. The estima- tors have been applied to data €rom Saccharomyces cerevisiae and Schizosac- charomyces pombe. S. cerevisiae consistently shows quite strong interference over the mapped genome. In striking contrast, S. pombe consistently shows much weaker interference and many crosses exhibit negative interference. In neither species was there a conspicuous tendency for intervals spanning a centromere to show less interference than those that did not. Since the amount of recombination per microgram of DNA i n the t w o species is similar, the difference in interference characteristics seems to be a reflection of some funda- mental difference in the recombination process of the two species.
HE maximum likelihood method is widely used to estimate genetic param- eters, especially linkage values. It has the very desirable property of extract- ing from the data the greatest amount of information available concerning the parameter in question, and so yields an estimate with the smallest variance
( MATHER 195 7). MATHER and
BEALE
( 1942) applied this method to tetrad data, but their analysis was limited to cases where no more than two exchanges occurred between the linked loci and interference was not treated. A general treatment for any number of exchanges and for interference is presented here. For organisms that produce tetrads, there are two types of data obtainable: those from two-point crosses and those from crosseswith
several segregating loci positioned such that the total number of exchanges between the ends of the inter- val can be more-or-less precisely determined. In the first case, the data are in the form of numbers of parental ditype (PD), nonparental ditype (NFD), and tetratype (T) tetrads.In
the second case, the tetrads are classified as to “rank,” that is, as to whether they have resulted from 0, 1, 2,.
.
.
r exchanges in the interval.DISCUSSION
Two-paint crosses, interference not estimated
In a genetic interval marked only at each end, three types of tetrads are pos- sible, and we cannot determine directly the number of exchanges that have
occurred in any given tetrad, because the three types do not uniquely represent a given number of exchanges. Tetrads with no exchanges will of course be scored as PDs, but so also will those with two or more exchanges, the net effect of which is to produce the equivalent of two-strand double crossovers. Tetratypes arise from bivalents that had a single exchange, or from those with two or more exchanges, the net effect of which is to produce the equivalent of three-strand doubles. Nonparental ditypes arise from four-strand doubles as well as from higher orders, the net effect of which is to produce the equivalent of four-strand doubles.
In the absence of chromatid interference, for each four-strand double, there should be on average two three-strand doubles that will give tetratypes, and another two-strand double that will give a parental ditype. With each further exchange, those tetrads that would have been
PD
or NPD will be converted toT,
while half of those that would have been T are converted with equal frequency into either PD or NPD. These relationships have been expressed by SHULT and LINDEGREN (1956) in the formX(PD)
= TX(NPD)
= T
X(T)
= T/2+
PD/4
+
NPD/4where X represents an exchange in a tetrad that would otherwise have been PD, NPD, or
T.
If the interval is so short that the probability of exchanges greater than two is zero or very small, then the map distance can be calculated quite reliably from an expression derived by PERKINS (1949) :
map distance (cM) = 1/2
[
2+f$J,yT]
100.The frequency of tetratypes for any number of exchanges, r, was given by MATHER (1935) as
2 1
AT)
=J[
1-
(--
- J T ].
Since with a large number of exchanges the proportions of PD and NPD should be equal (in the absence of chromatid interference), their proportions can be expressed as
~ ( P D ) = ~ ( N P D ) =-{I 1 --[I 2 -
(-3)
1 'I}=-+-(,--)
1 1 1 '.
(2)2 3 6 3 2
When the interval is long enough so that there is a significant probability of
exchanges greater than two, we assume that the probability of tetrads with 0, 1,
L I N K A G E A N D I N T E R F E R E N C E FROM TETRAD DATA 233
has a mean equal to the mean exchange frequency in the interval
(BARRATT
et al. 1954) :
where
2x
is the mean exchange frequency per tetrad in the marked interval;x
is the map length of the interval in map unitsx
I O 2 (i.e., the mean exchange frequency per chromatid) ; and I is the number of exchanges in the interval(tetrad rank).
The frequency of the three tetrad types is obtained by multiplying ( 1 ) and
( 2 ) by the sum of the appropriate Poisson terms:
* (2x)'
P(PD) = p ( O )
+
----e--2x [p(PD)]r! 9-=2
P(NPD) = 2 - ( 2 x ) r cZx [p(NPD)]
r!
9 - 1 2
x-
* ( 2 x ) r e - 2 x [ p ( T ) ]
.
r !r=1
P(T)
=Since
these three expressions reduce to:
1 1
1
6 2 3
P(PD) = m, =
-
+
-e-22+
-e-3r(4)
( 5 )
1 1 1
6 2 3
P
(NPD) = m, =-
- --e--224-
- 4 - 3 "2 2
3 3 '
P ( T ) = m3 =- - -32
These equations are the same as those obtained by HALDANE (1931) following
a different line of reasoning, except that his exponents were
-x
and'-3x/2
because he usedx
as the mean exchange frequency per bivalent (not per chromatid).Expressions (4), ( 5 )
,
and ( 6 ) are the expectations used for maximum likeli- hood estimation ofx.
The log likelihood expression islogL = a,logm,
+
a210gm2+
a310gm3,
tively. Differentiating and equating to zero gives the likelihood equation of estimation:
(7)
e-2X e-2x 2e-33
dL -
dx -al
-
ml (1+
+
az-
m2 (1 -cx) + a 3 - = O m3.
--
This equation can be solved by iteration and the standard error of x obtained from the calculations used in the solution
(MATHER
1957).Ranked data, interference not estimated
When several closely spaced markers are available along the length of a chromosome, so that double crossing over between them is absent, the number of tetrads with various numbers of exchanges between the end markers can be determined. The expected distribution of ranks can be calculated from (3).
The value of x could be estimated from the p ( 0 ) term (the proportion with no exchanges), but that procedure will not utilize the information available from tetrads of higher rank. Since tetrads of rank 4 or higher will be rare or absent in most cases, only the terms p ( O ) , p ( l ) , p ( 2 ) , and p ( 3 ) and the sum of the terms from p ( 4 ) to p ( r ) need be considered. Thus the expectations can be written as:
p (0) = m, = e-28 p(1) = m, = 2xc2x p(2) = m2 = 2xZe-2"
p ( 3 ) = m3 = -23e-22
p ( 4 .
.
.r) = m, = 1 - c 2 ~ [ 1+
2x+
2x2+
-231
.
4
3
4
3
The log likelihood expression is:
logL = aologmo
+
a,logm,+
azlogm2+
a310gm3+
a,logm,.
Differentiating this expression and equating to zero gives the likelihood equation of estimation:
1-22 2-22 3-22 8 x3@"
- -2a0
+
a, ___+
a2-
+
a3 ~ + a 4 3--
-0, ( 8 )where ao, a,, a2, a3, and a4 are the observed numbers of tetrads with 0, 1, 2, 3,
and 4 or more exchanges, respectively.
The usual way of estimating x from ranked data is to calculate the mean exchange frequency f o r a sample of tetrads. An example from Saccharomyces is given in Table 1. The average exchange frequency is 2194/2123 = 1.03344, which represents 22 in the Poisson expression (3). Hence x = 0.51672. The estimate obtained from (8) is 0.51688, the slight difference being due to round- ing errors and to the truncation of the rank classification at 4. Hence, the usual procedure leads to the maximum likelihood estimate.
dL
dx X X X m4
L I N K A G E A N D I N T E R F E R E N C E F R O M TETRAD DATA 235
TABLE I
Analysis of ranked tetrads f r o m Saccharomyces cerevisiae (daia f r o m MORTIMER and FOGEL 1974) Calculated Calculated
Tetrad Number of Number of number of number of tetrads,
rank tetrads exchan es tetrads (Poisson), with interference
( R , ) ( 4 ( R ' J no interference (k = 0.22785)
0 333 0 755.32 333.00
1 1406 1406 780.25 1438.73
2 367 734 402.99 303.62
3 14 42 138.76 42.71
4 f 3 12 46.67 4.94
2123 21 94 2122.99 2123.00
This result means that an explicit solution should exist for the nontruncated form of the derivative of the log likelihood expression, which can indeed be derived:
1
dL
-dx
X-2a,+- [ a 1 ( l - 2 2 ) +a2(2-22s) + a 3 ( 3 - 2 x )
f...
--
1
+
a n ( n - 2 ~ > ] = -2a0+
-
[a,+
h2
+
. . .
nan]-
[Za,+
2aZ+
.
.
.2an],X
1
= -2(ao
+
a,+
. .
.G)
+
-
[al+
2a2+
.
.
.nun] = 0.
Thus,
1 a, +ea,
+
. . .
m,,-
1 BRiai 2 a,+a,+...
an 2 Xai *x=-
---Using 2x = 1.03344, the expected distribution of tetrad ranks can be calculated from (3). The fourth column of Table 1 shows that there are far too many observed tetrads of rank 1, and too few of ranks 0, 2, 3, 4 and higher. Since the probability of the observed distribution being due to chance is less than 0.001,
the data indicate strong chiasma interference.
Two-point crosses, interference estimated
236
If the probability of nonexchange tetrads is not changed by interference, then the sum of probabilities of ranks greater than zero must still equal l-p(0) even with interference. This will be the case if each term greater than zero is multi- plied by
k"'
and also by a factor S, which is the sum of terms of rank greater than zero without interference divided by the sum of terms of rank greater than zero with interference. This ratio is:In a manner analogous to the case with no interference, the expectations for the three tetrad types can be expressed as:
* ( 2 2 ) - 2 2 Sk r-1 CP(pD)]
P(PD)
= p ( O )+
2 ---er!
T=2
P(NPD)
= 2 ----czz (22)' Sk lr-l [ p(NPD)
]r!
r = z
These expressions reduce to:
1 6
(1 - e?") (e2k2
+
2e+"-
3 )e z k x - 1
P(PD)
= m l = c z z+
-
___1 6
(1
-
c2") (ezko+
2ek"
-
3)- _ _ _ ~
1
(?2kX
-
P(NPD) = m z =
- 2 (1
-
e-2x) (e--"") (eakz-
11
1ezkx -
3
P(T)
= m3 = 7which are the expcctations used for estimation.
There are now two ways to proceed. One way is to make use of the fact that when the number of parameters to be estimated is the same as the number of
degrees of freedom, then the equations for estimation can be obtained by setting the expectations equal to the observations (BAILEY 1951). In this case we have:
ml = a l / N m2 = az/N
m3 = a3/N
where N is the total number of tetrads. Simultaneous solution of any two of these three equations for x and
k
will give the maximum likelihood estimates.LINKAGE AND INTERFERENCE F R O M TETRAD DATA 23 7
eters which make the partial derivatives simultaneously equal to zero. Thus we have:
2 c k X
-
5eZkx+
3ezkx
-
1---
ax
m, 3I)
1
mz
3e 2 k x
+
2e4” - 3 1+a,
- { k a ; O + c Z 2 [
ezkx-a3 2
ek2
(e3k2-
1 )ezkx - 1
+
-
-
{
-ka/3+
2e-22[
m3
3 (9)where
e-kx (1
-
cZx) 2e3kx-
3eZkx+
1 eZh-
1
,
andp =
e2kx-
1
Iterative solution of these simultaneous equations can be accomplished as described by MATHER (1957), using efficient corrections after each round. Stan- dard errors can be obtained from the inverse of the information matrix, using values obtained in the last round of iteration.
Because of the nature of tetrad data and the conditions of the interference model, the estimate of
x
obtained by (9) and (IO) is equal to -(1/2)lnp(O)(i.e., p ( 0 ) =
eZ”),
where p ( 0 ) is the proportion of tetrads with no exchanges, that is, PD- NPD/N. For example, a Saccharomyces cross involving the markers mat1 and his4 on chromosome 3 (see Table 2) produced 97 PD, 7 NPD, and 174T.
The maximum likelihood estimate ofx
with interference is 0.56390, which is -(1/2)1n(90/278). ( k for this data is 0.29483, whilex
estimated without interference is 0.58340. x calculated from thePERKINS
(1949) formula is 0.38843.) This simple relation can be used instead of (9) and (IO) to calculatex.
The relation
x
= -(1/2)ln p ( 0 ) is essentially the formula derived by SHULT and LINDEGREN (1956) for calculating map distances in units they calledstranes.” In their notation, the right side of the expression was multiplied by 100 to convert “stranes” into units comparable to centimorgans, e.g., stranes
(D)
= -50 In (a,-a,/N).The expected proportion of NPD’s as a function of T’s in two-point crosses without interference was derived by
PAPAZIAN
(1952) :L L
r 3T V 3
NPD = (1/2)
-
1-T-
(1-
T)
]
.
If interference is operative, the proportion of NPDs in the sample will decrease, so that with complete interference there will be no NPDs whatsoever. An esti- mate of interference might be derived as the ratio of the observed proportion of
while with complete interference it will be 0. It turns out that the interference values estimated by equations (9) and (10) are almost the same as the NPD ratios. For the matl-his4 data, k is 0.29482, while the NPD ratio is 0.23007. The regression of the NPD ratios against k for 28 Saccharomyces crosses and 30 Schizosaccharomyces crosses gave a coefficient of 1.0657, with 95
%
confidence limits of 1.0539 to 1.0784. Thus, the k values f o r two-point crosses obtained by the maximum likelihood equations are essentially measures of the discrepancy of the observed proportion of NPDs compared to the proportion expected on thePAPAZIAN (1952) formula. It is probable that the regression is not exactly one because of the finite sample sizes.
For two-point crosses, interference will increase the proportion of T tetrads at the expense of NPDs. Since nonexchange tetrads contain no information about interference, the information about k comes from the
T
and NPD tetrads. When there are no NPD's, k cannot be estimated by (9) and (10) because of the divi- sion by zero that occurs.Ranked data, interference estimated
As in the case of ranked data without interference, we consider only five terms of the Poisson series. The probability of nonexchange tetrads is again based on the premise that the p ( 0 ) term is not changed by interference. Terms above p ( 0 )
are multiplied by Sk"l. Thus, in a manner analogous to no interference, the expectations can be written as:
p ( 0 ) = mo = e-2x
2
e2kx
-
1[
1 + k x + - k 2 x 2 ] 3.
2kx (1-
e-2x)p ( 4 . .
.
r ) = m4 = 1 - &x-Differentiating the log likelihood expression with respect to x and k , and equating the partial derivatives to zero gives the likelihood equations of estimation:
aL
ax
ml enkx-
1LINKAGE AND INTERFERENCE F R O M TETRAD DATA
1
[ 2 7 k x - % ~ k x + 2 ] a3 4
eZkX- m3 3
e k e z h
-
3eZk*+
31)
-
- 4 2 x 3 (1 -E-"")[
___ -(eeka:
-
239
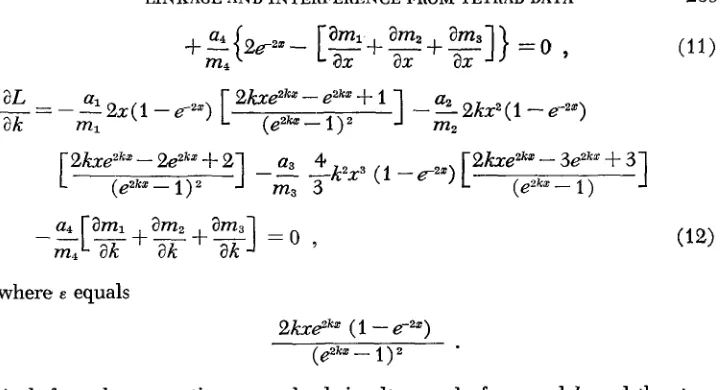
(11)
where E equals
2 k ~ 2 ~ " (1
-
e-,")( 8 8
-
1I Z
As before, these equations are solved simultaneously for x and
k,
and the stan- dard errors are obtained from the calculations used in solution.With interference, the probability of tetrads of ranks greater than zero is:
This relation can be used to calculate the rank distribution after an estimate has been obtained for
x
andk.
For the data in Table 1, solution of the above two partial derivatives yielded x = 0.92622 +- 0.02515 andk
= 0.22785 * 0.02160.The expected distribution of ranks using these estimates is given in column 5 of
the table, the number of rank 0 tetrads being set at 333.00. Although the cal- culated distribution fits the observations better, there is a deficiency in rank 3
and an excess in rank 2, so that
x2,
with 3 degrees of freedom, is highly signifi- cant ( p<
0.001). This suggests that an improved interference model might be derived by multiplying terms above p ( 0 ) by some factor other than for instance, by k@-l.As in the case of two-point crosses with an estimate of interference, the values of x obtained from the equations for ranked data with interference are equal to
-
(1/2)ln p ( 0 ) because of the assumptions of the model.Estimation of linkage parameters for tetrad data for Saccharomyces and Schizosaccharom yces
Table 2 contains estimates of map distance with and without interference for some of the extensive two-point data of Saccharomyces for which at least 100
TABLE 2
Estimates of map distance and interference for selected two-point crosses of Saccharomyces
x
+
s.e. x ( i )+
s.e. k+
s.e. Reference Chromosome Gene pair X(P)2 3 4 5 6 7 8 9 10 11 15 17 cyhl-gall* gall-lys2 lys2-tyrl tyrl-his7 SUP45-lys2 SUP45-tyrl his4-natP his4-leu2 leu2-matlC matl-thr4 thr4-MAL2 SUP35-arol trpl-cdcZ* aspl-trp4 hisl-trp2 ura3-hom3 *
SUPII-his2 trp5-ade6* ade5,7-tyr3 tyr3-lys5 cyh2-trp5 leul-ade6* MALI-ade3 petl-CUP1 thrl-CUPl CUPI-pet3 his6--2ysI* SUP4-SUP7* metl4-met1 metl-MAL4 serl-ade2 ade2-cyh4 petl7-ade2 mt2-pha2 pet2-pha2 0.198 0.518 0.352 0.425 0.259 0.185 0.388 0.175 0.345 0.214 0.295 0.208 0.460 0.180 0.248 0.347 0.219 0.632 0.638 0.086 0.440 0.339 0.474 0.466 0.243 0.358 0:435 0.522 0.440 0.289 0.273 0.326 0.469 0.373 0.473 0.232 0.828 0.516 0.751 0.331 0.174 0.583 0.199 0.453 0.249 0.389 0.239 0.878 0.209 0.311 0.555 0.258 0.820 1.031 0.080 0.745 0.479 0.707 0.794 0.323 0.543 0.628 0.834 0.610 0.337 0.384 0.4% 0.7M 0.518 0.681 0.034 0.079 0.045 0.1 19 0.053 0.033 0.057 0.016 0.033 0.020 0.037 0.041 0.171 0.026 0.035 0.063 0.043 0.040 0.1 78 0.016 0.104 0.034 0.104 0.095 0.0% 0.057 0.051 0.039 0.096 0.047 0.042 0.OM 0.090 0.069 0.094 0.230 0.795 0.500 0.705 0.327 0.174 0.563 0.198 0.446 0.248 0.382 0.237 0.809 0.208 0.308 0.532 0.256 0.833 1.010 0.080 0.705 0.467 0.685 0.747 0.318 0.524 0.61 1 0.801 0.597 0.335 0.375 0.419 0.728 0.506 0.664 0.033 0.042 0.034 0.063 0.048 0.035 0.039 0.016 0.027 0.020 0.032 0.041 0.075 0.026 0.032 0.043 0.042 0.095 0.084 0.017 0.058 0.026 0.065 0.049 0.021 0.04.0 0.035 0.063 0.068 0.045 0.036 0.037 0.050 0.053 0.062 0.337 0.488 0.245 0.194 0.258 1.817 0.294 0.370 0.429 0.4Q4 0.294 0.468 0.204 0.284 0.277 0.115 0.386 1.333 0.7M 2.355 0.265 0.271 0.495 0.271 0.1 12 0.210 o.ffi1 0.498 0.545 0.633 0.098 0.397 0.367 0.386 0.551 0.341 0.108 0.101 0.111 0.260 1 . a 6 0.112 0.21 6 0.127 0.205 0 . 1 4 0.477 0.116 0.287 0.198 0.082 0.392 0.698 0.241 2.464 0.119 0.091 0.197 0.096 0.079 0.105 0.116 0.159 0.258 0.380 0.098 0.181 0.1 19 0.198 0.208 b b b b C C a b b b b C d d a b b a b b b b b a b b b C d d b b d d d
z ( P ) = map distance calculated from formula of PERKINS (1949); z
+
s.e. = map distanceand standard error estimated from maximum likelihood equation (7); z ( i ) , k = map distance
and interference estimated from equations (9) and (10). Map distances are given in Morgans.
Intervals spanning a centromere are indicated with an asterisk. In certain cases changes have
been made in gene nomenclature to conform to more recent usage.
References: (a) HAWTHORNE and MORTIMER 1960; (b) MORTIMER and HAWTHORNE 1966;
LINKAGE A N D INTERFERENCE FROM TETRAD DATA 24 1
Several points emerge from a review of the data in Table 2. First, the
PERKINS
(1949) formula considerably underestimates the map distance for large genetic intervals because a considerable amount of triple and higher order crossing over is not taken into account. Second, the estimates forz ( i )
are somewhat smaller than those for z, in keeping with expectations of the interference model. Third, except for three cases wherek
exceeds one, the other estimates of this factor are usually less than 0.5. The averagek
for all 35 crosses is 0.482; if the three excep- tional crosses are omitted, the average is 0.355. This is similar to values ofk
that have been obtained by plotting(R.
K. MORTIMER, personal communication). Fourth, the regression ofk
onz ( i )
for this data is -0.3757; however, this is not significantly different from zero. Therefore there is no tendency fork
to varyin
a consistent manner with length of the genetic interval under consideration. Fifth, the standard errors of the estimates ofk
are quite large. This is due to the fact that theNPD
tetrads contribute the most information to his estimate, but there are usually relatively few of them.The only region of the genome where it seems possible that
k
values consis- tently different from the average may occur is in the left arm and the proximal part of the right arm of chromosome 7. The crosses trp5-ade6, ade5,7-tyr3, andtyr3-Zys5 have
k
values considerably higher than average, and higher values also occurred in several other crosses for which fewer than 100 tetrads were analyzed. However, not all crosses in this region have highk
values, for example, Zys5- cyh2, cyh2-trp5, and leul-ade6. The reduced interference in this region may be real and a more detailed investigation may well prove rewarding.There is no conspicuous tendency for intervals spanning a centromere to show higher
k
values than those which do not. The averagek
for the nine crosses of this type in Table 2 is 0.438. If the trp5-ade6 cross with the exceptionally highk
of 1.333 is omitted, the average
k
is 0.326.Ranked tetrad data are much rarer than two-point data. Through the kindness of
R.
K.
MORTIMER and SEYMOURFOGEL,
1 was fortunate to obtain access to the immense amount of ranked data from their gene conversion studies (Table 3 ) .The crosses usually involve well over 100 tetrads, often several thousand. The pooled data from chromosome 6 , for instance, are based on 1,076 tetrads, those for chromosome 8 on 14,907.
The map distance f o r the centromere-CUP1 interval on the right arm of chromosome 8 is very uniform, except for diploid 5313 (where it is much higher), and diploids 5420,5420-1,5420-1-1, and 5475 (where it is lower)
.
Thek
values for these crosses also vary from the norm in the same direction. The higher zvalue for 5313 results because rank 2 and 3 tetrads are relatively more frequent than in other crosses, while the lower z values for the other diploids are due to a smaller than usual proportion of rank 2 tetrads. Though different from the rest, the data for the 5420 diploids are quite homogeneous. 5420 is heterozygous
242
TABLE 3
Estimates of map distance and inferfersence from ranked data of Saccharomyces (data from MORTIMER and FOGEL, personal communication)
Chromosome Diploid I
+
s.e. z ( i )+
s.e. k+
s.e.6 4335
4338 4339 4350 4351 4352 Pooled
8 M141
M150 3653 5246 5275 5276 5276+ 5276-3 5308 5310 5313 5420 5420-1 5420-1-1 5475 5497 Pooled' 0.306 0.302 0.331 0.363 0.326 0.286 0.318 0.546 0.543 0.509 0.504 0.533 0.51 1
0.515 0.520 0.561 0.51 7 0.847 0.450 0.426 0.453 0.282 0.508 0.523 0.029 0.028 0.030 0.032 0.031 0.027 0.021 0.014 0.013 0.013 0.012 0.015 0.013 0.015 0.01 5 0.015 0.018 0.023 0.016 0.014 0.021 0.01 1 0.009 0.004 0.427 0.390 0.467 0.531 0.479 0.394 0.443 1.078 0.993 0.904 0.916 0.979 0.929 0.928 0.942 1.002 0.941 1.354 0.790 0.699 0.76 1 0.389 0.862 0.941
0.043 0.154 0.039 0.285 0.046 0.188 0.053 0.198 0.049 0.1 19 0.040 0.122 0.018 0.180 0.038 0.204 0.031 0.242 0.031 0.226 0.028 0.205 0.037 0.229 0.032 0.214 0.034 0.223 0.035 0.224 0.036 0.273 0.042 0.21 9 0.066 0.494 0.034 0.164
0.027 0.181 0.043 0.198 0.016 0.108 0.021 0.256 0.009 0.232
0.059 0.086 0.061 0.059 0.049 0.055 0.025 0.013 0.014 0.01 6 0.013 0.017 0.015 0.017 0.01 7 0.018 0.020 0.030 0.018 0.019 0.027 0.021 0.012 0.004 ~~~~~~~ ~~
* Diploids 5313,5420-1, 5420-1-1, and 5475 omitted.
The intervals marked for chromosome 6 were centromere-his2-SUP6-meiZO; for chromosome 8, centnnnere-urg4-thrl-CUPl, except f o r crosses 542Q, 5420-1,5420-1-1, and 5497, which were centromere-petl-arg4-thri-CUPi. z
+
s e . = map distance and standard error estimated from equation (8) ; z ( i )+
s.e. and k+
s.e. = map distance and interference with standard errors estimated from equations (1 1) and (12), respectively.The data for the centromere-net10 interval on the right arm of chromosome
6
are also quite homogeneous, and the
k
values are about the same as those for chromosome 8.Table
4
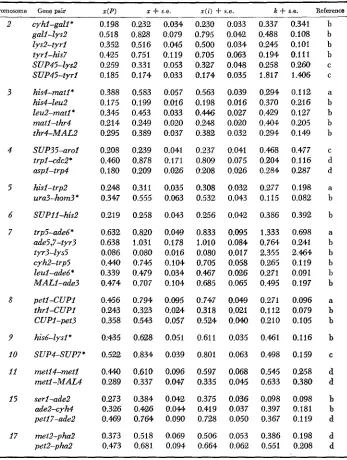
contains a selection from the extensive two-point data published byL I N K A G E A N D I N T E R F E R E N C E F R O M TETRAD DATA
TABLE 4
Esiimates of map distance and interference for selected two-point crosses of Schizosaccharomyces pombe (data from KOHLI et. al. 1977)
243
Chromosome Gene pair .dP) I
+
s.e. x ( i )+
s.e. k+
s.e.1 cyhl-cdcl cdci-leu2 hid-leu2 sup3-aro3 ura2-ade2 ade2-de4 lys3-ural ural-lys5 prol-ade3 ade3-pro2
2 ade7-ura5 ade7-his3 glul-his3 his3-matl* ts124-mat1 leul-his5 his5-leu3 adel -his4 his4-trpi ade8-arg4
3 adel0-furl adel O-aded *
f url-sin2 *
furl-min5+ aded-min5 tsl5-argl argl-ade5 argl-aro4 trp3-aro4 ade5-wee1 0.521 0.500 0.142 0.602 0.321 0.703 0.210 0.328 0.435 0.651 0.121 0.554 0.518 0.676 0.677 0.264 0.495 0.395 0.710 0.286 0.161 0.294 0.237 0.221 0.054 0.319 0.537 0.552 0.194 0.522
0.803 0.124 0.688 0.105 0.114 0.025
0.751 0.101 0.358 0.030 1.220 0.194 0.199 0.004 0.394 0.054 0.495 0.018 0.968 0.083
0.134 0.004 0.694 0.059 0.668 0.077 1.127 0.034 0.961 0.094 0.282 0.024 0.620 0.102 0.424 0.030 1.090 0.227 0.313 0.038
0.175 0.009 0.317 0.036 0.254 0.030 0.224 0.028
0.OM 0.008 0.431 0.063 0.84Q 0.042 0.563 0.110 0.196 0.032 0.690 0.143
0.777 0.070 0.677 0.071 0.115 0.028 0.762 0.070 0.357 0.028
1.205 0.078 0.199 0.014 0.328 0.W
0.497 0.068 0.967 0.044.
0.134 0.012 0.698 0.043 0.665 0.055 1.110 0.044 0.976 0.051 0.282 0.024 0.618 0.077
0.497 0.109 1.106 0.108 0.312 0.037
0.175 0.029 0.317 0.036 0.253 0.030 0.224 0.029 0.044 0.009 0.423 0.052 0.827 0.071 0.580 0.092 0.196 0.033 0.685 0.100
0.545 0.196 0.698 0.277 4.691 4.101 1.350 0.538 0.888 0.277 0.869 0.234 1.771 0.491 0.716 0.379 1.087 0.530 0.985 0.185
0.229 0.230 1.117 0.259 0.911 0.277 0.837 0.133 1.261 0.338 0.951 0.337 0.921 0.417 1.249 0.238 1.227 0.674 0.894 0.426
0.581 0.591 0.974 0.429 0.892 0.469 1.177 0.628 7.693 6.074 0.302 0.216 0.645 0.212 2.523 2.655
1.151 0.868 0.850 0.454
Symbols same as inTable 1
As with S. cereuisiae, there is no strong tendency for intervals spanning a
centromere to show higher
k
values than others. A total of 12 such intervals are available in the published literature (four of them are indicated in Table4).
The averagek
is 1.110.crossovers, or whether the level of recombination differs. This can be approached by calculating the map units per microgram of DNA. Taking the amount of
DNA
per haploid spore for Saccharomyces and Schizosaccharomyces as 2.1 X 1O-'
and 1.46
x
1Ck8 pg, respectively (HARTWELL 1970; BOSTOCK 1970), and the total map units as 3700 and 1300 (FOGEL and MORTIMER 1971; KOHLI et al. 1977), one finds about 1.76x
compared to 0.89 x 10l1 map units per pg DNA for the two organisms. I n view of the fact that the S. pombe map will certainly be lengthened by future work, perhaps even doubled, it does not seem likely that the total amount of recombination is considerably different in the two.MORTIMER and
FOGEL
(1974) found that in Saccharomyces gene convertants recombined for their flanking markers showed interference in adjacent intervals, but those convertants that retained the parental outside marker combinations did not. They also found that half the conversion events were associated with adja- cent marker recombination. Sincek
values greater than one are a sign of negative interference, parallel gene conversion studies with S. pombe should be very profitable.It is a pleasure to acknowledge the most helpful discussions I have had with SUBODH JAIN, who derived the explicit solution for equation (8), and with MICHAEL TURELLI. Thanks are also due R. K. MORTIMER and SEYMOUR FOGEL f o r the use of their ranked tetrad data and to DAVID PERKINS and JULIAN ADAMS for their comments on the manuscript. This work was supported by funds assigned to California Agricultural Experiment Station Project CA-D*-GEN-3161-H.
LITERATURE CITED
BAILEY, N. T. J., 1951 Testing the solubility of maximum likelihood equations in the routine application of scoring methods. Biometrics 7: 268-274.
BARRATT, R. W.,
D.
NEWMEYER, D. D. PERKINS and L. GARNJOBST, 1954 Map construction in Neurospora crassa. Advan. Genet. 6 : 1-93.BOSTOCK, C. J., 1970 DNA synthesis in the fission yeast Schizosaccharomyces pombe. Exp. Cell Res. 60: 12-26.
FOGEL, S. and R. K. MORTIMER, 1971
HALDANE, J. B. S., 1931
HARTWELL, L. H., 1970
HAWTHORNE, D. C. and R. K. MORTIMER, 1960 Chromosome mapping in Saccharomyces: Centromere-linked genes. Genetics 45: 1085-1 110. -- , 1968 Genetic mapping of non- sense suppressors in yeast. Genetics 60: 735-742.
Genetic mapping in Schizosaccharomyces pombe by mitotic and meiotic analysis and induced haploidization. Genetics 87: 471-489.
KUENEN, R., 1962 Ein modell zur analyse der crossover-interferenz. Zeit. Vererbungs. 93:
35-65.
MATHER, K., 1935 Reduction and equational separation of the chromosomes in bivalents and multivalents. J. Genet. 30: 53-78.
-
,
1957 The Measurement of Linkage in Hered- ity, second edition. Methuen and Co., London.The calculation and precision of linkage values from tetrad analysis. J. Genet. 43 : 1-30.
Recombination i n yeast Ann. Rev. Genet. 5: 219-236.
The cytological basis of genetical interference. Cytologia 3: 54-65.
Biochemical genetics of yeast. Ann. Rev. Genet. 4: 373-396.
KOHLI, J., H. HOTTINGER, P. MUNZ, A. STRAUSS and P. THURIAUX, 1977
L I N K A G E A N D I N T E R F E R E N C E F R O M TETRAD DATA 245
MORTIMER, R. K. and S. FOGEL, 1974 Genetical interference and gene conversion. pp. 263-275. In: Mechanisms in Recombination. Edited by R. F. GRELL. Plenum Press, New York. MORTIMER, R. K. and D. C. HAWTHORNE, 1966 Genetic mapping in Saccharomyces. Genetics
53: 165-173. -, 1973 Genetic mapping i n Saccharomyces. IV. Mapping of tem- perature sensitive genes and use of disomic strains i n localizing genes. Genetics 74: 33-54. PAPAZIAN, H. P., 1952
PERKINS, D. D., 1949
SHULT, E. E. and C. C. LINDEGREN, 1956
The analysis of tetrad data. Genetics 37: 175-188.
Biochemical mutants in the smut fungus Ustilago maydis. Genetics 34:
A general theory of crossing-over. J. Genet. 54:
Corresponding editor: F. SHERMAN 607-626.