Copyright 0 1984 by the Genetics Society of America
TEMPERATURE-SENSITIVE LETHAL M U T A T I O N S O N
YEAST CHROMOSOME I APPEAR
TO DEFINE ONLY A
SMALL NUMBER O F GENES
DAVID B. KABACK,*.' PAUL W. OELLER? H. YDE STEENSMA,**' JANET HIRSCHMAN,* DIANE RUEZINSKY,* KEVIN G. COLEMANT and
JOHN R. PRINGLEt
*Department of Microbiology, University of Medicine and Dentistry of New Jersey,
New
Jersey Medical School, Newark, New Jersey 07103, and ?Departmentof
Cellular and Molecular Biology, Divisionof
Biological Sciences, The University of Michigan, Ann Arbor, Michigan 4 8 1 0 9
Manuscript received August 3 1 , 1983 Revised copy accepted April 27, 1984
ABSTRACT
A method was developed for isolating large numbers of mutations on chro- mosome I of the yeast Saccharomyces cereuisiae. A strain monosomic for chro- mosome I (i.e., haploid for chromosome I and diploid for all other chromo- somes) was mutagenized with either ethyl methanesulfonate or N-methy1-N'-
nitro-N-nitrosoguanidine and screened for temperature-sensitive (Ts-) mutants capable of growth on rich, glucose-containing medium at 25" but not at 37". Recessive mutations induced on chromosome I are expressed, whereas those on the diploid chromosomes are usually not expressed because of the presence of wild-type alleles on the homologous chromosomes. Dominant ts mutations on all chromosomes should also be expressed, but these appeared rarely.
-
Of the 41 ts mutations analyzed, 32 mapped on chromosome I. These 32 mutations fell into only three complementation groups, which proved to be the previously described genes CDC15, CDC24 and P Y K l (or CDC19). We recovered 16 or 17 independent mutations in CDC15, 12 independent muta- tions in CDC24 and three independent mutations in PYKI. A fourth gene on chromosome I, MAK16, is known to be capable of giving rise to a ts-lethal allele, but we recovered no mutations in this gene. The remaining nine mu- tations isolated using the monosomic strain appeared not to map on chromo- some I and were apparently expressed in the original mutants because they had become homozygous or hemizygous by mitotic recombination or chro- mosome 105s.-
The available information about the size of chromosome Isuggests that it should contain approximately 60-100 genes. However, our isolation in the monosomic strain of multiple, independent alleles of just three genes suggests that only a small proportion of the genes on chromosome I is easily mutable to give a Ts--lethal phenotype.
-
During these studies, we located CDC24 on chromosome I and determined that it is centromere distal to PYKl on the left arm of the chromosome.TUDIES of the amounts of
DNA
and of the numbers
of genes in various
S
eukaryotic cells have led to two related, but distinct, paradoxes. T h e first
'
To whom correspondence should be addressed.of these, the well-known
“C
value paradox”
(CAVALIER-SMITH
1978, 1980;
GALL
1981;
PRESCOTT
1983), refers to the wide variations in
C
value (DNA
content per haploid genome) among related organisms, to the frequent lack
of any detectable correlation between the
C
values and the apparent pheno-
typic complexities of the organisms and to the general gross discrepancy be-
tween the
C
values observed and those required to account for the numbers
of
RNA
and protein species estimated (by either genetic or molecular meth-
ods-see
following data) to be encoded by the genomes. T h e second paradox,
which is our concern in this paper, can be called the “gene number paradox.”
I t has arisen in the course of attempts to answer the following questions: How
many genes are there altogether in various eukaryotic genomes? How many of
these genes encode functions essential for the survival and reproduction of
individual cells of the organism in question?
How
many of these genes encode
functions essential for cell differentiation, development or other functions at
the level of the whole organism (in multicellular organisms)? T h e paradox is
that the answers to these questions suggested by formal genetic (mutational)
analyses are fourfold to tenfold lower than the answers suggested by molecular
analyses.
T h e gene number paradox can be illustrated by data from a variety of
sources. For example, many elegant genetic studies in Drosophila have sug-
gested that this organism contains a total of about 5000 genes, or about one
gene per band of the polytene chromosomes
(
JUDD, SHEN
and
KAUFMAN
1972;
LEFEVRE
1974, 1981;
SPRADLINC
and
RUBIN
1981;
RIPOLL
and
GARCIA-BEL-
LIDO
1979;
GAUSZ
et
al.
1981;
NICKLAS
and
CLINE
1983), that most of these
genes are essential for survival of the organism as a whole
(LEFEVRE
1974,
1981;
RIPOLL
and
GARCIA-BELLIDO
1979), but that only about 10-12% of
these essential genes (or about
500-600
genes) are essential for the survival
and reproduction of individual somatic cells
(RIPOLL
1977;
RIPOLL
and
GAR-
CIA-BELLIDO
1979). Similarly, genetic studies in Caenorhabditis suggest a total
of
2000-4000 essential genes in this nematode
(BRENNER
1974;
ROGALSKI,
MOERMAN
and
BAILLIE
1982), and genetic analyses of development in Dic-
tyostelium suggest that only about 300 genes are essential specifically for de-
velopment in this slime mold
(LOOMIS
1978). In addition, recent attempts to
identify new CDC genes (genes whose products function in specific steps of the
cell cycle) in Saccharomyces using temperature-sensitive-lethal (ts-lethal) muta-
tions have yielded primarily mutants carrying alleles of already-known genes
(PRINCLE
1981;
PRINCLE
and
HARTWELL
1981); at first glance, this suggests
that the 50 known
CDC
genes may be a majority of the total. These various
genetic estimates give the impression that eukaryotic cells and organisms, and
their constituent processes, are relatively simple in terms of the numbers of
gene products involved.
In contrast, a very different impression is given by a variety of molecular
studies at both the protein and nucleic acid levels. For example, surprisingly
large numbers of polypeptides have been reported in such seemingly simple
structures
as
the flagellar axoneme of Chlamydomonas (2280 polypeptides:
MUTATIONS ON YEAST CHROMOSOME Z
69
nication) and the silk moth eggshell (2186 polypeptides: REGIER,
MAZUR
and
KAFATOS
1980). It is difficult to reconcile these numbers with the notion that
only 500-600 gene products are necessary altogether for the survival and
reproduction of a eukaryotic cell or that only 50-60 gene products are nec-
essary for all of the specific steps of the cell cycle. Indeed, vegetatively growing
yeast and Dictyostelium amoebas both appear to contain about 4000-5000
distinct mRNA species (HEREFORD
and ROSBASH
1977; KABACK,
ANCERER
and
DAVIDSON
1979; MANCIAROTTI et
al.
1983); the macronuclear genome of the
ciliate Oxytricha, which presumably contains only genes essential for vegetative
growth, appears to contain about 24,000 distinct genes (PRESCOTT
1983); and
a variety of arguments suggests strongly that the known yeast CDC genes are
but a minority of the total (PRINGLE
1981). Moreover, an additional 2000-
3000 mRNA species have been reported to appear during Dictyostelium de-
velopment
(MANGIAROTTI
et
al.
1983), in striking contrast to the genetic data
cited earlier. T h e numbers of distinct sequences apparently utilized by the
unicellular yeast, slime mold and ciliate are themselves difficult to reconcile
with the genetic estimates of the total numbers of genes in the metazoans
Drosophila and Caenorhabditis (see preceding data). Thus, it is not surprising
to find that sea urchins appear to express at least 35,000 distinct mRNA species
in the course of development (GALAU
et
al.
1976; LEE
et
al.
1980; DAVIDSON,
HOUGH-EVANS
and BRITTEN 1982), whereas adult mouse brain appears to
express some 150,000 different mRNA species (VAN NESS,
MAXWELL
and
HAHN 1979; OUELLETTE
1980). Indeed, recent studies of mRNA sequence
complexity in Drosophila itself have apparently detected
217,000 distinct
mRNA species (LEVY
and MANNING
198l), whereas the spacing of transcribed
regions in a variety of cloned Drosophila chromosome segments is much closer
than that expected from a hypothesis of one gene per polytene-chromosome
band (SPRADLING
and RUBIN 1981; ISH-HOROWICZ
et
al.
1979; SIROTKIN
and
DAVIDSON
1982; GRIFFIN-SHEA,
THIREOS
and KAFATOS 1982; SINA and PEL-
LEGRINI
1982; STORTI and SZWAST
1982; SNYDER
and DAVIDSON
1983).
As resolution of the gene number paradox would have both philosophical
significance and practical implications for research strategies, we have ap-
proached this paradox directly by a combined mutational and molecular anal-
ysis of chromosome
I
of
the yeast
S. cerevisiae.
These studies are facilitated by
the small size of this chromosome. It contains only about 100 cM of recom-
bination distance between its two most distal known markers
(MORTIMER
and
SCHILD 1980, 1982); this is about
l/50of
the total known recombination dis-
tance for the yeast genome. In addition, chromosome I appears to contain only
about 200
f
50 kilobase pairs (kbp) of DNA (D. SCHWARTZ,
C.
CANTOR,
Y.
STEENSMA
and D. KABACK, unpublished results); this is about
l/70of the total
lethal mutations are recessive, most Ts--lethal mutants isolated in this strain
carry mutations on chromosome
I .
Genetic analysis of
32
independently iso-
lated mutations revealed that they fell into only three genes. This number
is
much smaller than that expected given the size
of
the chromosome, the typical
spacing of one transcribed region per
2-3
kb observed in yeast
(HEREFORD
and
ROSBASH
1977;
LAUER,ROBERTS
and
KLOTZ 1977;
KABACK,ANGERER
and
DAVIDSON
1979; HEREFORD
et
al.
1979;
SHALIT et
al.
1981;
ST.
JOHNand
DAVIS
1981;
SHERMAN
et
al.
1983)
and the common assumptions that most
genes are essential and that most can be identified by
tsmutations
(EDGAR,DENHARDT
and
EPSTEIN 1964; HARTWELL
1967; PRINGLE
1975).
Extrapolation
to the whole genome would suggest that only some
250
genes were essential
for vegetative growth in yeast.
As
this conclusion is almost certainly wrong (see
DISCUSSION),
the results appear to provide another vivid example of the gene
number paradox but in a relatively simple and tractable system that should
allow clarification of the reason(s) for the paradox (see
DISCUSSION).MATERIALS AND METHODS
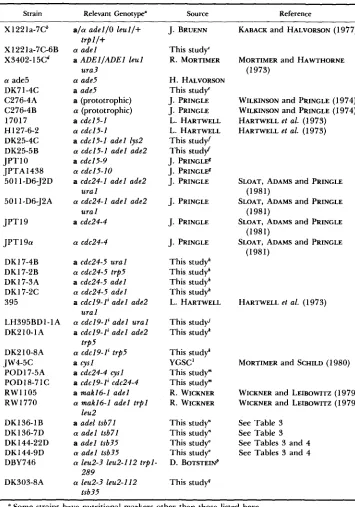
Strains, media and growth conditions: The principal strains used as parents and/or testers in this study are listed in Table 1. All other strains used were derived from these using either standard procedures (SHERMAN, FINK and HICKS 1982) or the procedures described explicitly in this section. Cells were grown routinely on YEPD liquid (per liter: 10 g of Difco yeast extract
+
20 g of Difco Bacto peptone+
20 g of glucose) or solid (20 g/liter agar added) medium. Selective media for analysis of auxotrophic markers were as described elsewhere (SHERMAN, FINK and HICKS 1982). Liquid cultures were incubated in flasks with vigorous rotary shaking or in test tubes in a roller drum. Permissive and restrictive growth temperatures for Ts- mutants were 24-25" and 36-37", respectively. Some Ts' cultures were grown at 30" to achieve more rapid growth rates.Mutagenesis and isolation of mutants: Mutants were isolated in strain X1221a-7C, a strain that appears to be monosomic for chromosome I ( i . e . , haploid for chromosome I and diploid for all other chromosomes: see BRUENN and MORTIMER 1970: KABACK and HALVORSON 1977). For mu- tagenesis with ethyl methanesulfonate (EMS), cells from a 3-day-old stationary-phase culture in YEPD were washed and resuspended in sodium phosphate-glucose buffer (0.2 M phosphate, 0.11 M glucose, pH S), then treated with 3% (v/v) EMS (Sigma) for 60 min at 25". After mutagenic activity was terminated by diluting the cells 50-fold into 6% sodium thiosulfate, the cells were centrifuged, resuspended in water and plated on YEPD medium at 25". Temperature-sensitive clones were detected by replica plating to YEPD plates at 37", rechecked by streaking on YEPD at 25" and 37" and given tsb isolation numbers. The EMS treatment produced no detectable loss of viability in the monosomic strain. Because nonproliferating cells were mutagenized and plated with no intervening period of growth, all of the tsb mutations must be independent in origin.
MUTATIONS ON YEAST CHROMOSOME 1
TABLE 1
S. cerevisiae strains used in this study
71
Strain Relevant Genotype" Source Reference
X 1221a-7C-6B X3402-1 5Cd
a ade5 DK71-4C C276-4A C276-4B 17017 H 127-6-2 DK25-4C DK25-5B JPTlO JPTA 1438 501 1-D6-J2D 501 1-D6-J2A
J P T I 9
J P T l 9 a
DKI 7-4B DKI 7-2B DKI7-3A DKl7-2C 395 LH395BD1-1 A DK2IO-1A DK210-8A JW4-5C POD1 7-5A POD 18-7 1 C RWI 105 RW1770
DKl36-1 B DKI 36-7D DK144-22D DK 144-9D DBY746
DK303-8A
a / a adel/O l e d / +
a adel
a ADEIIADEI leu1 u r a 3
a ade5
a ade5
a (prototrophic)
a (prototrophic) a cdcl5-1
a cdcl5-1 adel lys2 a cdcl5-1 adel ade2
a cdc15-9 a cdcl5-I0
a cdc24-I adel ade2 ura I
a cdc24-I adel ade2 u r a l
a cdc24-4 t r p l / +
cdcl5-1
cdc.24-4
a cdc24-5 u r a l a cdc24-5 trp5 a cdc24-5 adel a cdc24-5 adel a cdcl9-I' adel ade2
a cdcl9-I' adel u r a l
a cdcl9-I' adel ade2 trp5
a cdc19-I' trp5 a cysl
a cdc24-4 cy1
a cdcl9-I' cdc24-4 a makl6-1 adel a makl6-I adel t r p l
a adel tsb71 a adel tsb71
a adel tsb35 a adel tsb35
a leu2-3 l e d - 1 1 2 t r p l -
a leu2-3 l e d - I 1 2 u r a l
leu2
289
tsb35
J. BRUENN
This study" R. MORTIMER
H. HALVORSON This study' J. PRINGLE J. PRINCLE
L. HARTWELL L. HARTWELL This study' This studyf J. PRINCLEB J. PRINCLE~ J. PRINCLE J. PRINGLE J. PRINCLE J. PRINGLE This studyh This stud? This study* This study* L. HARTWELL
This study' This study' This stud? YGSC' This study"' This study"' R. WICKNER R. WICKNER
This study" This study" This study" This study' D. BOTSTEIN~
This study'
KABACK and HALVORSON (1 977)
MORTIMER and HAWTHORNE (1 973)
WILKINSON and PRINCLE ( I 974) WILKINSON and PRINGLE (1974) HARTWELL et al. (1973) HARTWELL et al. (1 973)
SLOAT, ADAMS and PRINGLE SLOAT, ADAMS and PRINGLE SLOAT, ADAMS and PRINGLE SLOAT, ADAMS and PRINCLE
(1981)
(1981)
(1981)
(1981)
HARTWELL et al. (1973)
MORTIMER and SCHILD (1 980)
WICKNER and LEIBOWITZ (1 979) WICKNER and LEIBOWITZ (1 979) See Table 3
See Table 3 See Tables 3 and 4 See Tables 3 and 4
a Some strains have nutritional markers other than those listed here.
This strain appears to be monosomic for chromosome I; i.e., haploid for this chromosome and diploid for all other chromosomes.
TABLE 1-Continued ~~ ~
This strain appears to be disomic for chromosome I; i.e., diploid for this chromosome and haploid for all other chromosomes.
a ade5 was crossed to Y 185-2 1 A, an a his2 or his8 segregant from Y 185 (TINGLE, KUENZI and HALVORSON 1974), and an a ade5 His+ segregant was named DK71-4C.
'Segregants from the cross of 17017 X DK8(Ade+)-GB; the latter strain is itself a segregant from DKS(Ade+) (KABACK, BHARGAVA and HALVORSON 1973).
gThese strains were isolated from C276-4A and C276-4B, respectively, and shown to carry cdcl5 mutations in a recent screening of EMS-induced Ts-lethal mutants (A. ADAMS and J. PRIN- GLE, unpublished results).
*
Segregants from strain DK17 (KABACK and HALVORSON 1978). Identification of the ts mutation in these strains as a CDC24 allele is described in RESULTS.'
Although it now appears that CDC19 should be known by the more informative name of PYKl (KAWASAKI 1979; PRINGLE and HARTWELL 1981; FRAENKEL 1982), this mutant allele is still re- ferred to by its original cdcl9 designation (HARTWELL et al. 1973).J A segregant from the cross of 395 X (2276-4B.
'These segregants from the cross of 395 X DK17-2B were shown to be cdcl9 CDC24 by complementation.
Yeast Genetics Stock Center, Berkeley, California 94720.
"POD17-5A is a segregant from the cross of JW4-5C X JPTl9a. POD18-71C is a CYSl segregant from the cross of PODl7-5A X LH395BD1-1A.
Segregants from the cross of the original haploid tsb71 isolate X DK71-4C.
Segregants from the cross of a ade5 X DKl39-8A; the latter strain is itself a segregant from DBY746 is a segregant from the same tetrad as DBY747 (BOTSTEIN et al. 1979).
A segregant from the cross of DK144-22D X DBY746. the cross of the original haploid tsb35 isolate X a ade5.
Genetic methods: Standard methods were used for complementation and linkage analyses (SHER- MAN, FINK and HICKS 1982). Complementation was usually tested by replicating MATa us. M A T a grids from 25" to 37" on YEPD medium
(6
Figure l), but in some cases the possibility of apparent noncomplementation because of poor mating was eliminated by testing the growth at 36"-37" of isolated diploid clones or of populations known to be diploid by virtue of the com- plementation of parental auxotrophic markers.Meiotic linkage analyses were complicated by the poor spore viability observed in some cases when the Ts- haploids derived from the monosomic mutants were used as parents in subsequent crosses. T o overcome this problem, the Ts- haploids were backcrossed one to three times against a ade5, DK7 1-4C, DKl7-4B or DKl7-2B (Table l), until a diploid giving good spore viability was obtained. Appropriate haploid segregants were then used in the analysis of meiotic linkage as described in RESULTS.
For "disome exclusion mapping" (or "trisomic analysis," MORTIMER and HAWTHORNE 1973), haploid segregants (obtained as just described) carrying the ts mutations of interest and adel were crossed to X3402-15C (Table I), a strain disomic for chromosome I ( i e . , diploid for chromosome I and haploid for all other chromosomes) and homozygous for A D E l . Analysis of tetrads from the resulting trisomic strains yields a mix of 4:0, 3:l and 2:2 (Ade+:Ade-) ratios for the segregation of ADEl and a corresponding mix of ratios for Ts+:Ts- if the mutation of interest is on chromo- some I. If the mutation of interest is on another chromosome, ratios of 2 Ts+:2 Ts- are usually observed.
Transformation of pykl (cdcl9) mutants was carried out with minor modifications of the pro- cedure described elsewhere (ITO et al. 1983), using treatment with 0.5 M LiCl and 10 pg of plasmid DNA. Plasmid YEpl3-PYKl (KAWASAKI and FRAENKEL 1982) was generously provided by G. KAWASAKI and D. FRAENKEL. Transformants were selected and analyzed as described in RESULTS.
RESULTS
Known essential genes
onchromosome
I: T h e gene
L E T l ,
which maps very near
MUTATIONS ON YEAST CHROMOSOME
r
73
FIGURE I .--Complementation behavior of strains carrying niutations on chromosome I . T h e strains used were as follows (see also Table I): cdc24-4. J P T I 9 andJPT19a; t s l l - 1 (i.e., cdc24-5). DKI7-4B and DK17-2R; cdcl9-I. 395 and LH395BDI-lh; fsb35, DK144-22D and DK144-9D; cdc15-9. JPTIO: cdcl5-IO, JPTh1438: fsb71, DK136-1 B and DK136-71). T h e grid was constructed by stamping from lawns using sawedqff tongue depressors. then incubated 2 days on
YEPD
at 24" before being replicated to YEP11 at 36.5". T h e photograph was taken after 2 days at 56.5".cessive-lethal allele
(MORTIMER
a n d
HAWTHORNE
1973); to the best of o u r
knowledge, n o ts-lethal allele of this gene has been isolated. T h e genes
CDCIS
(PRINGLI.:
and
HARTWELL
1981),
PYKI
(or
CDC19;
PRINGLE
and
HARTWELL
1981;
FRAENKEL
1982) and
M A K I 6
(WICKNER
and
LEIROWITZ
1979) also map
on chromosome
I
(MORTIMER
and
SCHILD
1980)
and give rise to
tsmutations
that a r e lethal o n
YEPD
medium. In addition, two indendently isolated
ts-lethal mutations in a fifth gene were isolated from strain X1221a-7C in a
preliminary phase of this study and mapped
to
the vicinity of
PYKI
on chro-
mosome
I (KARACK
and
HALVORSON 1978; MORTIMER
and
SCHrLD1980).
(These mutations were originally designated
tseand
tsh,
and subsequently
tsI I -
I
and
tsl
1-2,
respectively.) Independently, efforts
to
map
CDC24,
a gene whose
product is involved in the morphogenetic events of the
cell cycle
(PRINCLE
and
HARTWELL
1981;
SLOAT, /\DAMSand
PRINGLE
1981).
led
to its
localization
near
PYKI
on chromosome
I
(see following data). T h e following data then
demonstrated that
t s l l - I
and
t s l l - 2
are, in fact, alleles of
CDC24.
( 1 )
t s l l - 1
74
D.
KABACK ET AL.HALVORSON
1978).
(2)
t s l l - 1
and
t s l l - 2
do not complement
cdc24-1
or
cdc24-
4
testers, although all strains involved complement strains carrying other
ts
lethals on chromosome
I
(Figure
1). (3)
Dissection of asci from the
t s l l - 1
Xcdc24-4
diploid yielded
24
complete tetrads, all of which were
0
Ts+:4 Ts- for
growth at
36.5'.
(4) Both
t s l l - 1
and
t s l l - 2
strains displayed the characteristic
terminal cell morphology of
cdc24
mutants (SLOAT,
ADAMS
and PRINGLE
1981)
after growth at
37
O.
Because four independently isolated
cdc24
mutants have
been described previously (HARTWELL
et al.
1973;
SLOAT,
ADAMS
and PRINCLE
1981),
the
t s l l - 1
and
t s l l - 2
mutations have been renamed
cdc24-5
and
cdc24-
6 ,
respectively.
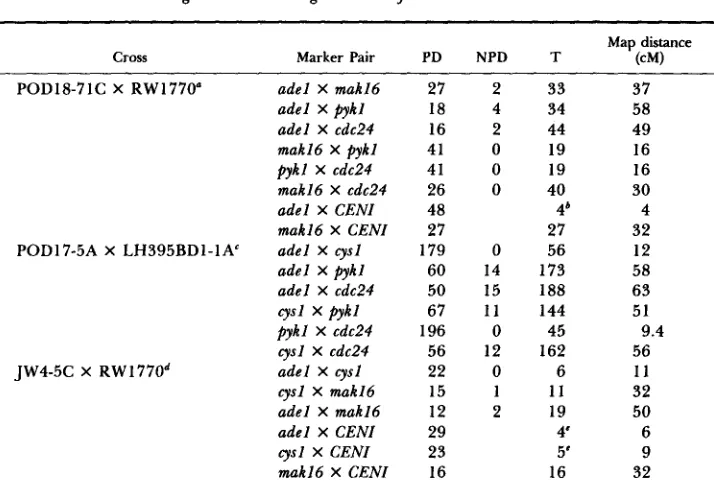
T h e map order of
PYKI
and
CDC24
relative to more centromere-proximal
genes was determined by the crosses shown in Table
2.
Together with previ-
ously published data
(MORTIMER
and SCHILD
1980, 1982;
ROTHSTEIN
and
SHERMAN
1980),
these data establish the map for chromosome I that is shown
in Figure
2.
Isolation and identijication
of
new ts-lethal mutations mapping on chromosome
I:
With the expectation of identifying additional essential genes on chromosome
I,
we
undertook the isolation of ts-lethal mutations in a strain monosomic for
chromosome
I
(see
MATERIALS AND METHODS).After screening approximately
l o 6
colonies from the EMS-treated population,
163
clones capable of growth
on YEPD at
25',
but not at
37',
were
isolated. Approximately
120
of these
clones sporulated and yielded viable, presumably haploid spores, all of which
were Ts-;
47
of these mutants have been analyzed further. In
16
cases, ratios
of
3:l
and 4:O (Ts+:Ts-) were observed in subsequent crosses, suggesting that
more than one mutation was responsible for the original Ts- phenotype. These
mutants were not analyzed further simply because of the difficulties of such
an analysis. In one case (isolate
tsb23),
ratios of
1:3
and
0:4
(Ts+:Ts-) were
observed in the subsequent cross, indicating the presence of two ts-lethal mu-
tations in the original mutant (see following data), whereas in the remaining
30
cases, only ratios of
2
Ts+:2
Ts- were observed. These
31
mutants
(32
ts
mutations) were included in the genetic analyses described here.
After approximately 2.4
Xl o 5
colonies from the NG-treated population
were screened,
18 Ts-
clones were isolated;
17
of these clones sporulated and
yielded at least one viable spore, but in ten cases, ratios of
3:l
and
4:O
(Ts+:Ts-)
were observed in subsequent crosses. Only the remaining seven iso-
lates,
which consistently yielded ratios of
2
Ts+:2 Ts- in subsequent crosses,
were included in the genetic analyses described here.
Prior to complementation analyses, the mutations of interest were tested for
dominance by crossing to appropriate Ts+ haploids. In all but one case, the
mutations were recessive, since the heterozygous diploids grew normally at
37".
T h e one exceptional case was isolate
tsb68,
whose mutation appeared at
least partially dominant in some, but not all, crosses to other haploids.
MUTATIONS ON YEAST CHROMOSOME Z
TABLE 2
Linkage data establishing the order
of
chromosome I markers75
Cross Marker Pair PD NPD T Map (distance 4
POD18-71C X RW1770” adel X mak16 adel X pykl adel X cdc24 makl6 X p y k l p y k l X cdc24 makl6 X cdc24 adel X CENI makl6 X CENI adel X cysl adel X pykl adel X cdc24 cysl X p y k l p y k l X cdc24 cysl X cdc24 adel X cysl cysl X makl6 adel X makl6 adel X CENI cysl X CENI makl6 X CENl PODl7-5A X LH395BD1-1A‘
J w 4 - 5 c x RW1770d
27 2
18 4
16 2
41 0
41 0
26 0
48 27
179 0
60 14
50 15
67 1 1
196 0
56 12
22 0
15 1
12 2
29 23 16
33 37
34 58
44 4 9
19 16
19 16
40 30
4b 4
27 32
56 12
173 58
188 6 3
144 51
45 9.4
162 56
6 1 1
1 1 32
19 50
4‘
65’ 9
16 32
For each cross, diploids were obtained and sporulated. Asci were dissected by conventional techniques. The haploid parents are described in Table 1. Abbreviations are PD, parental ditype; NPD, nonparental ditype; T , tetratype. For the linkage of markers to the chromosome Z centrom- ere (CENI), the data given are for firstdivision segregations (FDS; under PD) and seconddivision segregations (SDS; under T); the segregation patterns for the centromere were deduced from the segregation patterns for t r p l , leu2 and a d e l . Map distances were estimated from the tetrad data using Figures 2 and 3 of MORTIMER and SCHILD (1980). Apparently because of the presence in these crosses of the cysl mutation, of multiple ts-lethal mutations, or both, the frequency of uncertainties in scoring was somewhat higher than usual. Not only was it frequently difficult to distinguish cysl from CYSl, but cysl segregants often grew sufficiently poorly (even on cysteine- containing plates) that scoring of other markers (particularly the ts markers) was difficult. To minimize problems in the scoring of cysl, all relevant plates were scored independently by two observers before any of the other data were available. Moreover, each segregant was scored both in a comparison of a “complete” plate (containing minimal medium plus all commonly used nutri- tional supplements, including cysteine) to a “complete-minus-cysteine” plate and in a comparison of a “minimal
+
cysteine” plate to a “minimal” plate (with both of the minimal plates containing also a minimum set of other supplements relevant to the cross in question). Unequivocally better growth on the cysteine-containing plate in either comparison was regarded as sufficient to score a segregant as cysl. The comparison of complete plates usually, but not always, provided the more convincing scoring. To ensure that the residual uncertainties in the scoring of cy31 and the other markers had not perturbed the conclusions drawn, all data from all crosses were assigned during the initial analyses to one of five reliability classes based both on our confidence in the particular tetrad as a whole (which was sometimes reduced by our having recovered only three spores or by one or more markers’ having failed to segregate 2:2) and on our confidence in the scoring of the particular pair of markers under consideration. As the conclusions about map order were identical, and the map distances similar, regardless of which reliability classes were included in the analyses, data from all classes but that of lowest reliability have been combined for presentation in the Table and for estimation of map distances.The three ts-lethal markers in this cross were scored by complementation (see MATERIALS AND
TABLE 2-Continued
cross strongly supports the map order of MAK16-PYK1-CDC24 that is suggested by the estimated map distances. Excluding the 24 tetrads in which no crossovers were detected in the interval bounded by these three markers, and the six tetrads in which one of these markers (pykl in each case) did not segregate 2:2, the available tetrads can be explained by one crossover in this interval (34 cases) or two crossovers in this interval (two cases, both three-strand doubles) if the order is MAK16-PYKl-CDC24. In contrast, to explain the same tetrads requires one crossover in the interval (17 cases) or two crossovers in the interval (19 cases, including 17 two-strand doubles and two three-strand doubles) if the order is either PYKl-MAK16-CDC24 or MAKI6-CDC24-PYKl. Similarly, both of the estimated map distances and the analysis of individual tetrads from this cross support the previously reported (MORTIMER and SCHILD 1980) map order of ADEl-MAK16-PYKl. With this order, the available tetrads can be explained by zero crossovers in the interval bounded by these three markers (16 cases), one crossover in this interval (29 cases) or two crossovers in this interval (1 2 cases, including three two-strand doubles, five three-strand doubles and four four- strand doubles). In contrast, if the order were ADEl-PYKl-MAK16, the tetrads with crossovers detected in the relevant interval would need to be explained by one crossover in this interval (23 cases), two crossovers in this interval (1 6 cases, including nine two-strand doubles, five three-strand doubles and t w o four-strand doubles) or three crossovers in this interval (two cases). Given the order MAKl-PYK1-CDC24, an order of ADEl-PYKI-MAK16 would also require that CDC24 be rather close to A D E l , which it clearly is not.
'
Of these four tetrads, t w o were NPD for adel X makl6, and two were T , with both of the latter showing FDS for makl6. Thus, these data support the previous conclusion (MORTIMER and SCHILD 1980; ROTHSTEIN and SHERMAN 1980) that the centromere is between ADEl and MAK16. The t w o ts-lethal markers in this cross were scored by complementation (see MATERIALS AND METHODS); scoring was usually clear. u r a l and MAT were also scored in nearly all tetrads and segregated 2:2 with only a few exceptions. Analysis of individual tetrads from this cross strongly supports the map order of CYSl-PYKl-CDC24 that is suggested by the estimated map distances. Of the 45 tetrads that were T for pykl X cdc24, five were either 3:l or seriously uncertain for cysl. The remaining 40 tetrads were distributed as follows: 15 were PD for pykl X cysl and T for cdc24 X cysl; four were T for pykl X cysl and PD for cdc24 X cysl; four were T for pykl X cysl and NPD for cdc24 X cysl; two were NPD for pykl X cysl and T for cdc24 X cysl; and 15 were T for both intervals.makl6 was the only ts-lethal marker segregating in this cross and was easily scored by replica plating to YEPD at 36". t r f l and leu2 were also scored in all tetrads and segregated 2:2 with only one exception. Analysis of individual tetrads from this cross supports the map order suggested by the estimated map distances and by previously published data (MORTIMER and SCHILD 1980). Excluding the 11 tetrads in which no crossovers were detected in the interval bounded by A D E l , CYSl and MAK16, and the seven tetrads in which one of these markers appeared not to segregate 2:2 (six somewhat questionable cases for cysl and one case for m a k l 6 ) , the available tetrads can be explained by one crossover in this interval (14 cases) or two crossovers in this interval (two cases, both four-strand doubles) if the order is ADEl-CYSl-MAK16. In contrast, to explain the same tetrads would require one crossover in the interval (ten cases), two crossovers in the interval (five cases, including four two-strand doubles and a four-strand double) or three crossovers in the interval (one case), if the order were CYSl-ADEl-MAK16.
'Analysis of these individual tetrads supports the conclusion that the centromere is between ADEl and CYSl (MORTIMER and SCHILD 1980; ROTHSTEIN and SHERMAN 1980). Of the four tetrads showing SDS for a d e l , two show FDS for both cysl and m a k l 6 , one has cysl apparently segregating 3:l but makl6 showing FDS and only one has cysl and makl6 both PD with respect to a d e l . Of the five tetrads showing FDS for cysl, two showed FDS for adel whereas makl6 was PD with respect to cysl, one showed FDS for adel and a 3:l segregation for m a k l 6 , one showed FDS for a d e l , whereas n a k l 6 was T with respect to cysl and only the one tetrad showed adel and makl6 both PD with respect to cysl.
gested by complementation analysis came from analysis of the linkage relation-
ships
of the mutations. Each putative
cdcl5
mutation examined showed the
expected tight linkage to
adel
(Table
4);
in addition, crosses between strains
carrying the
tsb40
and
tsb43
mutations, between a
tsb43
strain and a
cdcl5-1
MUTATIONS ON YEAST CHROMOSOME Z
77
IOc
M
H
COC24 PYKI
MAK46
C Y 3
AOE!
I
I
,I
I
CYC3
SP07 LET4 COCIS
FLOI
FIGURE 2.-Genetic map of
S.
cereuisiae chromosome I. This map is based on the data given in Table 2 (for the genes shown above the line) and those collected by MORTIMER and SCHILD (1980,1982) and ROTHSTEIN and SHERMAN (1980). The order of PYKl and CYC3 with respect to the flanking markers has not been determined by linkage analyses. However, molecular studies suggest that CYC3 lies between PYKl and CDC24 (A. TZACALOFF and R. ROTHSTEIN, personal communi- cation). The map distances shown should be taken as approximate, as there appear to be significant variations in different crosses in the map distances determined for various intervals on chromosome I (Table 2; Table 1 of MORTIMER and SCHILD 1980; KAWASAKI 1979).
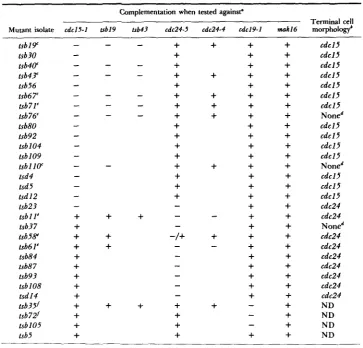
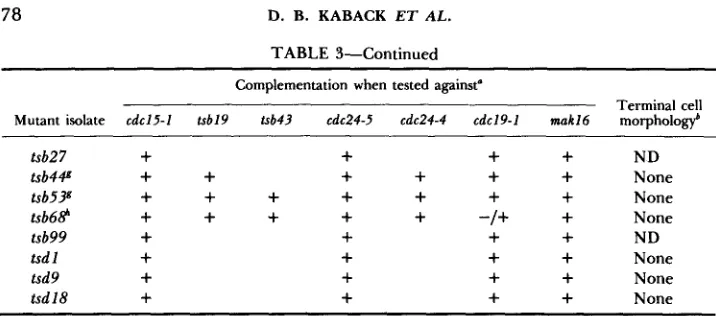
TABLE 3
Complementation behavior and terminal cell morphologies of newly isolated mutants
Complementation when tested against'
Terminal cell Mutant isolate cdcl5-1 tsbl9 tsb43 cdc24-5 cdc24-4 cdcl9-1 mahl6 morphology"
tsbl9' tsb30 tsb4@ tsb4Y tsb56 tsb67' tsb71" tsb76" tsb80 tsb92 tsbl04 tsbl09 tsbll0" tsd4 tsd5 tsd 12 tsb23 tsbl l e
TABLE 3-Continued Complementation when tested against"
Terminal cell Mutant isolate cdcl5-1 tsb19 a b 4 3 cdc24-5 cdc24-4 cdcl9-1 makl6 morpholod
tsb27
+
+
+
+
N Dt s b W
+
+
+
+
+
+
Nonetsb538
+
+
+
+
+
+
+
Nonet s b 6 d
+
+
+
+
+
-I+
+
Nonetsb99
+
+
+
+
NDtsd 1
+
+
+
+
Nonetsd9
+
+
+
+
Nonet s d l 8
+
+
+
+
Nonea Complementation tests were normally done in grids such as that of Figure 1. Because some pairs of strains appeared not to mate well, most tests were done in both arrangements with respect to mating type (e.g., a M A T a t s b l 9 was tested against a M A T a c d c l 5 - I , and a M A T a t s b l 9 was tested against a M A T a cdcl5-1). Clear evidence of complementation in either arrangement was taken as sufficient to justify an entry of
+
in the Table. In a few cases in which questionable results in the complementation grids seemed potentially significant, the complementation tests were repeated using isolated diploid clones. Blank spots in the table imply that the corresponding pairs of mutations were not tested against each other.Cellular morphologies were determined by phase-contrast microscopy on cells removed from YEPD plates after 24 hr at 37". The distinctive morphologies of c d c l 5 and cdc24 cells have been described by HARTWELL et a1 (1973) and SLQAT, ADAMS and PRINGLE (1981). ND means that the cells were not examined microscopically; "none" means that the cells were examined, but no distinctive morphological phenotypes were observed.
'These mutants were also tested against cdc15-9 (tsb43 and t s b l l o ) , cdcl5-10 (tsb40), or both ( t s b l 9 , tsb67, tsb71 and tsb76); clear noncomplementation was observed in all cases (e.g., the tsb71 results shown in Figure 1). Clear noncomplementation was also observed between tsb67 and tsb71 and between tsb76 and t s b l l 0 . tsb40 and tsb71 clearly complemented the additional pykl tester tsb35 (see Figure 1 and footnote&. In contrast, tsb67 showed only weak complementation with tsb35. The reason for this behavior is unknown, as tsb67 complemented well with cdcl9-1 in several independent tests, and Ts+ segregants (two among 16 viable spores) were recovered in a cross of tsb67 X tsb35.
Various possible explanations for such aberrant morphological phenotypes have been discussed and exemplified by HARTWELL et al. (1973) but were not explored further here (note, however, the case of tsb23). Note that linkage data (see text) also support the conclusion that tsb76 carries a cdc15 mutation.
t s b l l and tsb61 also clearly failed to complement both each other and a cdc24-I tester, whereas t s b l l clearly complemented the additional pyhl tester tsb35 (see footnote
f).
In contrast, tsb58 appeared to complement (to a variable extent) cdc24-I, cdc24-4, cdc24-5, t s b l l and tsb6I testers in some matings. It is not yet clear if this represents genuine interallelic complementation.f tsb35 also clearly complemented several additional c d c l 5 testers (see Figure 1 and footnote c ) ,
but failed to complement with tsb72. The noncomplementation of tsb35 with cdcl9-1 (Figure 1) was confirmed on a known diploid.
g tsb44 and o b 5 3 also clearly complemented tsb76 ( c d c l 5 ) , tsbl I (cdc24) and tsb35 ( p y k l ) .
'
The tsb68 mutation appeared dominant in some, but not all, crosses. For example, comple- mentation with both cdcl9-1 and tsb35 testers was variable and sometimes weak or undetectable, although the linkage data (Tables 4 and 6) appeared to rule o u t the possibility that tsb68 carries a p y k l mutation (See also Table 5 . )segregants in nine, 18 and 11 tetrads, respectively. T h e putative
cdc24
muta-
tions examined showed the expected linkage to
cdc24-5
and lack
of
linkage to
adel
(Table 4). T h e putative
pykl
mutations examined
(tsb35, tsb72)
appeared
linked both
to
adel
and
to
cdc24-5
(Table 4). In addition, a cross of a
tsb35
TABLE 4
Tests for linkage between newly isolated mutations and chromosome I markers
Test marker
adel cdc24-5
Complementation
Mutation tested group PD NPD T PD NPD T
tsb40 cdcl5 20 0 6 5 7 16
tsb43 cdcl5 28 0 1 4 1 23
tsb56 cdcl5 25 0 1 4 2 21
tsb92 cdc15 30 0 8 3 5 30
tsd4" cdcl5 7 1 1 ND
tsd5" cdcl5 5 0 0 ND
tsb23( ~ d c l 5 ) ~ cdcl5 14 0 1 2 1 12'
tsb23(cdc24)* cdc24 2 1 13 ND
tsb6l cdc24 ND 23 1 1 I d
tsb93 cdc24 ND 8 0 Od
tsb35 PYkl 17 2 26 27 1 18
tsb72 PYA1 6 1 18 14 0 1 1
tsb5' New 12 10 9 2 9 23
tsb27 New 1 1 8 38 1 1 10 35
tsb44 New 2 4 24 6 6 20
tsb53 New 1 1 8 34 5 6 17
tsb68f New 30 13 16 13 3 38
tsb99g New 6 4 17 5 6 17
t s d l h New 12 10 23 5 6 33
tsd9' New 2 6 13 4 4 1 1
tsd 18 New 1 1 6 3 9 1 1 43
Except where otherwise noted, data were obtained from a cross of DKl7-4B or DKl7-2B by a ts adel haploid segregant from the particular monosomic mutant strain or from a backcross of the mutant as described in MATERIALS AND METHODS. The two ts markers segregating in these and related crosses (footnotes h and
i)
were scored by complementation (see MATERIALS AND METHODS),using MATa and M A T a testers for cdc24-5 and for the tsb or tsd mutation in question. Where necessary for these and other crosses, adel was also scored by complementation. ND means that these data could not be determined in the cross in question.
a Data were obtained from crosses of DK71-4C or a ade5 by ts adel haploid segregants from the particular monosomic mutant strains.
bData were obtained from a cross of CY ade5 by a MATa adel haploid segregant that carried
both of the t s mutations present in the original monosomic tsb23 mutant. The two ts mutations segregating in the cross were then scored by complementation using MATa and M A T a testers for cdcl5-1 and cdc24-5.
'
These data refer to the linkage between the t w o different ts mutations in tsb23.PD was 0 Ts+:4 Ts-, NPD was 2 Ts+:2 Ts- and T was 1 Ts+:3 Ts-. The "Ts+" segregants in the tsb6 1 cross appeared bona fide, suggesting an extraordinary amount of recombination within the CDC24 gene. (The data in Table 3 on complementation behavior and morpholQgical pheno- type, together with the linkage data, make it almost certain that tsb61 is really ar"alle1e of CDC24.) However, some crosses involving cdc24 mutations have given misleading results because of high rates of reversion of the ts mutations, and this possibility has not yet been ruled out in the present case.
In this same cross, tsb5 gave 24 PD and NPD, and only 12 T , with respect to t r p l , consistent with the apparent centromere linkage of tsb5.
The suggestion from these data of linkage of tsb68 to chromosome 1 markers was apparently refuted (see also Table 6) by data from two other, similar crosses, in which tsb68 X adel yielded 6 PD, 5 NPD and 0 T , and 1 PD, 10 NPD and 4 T , respectively. Note that these data also support the apparent centromere linkage of tsb68.
g A MATa ade5 cdc24-5 tsb99 segregant obtained after several backcrosses was crossed by a M A T a adel Ts+ tester.
'
tsd9 and ade5 tsdl segregants obtained after several backcrosses were crossed by DKl7-3A or DKl7-2C (Table 1).Further evidence supporting the gene assignments for the new mutations
came from examination of the phenotypes of the mutants. In every case ex-
amined but three (Table 3), the putative cdcl5 and cdc24 mutants developed
at 36
"
the distinctive cellular morphologies described previously for such mu-
tants (HARTWELL
et
al. 1973; PRINCLE
and HARTWELL
1981; SLOAT, ADAMS
and PRINCLE
1981). T h e three exceptional cases probably have trivial expla-
nations (Table 3, footnote
d ) .
In addition, the putative
p y k l
mutation tsb35
was Ts- for growth on glucose but Ts+ for growth on acetate or lactate,
consistent with its possessing a temperature-labile pyruvate kinase, as do ts
p y k l
strains carrying the cdcl9-1 allele (see Table 1;
KAWASAKI
1979; FRAENKEL
1982).
Finally, we showed that a leu2 tsb35 strain (DK303-8A; Table 1) could be
transformed simultaneously to Leu+ and Ts+ using the autonomously replicat-
ing plasmid YEpl3-PYK1. This plasmid contains about 10.7 kb of yeast DNA
inserted into the LEU2-containing vector YEpl3 (BROACH,
STRATHERN
and
HICKS 1979). T h e inserted DNA has been shown to contain the pyruvate
kinase structural gene
( P Y K I )
from chromosome
I
(KAWASAKI
and FRAENKEL
1982; FRAENKEL
1982; BURKE, TEKAMP-OLSON
and NAJARIAN 1983;
Y.
STEENSMA
and
K.
COLEMAN,
unpublished results). After transformation, a Leu+
clone was isolated on leucine-free plates at 25" and shown to be Ts+ on YEPD
at 37". When this clone was grown under nonselective conditions (YEPD at
25"), about half of the colonies tested were still Leu+ and Ts+, whereas about
half were Leu- and Ts-. This result suggests that tsb35-complementing activity
was indeed carried on the unstably maintained plasmid, consistent with the
conclusion that tsb35 is an allele of
P Y K l .
In summary, 30 of the 39 mutations characterized here [or, counting t s l l -
I and ts11-2
(KABACK
and HALVORSON
1978), 32 of the 41 mutations isolated
from the strain monosomic for chromosome
1
3
fell into three previously known
genes on chromosome
I.
There were 16-17 independent isolates in CDC15
(recall that only two of the three NG-induced cdcl5 mutations can be assumed
to be independent; see
MATERIALS AND METHODS),12 independent isolates in
CDC24 (counting tsll-1 and tsll-2) and three independent isolates in
P Y K l .
N o isolates appeared to carry mutations in
MAK16
or
L E T l .
MUTATIONS ON YEAST CHROMOSOME Z
TABLE 5
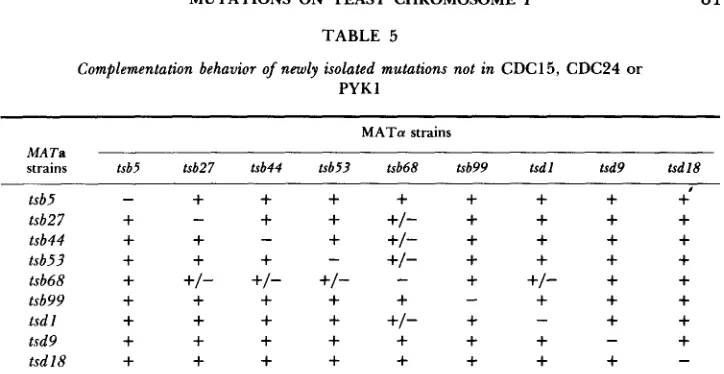
Complementation behavior of newly isolated mutations not in CDC15, CDC24 or PYKl
81
MATa strains
M A T a
strains tsb5 tsb27 tsb44 tsb53 tsb68 tsb99 tsdl tsd9 t s d l 8 ~~
tsb5
-
+
+
+
+
+
+
+
+'
tsb27
+
-
+
+
+/-
+
+
+
+
tsb44
+
+
-
+
+/-
+
+
+
+
tsb53
+
+
+
-
+/-
+
+
+
+
tsb68
+
+/-
+/-
+/-
-
+
+/-
+
+
tsb99
+
+
+
+
+
+
+
+
+
+
tsd 1
+
+
+
+
+/-
+
-
+
tsd9
+
+
+
+
+
+
+
t s d l 8
+
+
+
+
+
+
+
+
-
-
-
Complementation was scored as described in MATERIALS AND METHODS. An entry of
"+/-"
indicates that complementation was variable and sometimes weak in crosses between these pairs of mutants, apparently because of the dominance of the tsb68 mutation(4
also Table 3, footnote h).TABLE 6
Disome exclusion tests for chromosome I linkage of newly isolated mutations
No. of tetrads segregating
Ts+:Ts- ADEl+:adel
Mutation 4:O 3:1 2:2 4:O 3:l 2:2
tsb27 0 0 8 3 2 5
tsb44 0 0 8 3 4 1
tsb53 0 0 20 17 3 0
tsb68 0 0 7 2 5 0
tsdl 0 0 23 13 6 4
tsd9 0 0 18 9 2 7
t s d l 8 0 0 1 1 7 2 2
In each case, a M A T a adel haploid containing the tsb or tsd mu- tation was crossed to X3402-15C, a strain that appears to be disomic for chromosome I and homozygous ADElIADEl (Table 1). Asci were dissected and the segregants analyzed for growth at 37" and for growth in the absence of adenine. No attempt was made to analyze tsb5, and crosses of several different tsb99 strains to X3402-15C did not yield sufficiently good spore viability to make the analysis feasi- ble.
DISCUSSION