The Influence of Demographic Variables on Solid Waste
Minimization: A Case Study of Shah Alam City, Malaysia
Nor Eeda Haji Ali 1 and Ho Chin Siong 2
Department of Urban and Regional Planning, Faculty of Built Environment, Universiti Teknologi Malaysia.
1
Abstract
With the increasing rate of urbanisation especially in developing countries, policy makers and planners are faced with the challenge of sustainable solid waste management. The traditional method of waste management via landfills has some environmental and health challenges associated with it. Therefore, waste minimization through recycling, reusing and reducing the quantity of waste is one major way of achieving a sustainable solid waste management. This study investigates the influence of household attributes on waste minimization knowledge in Shah Alam city,Malaysia. Through a household survey, 100 respondents were randomly chosen from the three housing types (terrace, semi –detached, bungalow) in the study area. Findings from the study revealed that respondents’ knowledge on waste minimization was above average. However, the elderly and women tended to be more knowledgeable in terms of materials to be recycled and what the colour of each waste bin in the neighbourhood signifies.
Keywords: Waste minimization, Socio-demographic variables, Household, Knowledge 1.0 Introduction
Management of solid waste poses a great challenge to local authorities in developing countries , and one major way to address this challenge is through integration of recycling systems in to existing and future solid waste management (Suttibak and Nitivattananon ,2008) .According to Van de Klundert and Anschütz, (2001) integrated solid waste management (ISWM) is a comprehensive approach to prevent, recycle and manage solid waste in ways that most effectively protect human health and the environment. Looking at the definition of the authors, it is obvious that three main keywords were used in defining ISWM: prevent, recycle and manage. Prevent in this sense means minimization of the solid waste being generated while recycling and management are processes to protect human health and also achieve a sustainable environment. Recycling has been accepted as one major way of sustainable municipal ISWM approach that is good for local authorities due to its ability to reduce disposal costs; transport costs and extend the life span of sanitary landfills (Muttamara et al., 1994). The desire to develop a creative way of managing and controlling municipal Solid Waste (MSW) effectively has increased worldwide due to environmental concerns (Lee and Paik, 2011). Owing to the high rate of urbanization and rapid economic growth being experienced over the years in Malaysia, the governments at all levels are now faced with the problem of municipal solid waste management (MSW). Tarmud et al. (2009) noted that the contributing factors towards increasing solid waste generation in Malaysia are similar to that of other developing countries. According to the authors, the local authorities in most of the municipalities in Malaysia are saddled with the responsibility of collection of solid waste although in some like Kuala Lumpur City Hall, it has been outsourced to private companies. Although government has been making various efforts to improve MSW, the involvement of households towards achieving a sustainable waste management system could be said to be low in Malaysia. Few studies have been conducted to examine the attitude and knowledge of households towards waste minimization in Malaysia (Omran et al. 2009, Hashim et al. 2012). This study takes a different approach to fill this gap by examining how household attributes could influence knowledge on waste minimization and management in Shah Alam city, Malaysia.
2.0 Solid Waste Minimisation
develop a regional strategy for waste minimisation at the local level. However, Read et al. (1997) adopted a broader definition of waste minimization as “prevention and/or reducing the generation of waste, improving the quality of waste generated, including reduction of hazard and encouraging re-use, recycling and recovery”. Looking at these various definitions, it is obvious, that the main aim of waste minimization is to have a sustainable solid waste management via the reduction greenhouse gas emissions, pollutants and the reduction in the cost involved in landfills.
3.0 Method
The household survey was conducted in section 4 Shah Alam city .Stratified sample technique was used in selection of respondents that participated in the survey. This involves the stratification of the study area in to three groups based on the house type: terrace, semi -detached and bungalow. Persons above 18 years were interviewed in each household. In case the household head was not around, any household member that was willing to participate was administered. A total of 100 copies of questionnaires were administered in all, the proportions were 64% for terrace house and 18% for the semi -detached and bungalow respectively. The questionnaire comprises of two sections. Section A contains the demographic information of respondents while section B focused on questions relating to waste minimization. The questions in section B were measured on five point Likert scale ranging from 1 = Strongly disagree, 2 = Disagree, 3 = Neither agree or disagree, 4 = Agree and 5 = Strongly agree. The questionnaire was designed in both English language and Bahasa language in order to give those respondents who may not understand English language the opportunity to participate. A total of 92 copies of questionnaires were retrieved giving a 92% response rate. Data was analysed using the SPSS version 20. Analysis of variance (ANOVA) and T-test was conducted to determine whether or not differences exist in groups means of some selected household attributes with respect to the items used to capture knowledge on waste minimization.
4.0 Results
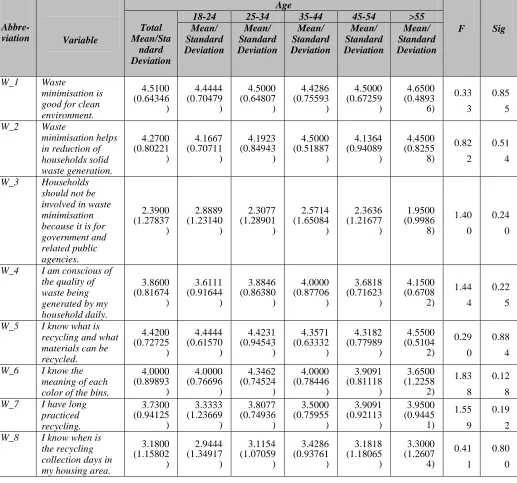
4.1 Age
on the part of the young adults to engage in sorting of wastes at home in comparison to those above 60 years who are mostly retirees .
Table 1 Influence of age on perception towards waste minimization
4.2 Gender
The results (Table 2) show that no significant differences exist (P>0.05) in seven (7) out of the eight items that were used in measuring the respondents’ level of knowledge on waste minimization based on gender. The total mean score value for the items follow this descending order: W_1 (4.51) , W_5 (4.42), W_2 (4.27) , W_6
Abbre-viation Variable
Age
F Sig Total
Mean/Sta ndard Deviation
18-24 25-34 35-44 45-54 >55 Mean/ Standard Deviation Mean/ Standard Deviation Mean/ Standard Deviation Mean/ Standard Deviation Mean/ Standard Deviation
W_1 Waste
minimisation is good for clean environment. 4.5100 (0.64346 ) 4.4444 (0.70479 ) 4.5000 (0.64807 ) 4.4286 (0.75593 ) 4.5000 (0.67259 ) 4.6500 (0.4893 6) 0.33 3 0.85 5
W_2 Waste
minimisation helps in reduction of households solid waste generation. 4.2700 (0.80221 ) 4.1667 (0.70711 ) 4.1923 (0.84943 ) 4.5000 (0.51887 ) 4.1364 (0.94089 ) 4.4500 (0.8255 8) 0.82 2 0.51 4
W_3 Households should not be involved in waste minimisation because it is for government and related public agencies. 2.3900 (1.27837 ) 2.8889 (1.23140 ) 2.3077 (1.28901 ) 2.5714 (1.65084 ) 2.3636 (1.21677 ) 1.9500 (0.9986 8) 1.40 0 0.24 0
W_4 I am conscious of the quality of waste being generated by my household daily. 3.8600 (0.81674 ) 3.6111 (0.91644 ) 3.8846 (0.86380 ) 4.0000 (0.87706 ) 3.6818 (0.71623 ) 4.1500 (0.6708 2) 1.44 4 0.22 5
W_5 I know what is recycling and what materials can be recycled. 4.4200 (0.72725 ) 4.4444 (0.61570 ) 4.4231 (0.94543 ) 4.3571 (0.63332 ) 4.3182 (0.77989 ) 4.5500 (0.5104 2) 0.29 0 0.88 4
W_6 I know the meaning of each color of the bins.
4.0000 (0.89893 ) 4.0000 (0.76696 ) 4.3462 (0.74524 ) 4.0000 (0.78446 ) 3.9091 (0.81118 ) 3.6500 (1.2258 2) 1.83 8 0.12 8 W_7 I have long
practiced recycling. 3.7300 (0.94125 ) 3.3333 (1.23669 ) 3.8077 (0.74936 ) 3.5000 (0.75955 ) 3.9091 (0.92113 ) 3.9500 (0.9445 1) 1.55 9 0.19 2 W_8 I know when is
the recycling collection days in my housing area.
(4.00), W_4 (3.86), W_7 (3.73), W_8 (3.18), and W_3 (2.39) . As earlier stated, the differences that exist among seven (7) items is not significance, but some little variations still exist among both sexes based on their mean value scores for these items. For W_1, females (4.55) recorded a little bit more than males (4.48) which suggests that they tend to agree more that waste minimization is good for clean environment. One would expect this pattern of response considering the fact that women are more involved in household chores than men hence, they would consider any action that would help in waste minimization at home as something to be embraced. In their study in Sweden, Sterner and Bartelings (1999) and Berglund (2006) found that women were more willing to participate in recycling despite the fact that they viewed it as a constructive activity. In this regard, it could be said that women engage actively in recycling activities at homes. In terms of knowledge about recycling and what materials to be recycled (W_5), both sexes scored above 4.00 meaning that they are aware of what waste minimization is but the females ( 4.50) tended to know more about the materials to be recycled than the men ( 4.37). A similar pattern was equally exhibited for the other items (W_2, W_3, W_4, W_7 , W_8). However, for W_6, significant differences exist ( F = 4.401, P<0.05). On the knowledge about the meaning of each colour on the bins, females recorded a higher mean value (4.23) in comparison to men (3.85). In this regard, it is obvious that gender has influence on the knowledge about on colours used for various bins in waste minimization. In summary, it is obvious from the results that females in the study area tended to be more committed on issues relating to waste minimization at homes than men.
Table 2 Influence of gender on perception towards waste minimization
4.3 Occupation
The knowledge on solid waste minimization was further examined in the study based on occupational group of the respondents. Results (Table 3 ) show that no significant difference (P> 0.05) exist on knowledge about waste minimization based on eight (8) items that were used to measure respondents’ level of awareness /knowledge. In contrast, respondents vary significantly on one item (W_7) ( F= 3.102, P < 0.05). The total
Abbre-viation
Variable
Gender
F Sig Total
Mean/Standar d Deviation
Male Female Mean/
Standard Deviation
Mean/ Standard Deviation
W_1 Waste minimisation is good for clean environment.
4.5100 (0.64346)
4.4839 (0.67123)
4.5526
(0.60168) 0.267 0.606
W_2 Waste minimisation helps in reduction of households solid waste generation.
4.2700 (0.80221)
4.2097 (0.85194)
4.3684
(0.71361) 0.922 0.339
W_3 Households should not be involved in waste
minimisation because it is for government and related public agencies.
2.3900 (1.27837)
2.3387 (1.25376)
2.4737
(1.33025) 0.261 0.611
W_4 I am conscious of the quality of waste being generated by my household daily.
3.8600 (0.81674)
3.7903 (0.83248)
3.9737
(0.78798) 1.190 0.278
W_5 I know what is recycling and what materials can be recycled.
4.4200 (0.72725)
4.3710 (0.75169)
4.5000
(0.68773) 0.740 0.392
W_6 I know the meaning of each color of the bins.
4.0000 (0.89893)
3.8548 (0.97252)
4.2368
(0.71411) 4.401 0.038
W_7 I have long practiced recycling.
3.7300 (0.94125)
3.6452 (0.92500)
3.8684
(0.96341) 1.330 0.252
W_8 I know when is the recycling collection days in my housing area.
3.1800 (1.15802)
3.0806 (1.20516)
3.3421
mean values obtained for the items follow this descending order: W_1, W_5, W_2, W_6, W_4, W_7, W_8, W_3. Looking further in to the group means, a pattern seems to exist on the scores recorded for each of the items. Though the differences that exist on group mean scores for these 7 items were not significant, some deductions could be made based on some slight variations in the results. The respondents agreed that waste minimization is good for clean environment; they know what recycling is all about and the materials to be recycled. In this regard, their mean value scores for these items ( W_1, W_5) were above 4.0 but the professionals and semi-professionals tended to score a bit higher than the labourers which is suggestive of more knowledge .Similarly, semi- professionals (3.90) and professionals (3.80) were a bit more conscious on the quantity of wastes they generate compared to the labourers (3.77) .Also their scores were a little higher than that of the labourers with respect to W_7 (knowledge on the designated days for collection of recycling materials in the neighbourhood). Going by the breakdown of the results, it could be said therefore that semi- professionals and professionals in the neighbourhood tend to be more knowledgeable about the whole concept of waste minimization.
Table 3 Influence of occupation on perception towards waste minimization
Abbre-viation
Variable
Occupation
F Sig Total
Mean/Standar d Deviation
Professional Semi-Professional
Labourer
Group Mean/ Standard Deviation
Group Mean/ Standard Deviation
GroupMean / Standard Deviation
W_1 Waste minimisation is good for clean environment.
4.5128 (0.65947)
4.5714 (0.55761)
4.5714 (0.67612)
4.3636
(0.78954) 0.780 0.462
W_2 Waste minimisation helps in reduction of households solid waste generation.
4.2692 (0.78415)
4.2286 (0.77024)
4.3333 (0.73030)
4.2727
(0.88273) 0.115 0.892
W_3 Households should not be involved in waste minimisation because it is for government and related public agencies.
2.5000 (1.32655)
2.6571 (1.28207)
2.4762 (1.43593)
2.2727
(1.31590) 0.565 0.571
W_4 I am conscious of the quantity of waste being generated by my household daily.
3.8205 (0.86405)
3.8000 (0.90098)
3.9048 (0.76842)
3.7727
(0.92231) 0.140 0.869
W_5 I know what is recycling and what materials can be recycled.
4.3974 (0.74450)
4.3429 (0.72529)
4.4762 (0.51177)
4.4091
(0.95912) 0.210 0.811
W_6 I know the meaning of each color of the bins.
4.0641 (0.77861)
4.0000 (0.80440)
4.2381 (0.70034)
4.0000
(0.81650) 0.712 0.494
W_7 I have long
practiced recycling.
3.6923 (0.95764)
3.8571 (0.94380)
3.8571 (0.65465)
3.2727
(1.12045) 3.102 0.050
W_8 I know when is the recycling collection days in my housing area.
3.1667 (1.14434)
3.4000 (1.11672)
3.0952 (1.09109)
2.8636
4.4 Marital Status
The respondents’ perception on solid waste minimization was examined in this section based on their marital status. The results in Table 4 reveal that no significant differences exist ( P> 0.05) in all the eight items used for measuring their level of knowledge . Looking at the individual items, it could be seen that some slight differences exist in terms of mean value scores for the group means. This slight variation means that the respondents have some degree of agreement or disagreement on the items that were used to capture knowledge on waste minimization, though not large enough to warrant any significant differences. All the groups (married, single, single mother/ father) scored above 4.0 for items W_1 , W_2 and W_5 meaning that they agreed that waste minimization is good for clean environment, helps in reduction of household solid waste and that they are aware of what materials to be recycled . However, one salient point that was observed based on their group mean values scores is that the single parents scored a bit higher than the married and single in these items. One could say in this regard that single parents are bit more knowledgeable on waste minimization. A similar pattern was exhibited for the other items (W_3, W_4,W_7,W_8, W_6) .
Table 4 Influence of marital status on perception towards waste minimization
Abbre-viation
Variable
Marital Status
F Sig Total
Mean/Standard Deviation
Married Single Single mother/ father Mean/ Standard Deviation Mean/ Standard Deviation Mean/ Standard Deviation
W_1 Waste minimisation is good for clean environment. 4.5100 (0.64346) 4.5185 (0.63664) 4.4359 (0.68036) 4.8571 (0.37796) 1.29 0 0.28 0
W_2 Waste minimisation helps in reduction of households solid waste generation. 4.2700 (0.80221) 4.2778 (0.81070) 4.2051 (0.83286) 4.5714 (0.53452) 0.61 9 0.54 0
W_3 Households should not be involved in waste minimisation because it is for government and related public agencies. 2.3900 (1.27837) 2.2222 (1.28367) 2.4615 (1.25334) 3.2857 (1.11270) 2.30 4 0.10 5
W_4 I am conscious of the quality of waste being generated by my household daily. 3.8600 (0.81674) 3.9630 (0.77613) 3.7179 (0.82554) 3.8571 (1.06904) 1.01 9 0.36 5
W_5 I know what is recycling and what materials can be recycled. 4.4200 (0.72725) 4.4630 (0.63582) 4.2821 (0.85682) 4.8571 (0.37796) 2.10 7 0.12 7
W_6 I know the meaning of each color of the bins.
4.0000 (0.89893) 3.9074 (0.99562) 4.0256 (0.74294) 4.5714 (0.78680) 1.74 2 0.18 1 W_7 I have long practiced
recycling. 3.7300 (0.94125) 3.8704 (0.91211) 3.4872 (0.91398) 4.0000 (1.15470) 2.24 1 0.11 2 W_8 I know when is the
5.0 Conclusion
Waste minimization as an approach to solid waste management helps in the separation of wastes from the source. Wastes generated by households in Malaysia constitute quite a large percentage in the total waste generation. Government have initiated various programmes on solid waste minimization such as, Street, drainage and building Act 1974, Solid waste and public cleansing Act 2007. However, the success of these programmes to a certain level lies on the corporation of households. To this end, households are expected to key in to such initiatives by government towards sustainable waste management. This study looks at the perception of households towards waste minimization in Shah Alam city. Findings show that the knowledge of households in the study area on waste minimization is above average, which suggests that they are aware of the concept of waste minimization. However, their level of knowledge varied with respect to age categories. The elderly ( ie those above 50 years) tended to have more knowledge about waste minimization than the younger ones. Also, females were more knowledgeable in terms of what materials to be recycled and meaning of each colour on the waste bin in the neighbourhood than males. Among the occupational groups, the semi- professional and professionals seemed to be more knowledgeable about waste minimization than those engaged in labourer work. This could be as a result of educational qualification, normally the semi-professional and professionals are likely to be degree holders while those engaged in labourer work may be primary or secondary school certificate holders. Findings equally show that single parents tended to be more involved and knowledgeable about waste minimization than married couples. In order to understand the behaviour of households towards waste separation and recycling activities, their environmental knowledge and attitude must be examined (Singhirunnusorn et al. 2012) . Literature is replete with studies that have identified knowledge of people on environment as the major crucial factor influencing household recycling (Osakamp et al. 1991; Nixon and Saphores, 2009). For a developing country like Malaysia, the involvement of households in its solid waste management programme is necessary in order to achieve the desired results. In this regard, the local authorities and other stakeholders should embark on massive enlightenment campaign to sensitize the citizens on the need to engage in waste minimization.
References
Berglund C.(2006) The assessment of households’ recycling costs: the role of personal motives. Ecological Economics 56 (4):560–9.
Berglund, C (2006). The assessment of households’ recycling costs: the role of personal motives, Ecological Economics 56, 560-569
Franchetti MJ (2009) Solid Waste Analysis and Minimization a systems approach. The McGraw-Franchetti Hill Companies, Inc, New York
Hashim, K.S , Mohamed , A.H; Redza, H.Z (2012 ) Developing a waste minimization awareness model through community based movement: A case study of the I I U M Green Team. Malaysia Journal of Society and Space issue 5 (112 - 123) 112 Themed Issue: Masyarakat, Ruang dan Alam Sekitar (MATRA)
Lee .S, & Paik , H.S (2011) Korean household waste management and recycling behavior . Building and Environment 46 1159-1166
Muttamara S, Visvanathan C, Alwis KU.(1994) Solid waste recycling and reuse in Bangkok Waste Management & Research12:151–63.
Nixon, H. and Saphores, J.M. (2009) Information and the decision to recycle: results from a survey of US households, J. Environ. Plann. Manage., 52, 257–277.
Omran, A., Mahmood, A., Abdul Aziz, H.& Robinson, G .M. (2009) Investigating Households Attitude Toward
Recycling of Solid Waste in Malaysia: A Case Study . International Journal of Environmental Research Vol. 3, Num. 2, pp. 275-288
Oskamp S, Harrington M.J, Edwards T.C, Sherwood D.L, Okuda S.M, Swanson D.C (1991) Factors influencing household recycling behavior. Environment and Behavior 23 (4):494–519.
Read AD, Phillips PS, Murphy A. (1997) English county councils and their agenda for waste minimization. Resourc Conserv Recycl 7;20:277 – 94.
Singhirunnusorn, W; Donlakorn, K & Kaewhanin , W (2012) Contextual Factors Influencing Household Recycling Behaviours: A Case of Waste Bank Project in Mahasarakham Municipality . ASEAN Conference on Environment-Behaviour Studies, Savoy Homann Bidakara Bandung Hotel, Bandung, Indonesia, 15-17 June 2011. Procedia - Social and Behavioral Sciences 36, 688 – 697 .
Sterner .T,& Bartelings H.(1999) Household waste management in a Swedish municipality: determinants of waste disposal recycling and composting. Environmental and Resource Economics;13 (4):473–91. Suttibak, S & Nitivattananon, V (2008 )Assessment of factors influencing the performance of solid waste
recycling programs . Resources, Conservation and Recycling 53 45–56
Tarmudi Z, abdullah M.L & Tap, A.O.M (2009) An overview of municipal solid wastes generation in Malaysia. Journal Teknologi, 51(F) Dis. 1–15
Tonglet , M., Phillips , S.P ; Bates M. P (2004) Determining the drivers for householder pro-environmental behaviour: waste minimization compared to recycling . Resources, Conservation and Recycling 42 27–48.