A
PRACTICAL AND USER FRIENDLY INTERFACE OF FUZZY
LOGIC RULE-BASED SYSTEM FOR MAINTENANCE POLICY
DECISION MAKING
communicsupdating,da
Abd Samad Hasan Basari', Mohammad Ishak Desa2 and Nanna Suryana Hermanl ign that redu in the form dl 'Faculty ofInformation and Communication Technology
Universiti Teknikal Malaysia Melaka Karung Berkunci 1200, 75450 Ayer Keroh, Melaka
2Faculty of Computer Science and Information System Universiti Teknologi Malaysia
81300 Skudai, Johor Logical grouph
.should be aligr Email: l{abdsamad.nsuryana}@[email protected].
should reflect c
'~, code.
Abstract: This paper discusses the use of fuzzy logic rule based (FLRB) to improve and j Visually appea enhance maintenance policy decision making. Currently, the decision provided by preferable to
maintenance engineers is referring to their expert's opinion based on experience. By using a Alignment crei
practical and user friendly FLRB method, better opinion could be derived. There are mainly labels name, a
three basic features of FLRB namely fuzzification, FLRB evaluation and defuzzification. The :: vertically align
decision making grid (DMG) is an added feature to classify for example the most important If
machines by their associated grid of maintenance policy. The grid is developed from the low,
medium and high range, the prevention action information and the above mentioned three fields basic features of FLRB. A real world case study at Palm Oil Mill (POM) plant is used to test replaced by do
the practicality and user friendliness of the technique. Consistent ten
abbreviations
Keywords: Fuzzy Logic Rule-Based (FLRB), maintenance policy, decision making. consideration.
Visible space
size of the fief
1. INTRODUCTION be needed. Un
only displays,
The concept of fuzzy logic is a pragmatic idea of artificial intelligence (AI) that was first Convenient cu
introduced by Lofti Zadeh [13] as a fuzzy set theory. Since then, the vast growth interest in cursor, such as
fuzzy logic is underscored with the numerous researches being conducted in this area (see for Error correctic
example [4], [7]). In the case of maintenance policy decision making [5] the main issue is key and overt)
how good the user interface when interact with the users. Researches on user interface design
have been conducted by many researchers, for example in [I], [2], [3]. To date, the graphical
user interface (GUI) has proved its success with the considerable number of successful
systems being implemented using this kind of interface, see for example in [6], [9], [12].
The computer forms or screens and its associated keyboard are the interface elements that
lets the user communicate with the computer. The computer forms are used primarily for data
input, data updating, data deletion, and data inquiry. It is recognised the importance of a good
screen design that reduces the interface complexity as perceived by the users. The features
embodied in the form design [II] include:
a) Meaningful title. Identifies the topic and avoid computer terminology.
b) Comprehensible instruction. Describe the user's tasks in familiar terminology. Be
brief; if more information is needed, make a set of help screens available to the
novice user.
c) Logical grouping and sequencing of fields. Related fields should be adjacent, and
should be aligned with blank space for separation between groups. The sequencing
should reflect common patterns. For example, city followed by state followed by zip
code.
d) Visually appealing layout of the form. Using a uniform distribution of fields is
preferable to crowding one part of the screen and leaving other parts blank.
Alignment creates a feeling of order and comprehensibility. For example, the field
labels name, address, and city can be right justified so that the data-entry field are
vertically aligned. This layout allows the frequent user to concentrate on the entry
fields only. If users are working from hard copy, the screen should match the paper
form.
e) Familiar fields' level. Common terms should be used. If home address were
replaced by domicile, many users would be uncertain or anxious about what to do.
f) Consistent terminology and abbreviations. Prepare a list of terms and acceptable
abbreviations and use the list diligently, making additions only after careful
consideration.
g) Visible space and boundaries for data-entry fields. Users should be able to see the
size of the field and anticipate whether abbreviations or other trimming strategies will
be needed. Underscores can indicate the number of the characters available on text
only displays, and an appropriate-sized box can show field length in GUls.
h) Convenient cursor movement. Use a simple and visible mechanism for moving the
cursor, such as TAB key or cursor movement arrows.
i) Error correction for individual characters and entire fields. Allow use of a backspace
key and overtyping to enable the user to make easy repairs or changes to entire fields.
j) Error prevention. Where possible, prevent users from entering incorrect values. For example, in a field requiring a positive integer, do not allow the user to enter letters, minus signs, or decimal points.
k) Error messages for unacceptable values. If users enter unacceptable value, the error message should appear on completion of the field.
I) Optional field clearly marked whenever appropriate, the word optional or other indicators should be visible.
m) Explanatory messages for fields. Ifpossible, explanatory information about a field or the permissible values should appear in a standard position, such as in a window on the bottom, whenever the cursor is in the field.
n) Completion signal. It should be clear to the users what they must do when they have finished filling the fields.
The main purpose of this paper is to discuss the practical and user friendly of fuzzy logic rule-based interface for maintenance policy decision making. The paper is organized as follows: Section 2 presents the design of FLRB interface. Section 3 on the other hand, discusses the testing and the result on practicality and user friendliness of FLRB interface. Finally our conclusions and future work directions are summarized in Section 5.
2. THE DESIGN OF FLRB INTERFACE
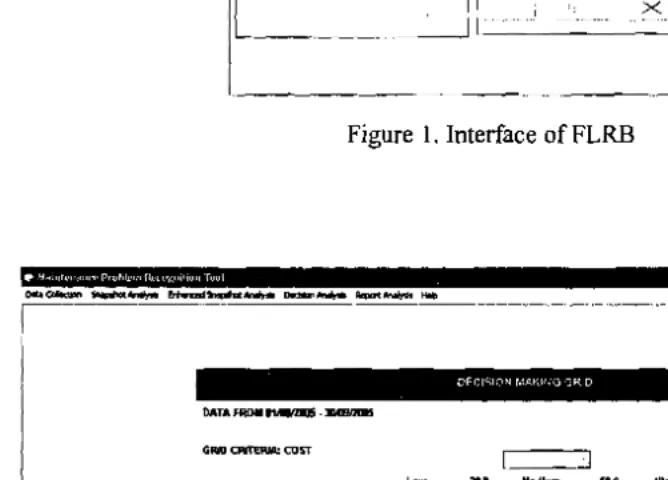
This section discusses on the interfaces that interact with the FLRB modules as shown in
Figure I and Figure 2. Figure I shows the fuzzification, FLRB evaluation and defuzzification
I
process. Fuzzification process aims to identify the fuzzy set in low, medium and high range.'"
.,
Trapezium membership value is used and each of the criteria is chosen by their associatedrange of low, medium and high value. This process acts as an input from crisp (normal) value to fuzzy set value. FLRB evaluation aims to identify the rules associated with the prevention action or policy taken. For example, IF Frequency is Low AND Downtime is High THEN
DM (Detection-based Maintenance) is adopted. The sets of nine rules must be inserted
because the DMG value grid is nine. This tool used maximum-minimum (OR & AND Zadeh) as fuzzy inference computations.
Defuzzification aims to provide a reference to defuzzify (crisp) the fuzzy value (input) into a meaningful manner (output). If in FLRB process has already chosen Frequency and Downtime as their rules, it could not be used again in defuzzification process. This defuzzification interface provides a selection of criteria with their associated reference or weight to defuzzify the given fuzzy set. The centroid (centre of gravity) under the curve of the function is used to defuzzify the fuzzy input. Given the chosen criteria for example cost function of each prevention action, one can arrange the prevention actions, the fuzzy output,
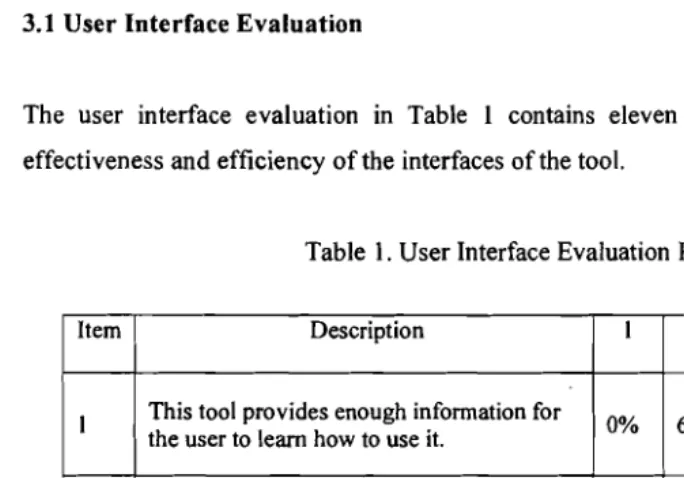
and the cost scale function. The feedback mechanism offered by OMG (see Figure 2) will For
show the machines condition and their associated prevention action.
i
¥MN%*.p"'•.
'"lijijji!.i"o.t.(~~...,... ~..:I~~ 0. ... ...,.. Report"""""" !'tIlp
~ ----~----.'''_--'_'_---'''.-•.._,..
__
....__
.'-_.,--~.-,,_..-_._--..---.-..._
....__...._...__.~,_.._.-_.,._---.__
.-.._~._.~.~.,,_.,.__."
tlJl/Vl;H lUlL Illj jllfll/U10ll
Figure I. Interface of FLRB
,i§@.F,ijMPifi,I"§ii""
in
DECI'Slor~r,'M\ING "3RID
DATA fROll tt.-..s .:1M1!1n1D5
I
Low ]DJt ••dl... High
15A
...
....
C
I
~ IP
I
[ )
, J~
P
C
j
I
:,\
~
I
~' ]
Figure 2. Interface ofOMG
Ta 3. TESTING OF THE FLRB INTERFACE
This section aim at evaluating the FLRB interface whether its main purpose to assist maintenance engineers made decision is acceptable. The agreement between the behaviour of the model and that of the real tools is validated. In this study, the validation of this tool is focused on two characteristics namely user interface and tool usability. The procedure to carry out the validation is as follows:
a) Present a complete introduction of the purposes, functions and interfaces of the tool to users.
b) Demonstrate the tool to users.
c) Let users work on the tool to solve their real-world problems. d) Complete the evaluation questionnaires.
e) Review the suggestions and comments from the users.
Agr f) Analyse the data to obtain the final results of the tool evaluation.
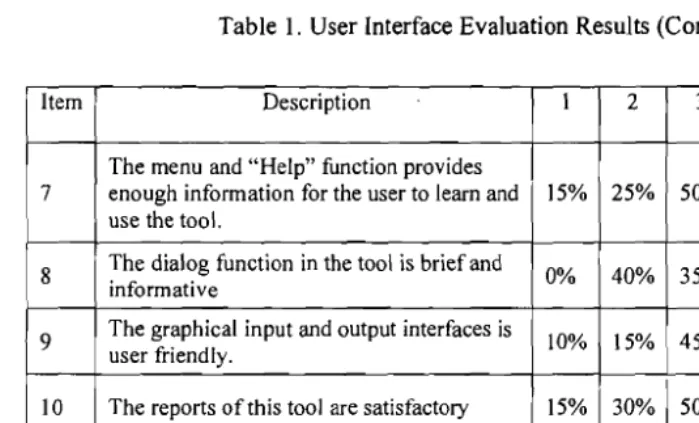
3.1 User Interface Evaluation
The user interface evaluation in Table 1 contains eleven items to evaluate level of the effectiveness and efficiency of the interfaces of the tool.
Table 1. User Interface Evaluation Results
Item Description I 2 3 4 5 6
I This tool provides enough information for
the user to learn how to use it. 0% 60% 25% 15% 0% 0%
2 The terminology in this tool is easy to
understand. 5% 40% 35% 15% 5% 0%
3
This tool provides an effective means for the user to understand the problem recognition techniques.
10% 50% 30% 10% 0% 0%
4
This tool provides an effective means for the user to collect and analyse the fault data
15% 50% 25% 10% 0% 0%
5 The "Editors" in the tool provide easy ways
for the user to utilise the tool ability 10% 35% 35% 15% 5% 0%
6 The tool provides an effective means for
the user to assist them make decision 15% 15% 45% 25% 0% 0%
- user perception
Jilid 20, Bit. 4 (Disember 2008) Jumal Teknologi Maklumat
Table I. User Interface Evaluation Results (Cont.')
Item Description I 2 3 4 5 6
7
The menu and "Help" function provides enough information for the user to learn and use the tool.
15% 25% 50% 10% 0% 0%
8 The dialog function in the tool is brief and
informative 0% 40% 35% 15% 10% 0%
9 The graphical input and output interfaces is
user friendly. 10% 15% 45% 20% 10% 0%
10 The reports of this tool are satisfactory 15% 30% 50% 5% 0% 0%
II The speed of processing during using the
tool is satisfactory. 10% 30% 30% 15% 15% 0%
Evaluation scale level reference:
Strongly Agree
Agree Sort of Agree
Sort of Disagree
Disagree
1 2 3 4 5
Strongly Disagree
6
Twenty theoretical engineers (lecturers) in Engineering Faculties of the Universiti Teknikal
Malaysia Melaka (UTeM) and twenty experts from several POM companies participated in
this survey. The results as shown in Table I are generally satisfactory. Most of the items
received good scores except item 9 and II had a relatively low score due to the lack of chart
and graphical output displays and the speed of processing when calling other applications
respectively.
3.2 Usability Evaluation
Tool usability evaluation measures the tool functionality and users' satisfaction. In this study,
a method proposed by [8] has been used for quantifying tool usability. In this method, the
tool performance variables and user perception variables need to be specified. The method is
.briefly described as follows:
Let ~- user perception variable and
Qk -tool performance variable.
Then the usability variable (U) can be expressed as
m n
(l.l)
U
=~>iSj
+
~)kOk
1=\ k=1
Jilid 20, Bi1.4 (Disember 2008) Jurnal Teknologi Maklumat
Where m and ajare the number and coefficient of user perception variables respectively, n and
b, are the number and coefficient of tool performance variables respectively, and
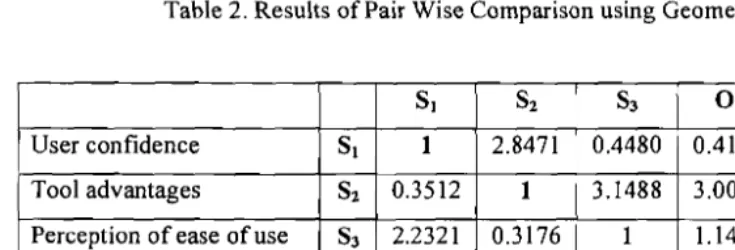
Three variables S}, S2 and S, regarding the user perception are defined as follows:
S, : Variable of user confidence,
S2 : Variable of user perception of the tool advantage as maintenance problem recognition tool,
S, : Variable of user perception of ease of use of the tool.
Similarly, three variables 0/, O2 and OJ associated with the tool performance are defined as
follows:
0 1 : Variable of accuracy of tool performance,
O2 : Variable of completeness of the tool,
0 3 : Variable of interface performance.
Saaty and Kearns [10] proposed a method of Analytic Hierarchy Process (AHP) which can determine the coefficients a, and b, of the usability function. In Saaty's method, parity
checking is used to express the relative importance of the function variables. The same participants as in Section 3.1 are involved in the evaluation because of they have engineering or decision support background and experienced in using expert system. Tables 2 and Table 3 show the results using geometric and arithmetic mean respectively of the pair wise comparison between the tool usability variables.
Based on these two tables the coefficient of function variables are calculated and the results are
Table 2.1
058j ,Ok 51,
»<«,».
51, (1.2)m n
~>j
+
Ib
k =1j=1 k~1
Table 3.1
,ompleteness ofto( terface performan
8 1 0.1317 8 2 0.2370
8 J 0.1561
01 0.2147
O2 0.1982
OJ 0.0932
d
Table 2. Results of Pair Wise Comparison using Geometric Mean
81 82 83 0 1
O
2 0 3User confidence 81 1 2.8471 0.4480 0.4155 0.4302 1.1722
Tool advantages 82 0.3512 1 3.1488 3.0078 1.1487 2.2914
Perception of ease of use 83 2.2321 0.3176 1 1.1487 0.4215 2.8064
Accuracy of results 0 1 2.4067 0.3325 0.8705 1 2.8230 2.9054
Completeness of tool
O
2 2.3245 0.8705 2.3725 0.3542 1 2.8471Interface performance 0 3 0.8531 0.4364 0.3563 0.3442 0.3512 1
Table 3. Results of Pair Wise Comparison using Arithmetic Mean
h
SI 82 83 0 1
O
2 0 3User confidence 81 I 2.9000 0.4583 0.4292 0.4417 1.2500
Tool advantages 82 0.3448 1 3.2000 3.0500 1.2000 2.3500
Perception of ease of use 83 2.1820 0.3125 1 1.2000 0.4333 2.8500
Accuracy of results 0 1 2.3299 0.3279 0.8333 1 2.8500 2.9500
Completeness of tool
O
2 2.2640 0.8333 2.3079 0.3509 1 2.9000Interface performance 0 3 0.8000 2.3079 0.3509 0.3390 0.3448 1
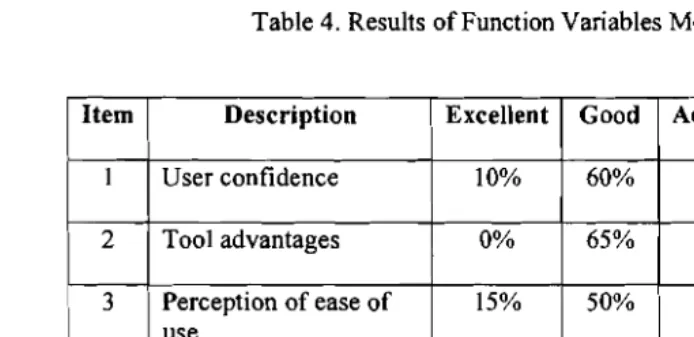
The values of the six variables are determined by means of a questionnaire and the same participants are participated in the survey. The items and results of the survey are shown in Table 4.
of the feature
Table 4. Results of Function Variables Measurements
Item Description Excellent Good Acceptable Fair Poor
I User confidence 10% 60% 30% 0% 0%
2 Tool advantages 0% 65% 35% 0% 0%
3 Perception of ease of use
15% 50% 25% 10% 0%
4 Accuracy of results 15% 55% 30% 0% 0%
5 Completeness of tool 10% 50% 40% 0% 0%
6 Interface performance 15% 50% 35% 0% 0%
Hypothe: features 1
Hypothe: than non
n participants f
leting two data c Evaluation scale level reference:
.mber 2006 to 31
Excellent Good Fair Poor
2
5 4
The usability function can be written as
e differences in
m n
e machine behai
U =
~>jSi
+
LbkOkj=1 k=1
mly divided inn
= 0.1317x SI
+
0.2370xS2+
0.1561x S3+ lcipants in each gn 0.2147x 0 1 + 0.1982x02 + 0.0932x03 e the other half of= 0.1317x 0.76 + 0.2370x 0.73 + 0.1561x 0.74+ 0.2147x 0.77 + 0.1982x 0.74 + 0.0932x 0.76
= 0.7714 icipants for each gr
This result verifies that the tool behaviour is satisfactory to the user. But the validation
'~
. In the pre-test obs result reveals that the tool contains limitations.
3.3 Statistical Test
Once the tool is validated, the next step is to determine whether the too! is capable of achieving its purpose. As FLRB tool success was predefined as facilitating the maintenance policy decision making, the general hypothesis is initiated by the dependent variables of the
number of the features investigated (Hypothesis One) and the time to reach a decision (Hypothesis Two). The general and test hypotheses are:
• General Hypothesis. The proposed prototype FLRB tool will significantly facilitate maintenance engineers' decisions during the maintenance policy decision making. o Hypothesis One. FLRB tool-assisted users will consider a greater number of
features than non FLRB tool-assisted users.
o Hypothesis Two. FLRB tool-assisted users will take less time to make decision than non-FLRB tool-assisted users.
The testing was conducted in KSUB office. The FLRB tool program was installed and tested on 4 computer tools on I June 2007. The experimenting tool setups were equipped at least with a 1.73-gigahertz Intel's Celeron processor with a 512-megabytes memory. An
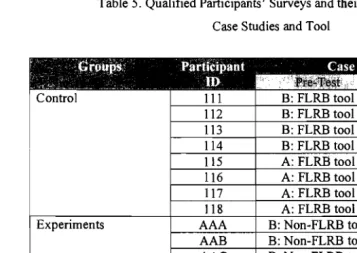
introductory session was conducted on 2 June 2007. The testing process started with a hands on demonstration of the tool, using a data collected from 1 August 2005 to 30 September 2005. The evaluation experiment was conducted during the same session (2 June 2007). Sixteen participants from the department of maintenance participated in the study by completing two data collected from 1 August 2006 to 30 September 2006 (case A) and 1 November 2006 to 31 December 2006 (case B). These participants varied from engineers to general workers who are involved in maintenance.
Although the two period of data collection selected for the experiment are equally compatible in work amount because the production operated for 24 hours daily, there might be some differences in the nature of the cases. This is due to the uncontrolled and unpredicted of the machine behaviour during the production process. The sixteen participants were randomly divided into two groups, the control and the experiment groups. Half of the participants in each group were randomly assigned to the case A-then-B experiment scheme, while the other half of each group was assigned to the case B-then-A experiment scheme in order to minimise impacts caused by differences on the case studies' nature. Due to lack of computers, the session will be divided into four sessions where each session consists of two participants for each group.
In the pre-test observation, participants in the control group had access to FLRB tool, while those in the experiment group had access to the existing Matlab Fuzzy Logic Toolbox (non-FLRB tool). All participants had access to FLRB tool during the post-test observation. The data set comprises eight survey responses from the control group and eight survey responses from the experiment group. These qualified participants along with their corresponding pre-organised case sequences and required tools are summarised in Table 5.
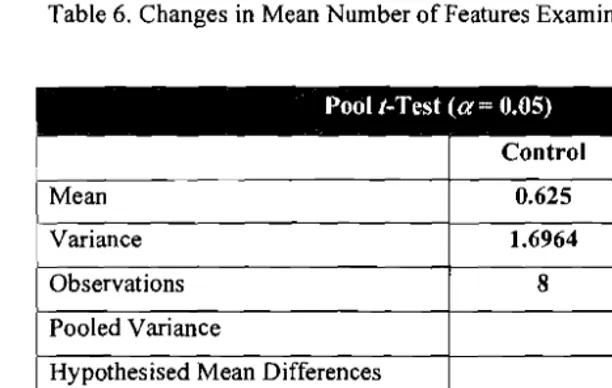
The test was run to find out whether the null hypothesis (,u.ontrol - ,LIexperiment :::: Do) could be
rejected. The hypothesis is
Ho: Changes in the mean number of features examined in the experiment
group are not more than those in the control group.
HA: Changes in the mean number offeatures examined in the experiment
group are more than those in the control group.
The null hypothesis would be rejected if the t-statistic value is equal to or smaller than the negative t-critical value of (t-statistic S; -tao.os), Table 6 presents a summary table of the pool t
test. It indicates a t-statistic of -7.1049, which is less than the negative t-critical value of 1.761 for a 95% confidence level. The level of significance p-value is reported at 0.0000. Therefore, the null hypothesis was rejected. This indicates a significant difference in number of features examined.
participants, ough the case FLRB tool. TI
C I-Critical one
B: FLRB tool B: FLRB tool B: FLRB tool B: FLRB tool
B: FLRB tool B: FLRB tool
B: FLRB tool
B: FLRB tool A: FLRB tool
A: FLRB tool A: FLRB tool A: FLRB tool A: FLRB tool A: FLRB tool A: FLRB tool A: FLRB tool
Jumal Teknologi Maklumat B: FLRB tool
B: FLRB tool B: FLRB tool
A: FLRB tool A: FLRB tool A: FLRB tool A: FLRB tool
Legend Case-A-then-B Grou Case-B-then-A Grou B: Non-FLRB tool
A: Non-FLRB tool B: Non-FLRB tool
B: Non-FLRB tool B: Non-FLRB tool
A: Non-FLRB tool A: Non-FLRB tool
A: Non-FLRB tool 116 118
•
III 117 112 114 115 113 AAC AAB AAE AAF AAG AAH AAA AADTable 5. Qualified Participants' Surveys and their Corresponding Case Studies and Tool
Experiments Control
Table 6. Changes in Mean Number of Features Examined - All Participants
Pool r-Test (a= 0.05)
Control Ei;perjfit~n.t 0.625 4.625 Mean
Variance 1.6964 0.8393
Observations 8 8
Pooled Variance 1.126 Hypothesised Mean Differences 0
14
Degree of freedom (d/)
r-Statistlc -7.1049
0.0000
nrs
I) one-tailr-Critical one-tail 1.761
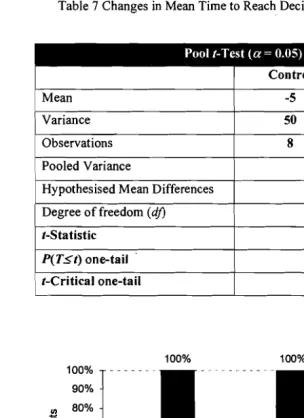
A plausible reason for the control group's decreased mean time to reach decisions in the two experiments can be explained by a maturation effect resulting from increased efficiency. For these participants, the post-test experiment was the second analysis utilising the same tool. Although the case situation was different, participants were expected to be more familiar with the FLRB tool. To determine if the decrease is statistically significant, a pool r-test was conducted. The test was aimed to examine whether the null hypothesis (,u.,ontrol - Pexperiment S Do) could be rejected. The null hypothesis will be rejected if the r-statistic value is equal to or higher than the t-critical value of (r-statistic ~t« 005). The hypothesis is
Ho: Changes the mean time to reach decisions in the experiment
group is not more than in the control group.
HA: Changes the mean time to reach decisions in the experiment
group is more than in the control group.
Table 7 below presents a summary table of the pool t-test. It indicates a r-statistic of 5.1184, which is greater than the r-critical value of 1.761 for a 95% confidence level. The level of significance p-value is reported at 0.0001. Therefore, the null hypothesis was rejected. This indicates a significant difference in time to reach decisions.
Table 7 Changes in Mean Time to Reach Decisions - All Participants
Pool r-Test (a= 0.05)
Control Experiment
Mean -20.625
Variance
-5
50 24.5536
Observations 8 8
Pooled Variance 37.2768 Hypothesised Mean Differences 0 Degree of freedom (dj) 14
r-Sta tistic 5.1184
P(T5t) one-tail 0.0001 r-Critical one-tail 1.761
contribute
Increase Features Decrease Time Both
o Control Group • Experiment Group
Figure 3. Result Summary - Hypothesis I and II - Graphic Comparisons
The hypothesis one aims to find whether FLRB tool has an impact on enhancing users' comprehensiveness of the decision context by increasing the number of features examined.
of Quality According to Figure 3, the result indicates that all participants (100%) in the experiment
group reported an increase in the number of features examined, as compared to a 62.5% of participants in the control group.
100% 100% 100%
100%
90%
IJl 80% C
70%
cu c
·0 60%
'E cu Q..
50%
01
c
.~ 40%
:2
30%
0
-c
20%10%
0%
In other dimension, decreases in time to reach decisions are discovered in a 100% of participants in the experiment group versus a 50% of participants in the control group. Interestingly, in control group, both increase features and decrease time calculated about 37.5% while in experiment group shows a 100% participants.
4. CONCLUSION AND FUTURE WORK
This paper proposed a practical and user friendly interface for fuzzy logic rule based (FLRB) system for maintenance policy decision making. According to the statistical result, the FLRB tool significantly enhances comprehensiveness of decision context by increasing the number of features examined, regardless of situations' difficulty. The FLRB tool also significantly contributes to the efficiency of decision-making process by reducing decision makers' time to reach decisions. However, the results also indicate that the decrease in time to reach decisions varies according to situations difficulty. A further study is needed to bridge the problems regarding to the situations difficulty. Users also indicate that the tool contains some limitations. The limitations include, the tool only offer facilitation based on one user for each analysis, while in the real world case, the decision making is made by more than one person. A group decision making interface should be considered in future works. The tools also offers only maximum nine rules whereas the fuzzy approach accuracy will offer better result when more rules provided. An extensive study should be conducted to determine the suitable rules for improving its accuracy.
REFERENCES
[I] Bowen, J., "Formal Specification of User Interface Design Guidelines," Msc Thesis, University ofWaikato, New Zealand, 2005.
[2] Bowen, 1. and Reeves, S., "Formal Models for Informal GUI Designs," Electronic Notes in Theoretical Computer Science, Vol. 183, pp. 57 -72,2007.
[3] Bowen, J. and Reeves, S., "Refinement for User Interface Designs," Electronic Notes in Theoretical Computer Science, Vol. 208, pp. 5 - 22, 2008.
[4] Fernandez, 0., Labib, A.W., Walmisley, R. and Petty, D.J., "A Decision Support Maintenance Management System: Development and Implementation", International Journal of Quality & Reliability Management, Vol. 20, No.8, pp.965-79, 2003.
[5] Labib, A.W., "A Decision Analysis Model for Maintenance Policy Selection using a .
Ho
CMMS," Journal of Quality in Maintenance Engineering, Vol. 10, pp. 191 - 202,2004.
[6] LaVelle, C. and Konrad, A., "FriendlyRoboCopy: A GUI to RoboCopy for Computer Forensic Investigators," Digital Investigation, Vol. 4, pp. 16-23,2007.
[7] Mechefske, C,K., Wang, Z., "Using Fuzzy Linguistics to Select Optimum Maintenance and Condition Monitoring Strategies," Mechanical Systems and Signal Processing, Vol. 17, No.2, pp.305-16, 2003.
[8] Mitta, D.A., "A Methodology for Quantifying Expert System Usability," Human Factors, Vol. 33, pp. 233 -245,1991.
[9] Pere, L. and Koniorczyk, M., "A Universal Fast Graphical User Interface Building Tool for Arbitrary Interpreters," Journal of Visual Languages and Computing, Vol. 16, pp. 231 - 244,2005.
[10] Saaty, T.L. and Keams, K.P, "Analytical Planning," New York: Pergamon Press. 1985. [11]Shneiderman, B., "Designing the User Interface Strategies for Effective Human
Computer Interaction," 3'd ed., California: Addison-Wesley, 1998.
[12]Spreitzhofer,G., Fierz, C. and Lehning, M., "SN_GUI: A Graphical User Interface for Snowpack Modeling," Computers and Geosciences, Vol. 30, pp. 809 - 816, 2004. [13]Zadeh, L.A., "Fuzzy Sets," Information and Control, 8, pp. 338-353, 1965.