ABSTRACT
VOLLMER, EMILY RENÉE. Cover Crop Mulches for No-till Organically Managed Onion Production. (Under the direction of Nancy Creamer.)
Combining the environmentally sound practices of reduced tillage and cover crop use with organic vegetable production systems requires management choices that are tailored to specific climate and crop combinations. In the southeastern U.S. summer cover crops can be grown through the fall until desiccation by frost. At this time a cash crop such as bulb onions (Allium cepa L.) can be grown using reduced tillage for over winter production. Field experiments were conducted on first year transitional (non-organic) land in 2006-07 and 2007-08. Cover crops of foxtail millet ‘German Strain R’ [Setaria italica (L.) Beauv.] and cowpea ‘Iron & Clay’ [Vigna unguiculata (L.) Walp.] were grown as monocrops (MIL, COW) and biculture mixtures and compared to a bare ground control (BG). Mixtures of cowpea and millet consisted of seeding rates aimed at producing 70%, 50%, and 30% millet per total biculture biomass (MIX-70, MIX-50, MIX-30). Cover crop residue treatments were evaluated for weed suppression and N contribution to no-till organic onion production. Supplemental N in the form of surface applied soybean meal [Glycine max (L.) Merrill] was applied to cover crop treatment subplots at three rates: 0, 105, and 210 kg N·ha-1. Onion yields increased linearly from 0 to 210 kg N·ha-1 rates of soybean meal. Cover crop
2007-08 was highest on MIL compared to all other cover crop treatments but remained below 20%. Weed interference during onion production was highest in COW and lowest in
treatments with millet (MIL, MIX) in 2006-07. Nitrogen rates of 105 and 210 kg N·ha-1 increased soil mineral N (NO3- and NH4+) on BG plots two weeks after surface application of
Cover Crop Mulches for No-till Organically Managed Onion Production
by
Emily R. Vollmer
A thesis submitted to the Graduate Faculty of North Carolina State University
In partial fulfillment of the Requirements for the degree of
Master of Science
Horticultural Science
Raleigh, North Carolina 2008
APPROVED BY:
_______________________________ ______________________________
Chris Reberg-Horton Greg Hoyt
________________________________ Nancy Creamer
BIOGRAPHY
One of my earliest memories is of a field covered in yellow flowers sloping down to my right and glowing in gleeful sunlight. I asked what they were – buttercups my mother told me.
Each of the places I have lived has given me glowing gems and little lessons. Raleigh has been no exception.
I was born in the Shenandoah Valley of Virginia and grew up in the Pacific
Northwest. Oregon is where I call home, though I’ve been afield for nine years now… In 1999 I volunteered at a mixed vegetable farm outside of Portland, Oregon. It was my first experience on a working farm and proved to be a fabulous coalescence of my love of the outdoors, plants and fresh food. From there I traveled across the ocean to spend a year in the Netherlands, learning Dutch, how to milk a cow, harvest Alstroemerias, and lay paving stones. I returned to the states to attend Cornell University for a degree in Plant Science. At Cornell I completed a senior honors thesis on organic apple production (and ate a whole lot of apples). I ventured to the mountains of Vermont, the coast of Maine and southern stretch of Maryland to work on organic vegetable farms. I then whisked myself off to a winter job leading kids through the trails of a nature preserve in Ohio...
ACKNOWLEDGMENTS
To every single person who has touched my life here in Raleigh, North Carolina I send you my gratitude.
Nancy Creamer, I so appreciate the opportunities and experiences that you steered my way; you were my staunch supporter through every major task, thoughtful and generous. Ken Fager, my mentor in carrying out this project that was in large part yours to begin with; “master Yoda” as Steve would say, I carry many a lesson from days in the field. Chris Reberg-Horton, I thank you for your patience and practicality. Greg Hoyt, your stories and good humor were always welcome and enjoyed. I think very highly of each and every one of you, and have benefited greatly from your support.
This project was brought into being at the Center for Environmental Farming Systems in Goldsboro, NC where I extend gracious thanks to Steve Moore, Brad Hardison, Toby Grimes, Rodney Mozingo, Ivy Lanier, Wayne Smith, and the helping hands of apprentices and interns, and others including Melissa Bell and Carrie Brinton who got roped in to helping on more than one occasion.
I am also grateful for the financial contributions sponsored by NC Beautiful in the form of a Dan K. Moore Graduate Fellowship, and by Southern Region SARE in the form of a
TABLE OF CONTENTS
LIST OF TABLES ... vi
LIST OF FIGURES ... viii
COVER CROP MULCHES FOR NO
-
TILL ORGANICALLY MANAGED ONION PRODUCTION Introduction ... 1Materials and Methods ... 7
Site description ... 7
Experimental design ... 8
Cover crop management ... 8
Onion production ... 10
Data collection ... 12
Cover crop stand-counts, biomass and nitrogen ... 12
Soil sampling ... 13
Weed evaluation ... 13
Onion yield ... 14
Weedy plot areas ... 15
Statistical analysis ... 15
Results and Discussion ... 16
Weather ... 16
Cover crop and weed biomass at cover crop maturity ... 16
Soil N ... 18
Weed evaluations ... 21
Onion mortality ... 24
Onion yield ... 26
Conclusions ... 29
References ... 32
LIST OF TABLES
COVER CROP MULCHES FOR NO
-
TILL ORGANICALLY MANAGED ONION PRODUCTION Table 1. Cover crop seeding rates ... 37 Table 2. Percent weed cover rating scheme ... 37Table 3. Cover crop biomass, nitrogen and weed biomass at time of cover crop
roll-down in 2006-07 and 2007-08 ... 38
Table 4. Soil N (NH4+ + NO3-) as affected by cover crop and N rate in 2006-07
and 2007-08 ... 39 Table 5. Weed density, percent cover, and biomass prior to weeding events and
onion harvest as affected by N rate in 2006-07 and 2007-08 ... 40 Table 6. Mortality and bolting frequency, marketable large grade yield and total
bulb yield significance levels of main and interaction effects of cover crop and N rate in 2006-07 and 2007-08 ... 41 Table 7. Total marketable onion yield, total yield mean bulb weight and N
concentration of marketable bulbs as affected by cover crop and N
rate in 2006-07 and 2007-08 ... 42 Table 8. Weedy onion marketable yield, total yield, rate of mortality and bolting
as affected by cover crop and N rate in 2006-07 and 2007-08 ... 43
APPENDIX
Table 1. Cover crop seedling stand counts taken 18 and 21 days after seeding from 0.30 m lengths of four inner drill rows in each main plot (2006) or subplot (2007) for the 2006-07 and 2007-08 experiments
respectively ... 53 Table 2. Cover crop and weed biomass of all MIX treatments at time of cover
Table 4. Weeding labor in weeded subplot areas at the first and second weeding and weed biomass at time of onion harvest in weedy subplot areas as affected by cover crop and N rate in 2006-07 and 2007-08 ... 55 Table 5. Soil N in bare ground weedy (BG-w) treatments ... 55 Table 6. Onion weight and count by size grades (small, medium, large) as
affected by cover crop and N rate in 2006-07 and 2007-08 ... 56 Table 7. Bolted onion total weight and count in 2006-07, weight and count by
LIST OF FIGURES
COVER CROP MULCHES FOR NO
-
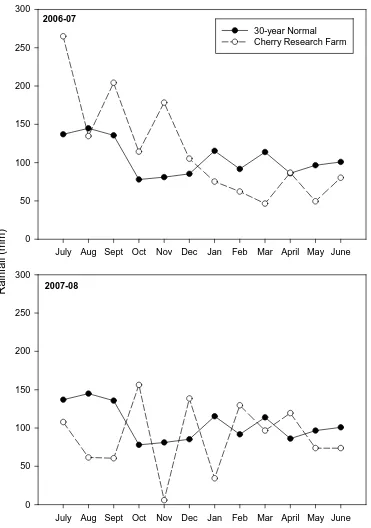
TILL ORGANICALLY MANAGED ONION PRODUCTION Figure 1. Monthly rainfall at Goldsboro, NC ... 44 Figure 2. Soil N (NH4+ + NO3-) of BG (bare ground treatment) by N rates 0, 105,210 kg N·ha-1 of soybean meal at 0-15 cm and 15-30 cm depths
across 2006-07 sampling dates ... 45 Figure 3. Soil N (NH4+ + NO3-) of BG (bare ground treatment) by N rates 0, 105,
210 kg N·ha-1 of soybean meal at 0-15 cm and 15-30 cm depths
across 2007-08 sampling dates ... 46 Figure 4. Weed density at the first weeding (15 Jan. 2007, 10 Jan. 2008) and a
second weeding (22 Mar. 2007, 15 Apr. 2008) as affected by cover
crops in 2006-07 and 2007-08 respectively ... 47 Figure 5. Percent weedy ground cover at the first weeding (15 Jan. 2007 and 10
Jan. 2008) and second weeding (22 Mar. 2007 and 15 Apr. 2008) as
affected by cover crop in 2006-07 and 2007-08 respectively ... 48 Figure 6. Weed biomass at onion harvest (18 May 2007) the second weeding (15
Apr. 2008) as affected by cover crop in 2006-07 and 2007-08
respectively ... 49 Figure 7. Mortality and bolting frequency as affected by cover crop treatments
across N rates 0, 105, 210 kg N·ha-1 in 2006-07 and 2007-08 ... 50 Figure 8. Marketable large grade onion and total bulb yield as affected by cover
crop across N rates 0, 105, 210 kg N·ha-1 in 2006-07 and 2007-08 ... 51
APPENDIX
Figure 1. Soil N (NH4+ and NO3-) of BG (bare ground treatment) by N rates 0,
105, 210 kg N·ha-1 of soybean meal in total 0-30 cm across 2006-07 sampling dates ... 58 Figure 2. Soil N (NH4+ and NO3-) of BG (bare ground treatment) by N rates 0,
COVER CROP MULCHES FOR NO
-
TILL ORGANICALLY MANAGED ONION PRODUCTIONIntroduction
Environmentally sound vegetable production practices promote soil tilth, water quality and agroecological balance. Sustainability is a guiding principle in organic agriculture as well as an appropriate management goal for non-organic production. Conservation tillage practices promote soil quality and fertility in accordance with organic principles (Peigné et al., 2007). Peigné et al. (2007) emphasized that success of conservation tillage in organic systems is highly influenced by management of crop rotation for weed and disease control, and nitrogen availability. Cover crops utilized in rotation with cash crops require additional management but in turn cover crops can contribute multiple services that enhance cash crop yields and reduce negative environmental impacts (Cherr et al., 2006a; Lu et al., 2000). Specific cover crop services include: N contribution to subsequent crop; weed, disease, or pest suppression; reduction of topsoil and agrochemical runoff; increase in soil organic matter; and scavenging residual N following shallow rooted crops (Cherr et al., 2006a). Selection of cover crop species suitable for the crop rotation, climate and specific desirable services is important for integration into diverse farming systems. In the southeast U.S. heat tolerant cover crops can be grown between spring and fall vegetable production (Creamer and Baldwin, 2000).
disturbance is localized to the area where seed or transplant placement occurs. Advantages of conservation tillage include improved soil physical, biological, and chemical properties, higher soil moisture and water infiltration, and reduced topsoil loss compared to conventional tillage (Johnson and Hoyt, 1999). In conservation tillage, surface residues are generally unharvested crop remains or cover crops that were killed with herbicides or mechanical methods (the later in an organic system) (Creamer and Dabney, 2002). Frost kill of certain cover crops is an organic option that could circumvent cover crop regrowth problems since mechanical kill techniques are highly dependent on plant growth stage (Ashford and Reeves, 2003).
Conservation tillage practices have been more readily adopted in agronomic row crops than vegetable production. In the southeastern U.S. the most common conservation tillage practice is soybean planted into winter wheat stubble. Reduced tillage vegetable production studies have focused on winter cover crops followed by spring planted cash crops. Implementing conservation tillage in short season vegetable systems can be problematic because of cooler soil temperatures delaying harvest (Hoyt, 1999). However, studies
comparing conservation tillage to conventional tillage vegetable production have found crop yield that was greater or equivalent with potato (Carrera et al., 2005; Mundy et al., 1999), equivalent with cabbage (Mochizuki et al., 2007), tomato (Herrero et al., 2001; Stirzaker et al., 1993a), and pumpkins or watermelons (Rutledge, 1999) and equivalent or less with tomato (Yaffa et al., 2000), and bell pepper (Abdul-Baki et al., 1999) due to specific
was sufficient to overcome limitations to crop yield compared to production with
conventional tillage. Stirzaker et al. (1993a) found that reduced vegetative growth on no-till versus conventional tillage grown tomatoes did not correspond to reduced fruit yield. Similar reduction in vegetative growth was seen with no-till lettuce without surface mulch, but where no-till lettuce followed a winter cover crop, lettuce yields were equivalent with tilled
treatments (Stirzaker et al., 1993b).
Use of summer cover crops for no-till fall cropping is an option in climates warm enough for a fall production season. No-till vegetable production following a summer cover crop compared to tilled bare ground resulted in higher or equivalent yield for lettuce (Wang et al., 2008) and broccoli (Abdul-Baki et al., 1997a). Wang et al. (2008) also compared organic and conventional management systems over a five year period and found organically grown lettuce had lower yields the first two years but equivalent or greater yields in the subsequent three years compared to conventional chemical culture.
Legume and grass cover crops provide different benefits to subsequent cash crops. Legumes fix atmospheric N and generally have a tissue C:N ratio favorable to rapid decomposition and N mineralization compared to a grass (Creamer and Baldwin, 2000). Grass mulch or residue is more suited to provide physical weed suppression since it
decomposes more slowly, but it may also cause N immobilization that would aversely affect a subsequent cash crop. In a comparison of soil incorporated summer cover crops,
yet decomposition of the residues contributed to yield of the spring crop. A useful strategy to avoid N tie-up is to add another N source to a grass cover crop.
Legume cover crops can provide some or all of the N required for crop production. A meta-analysis comparing N supplied by fertilizers on bare ground versus legumes grown with no additional N fertilizer found that if the legume biomass was sufficient (containing at least 110 kg N ha-1) then there was no significant difference in crop yield between the two
strategies (Tonitto et al., 2006). However, legume cover crops may need additional N for optimal vegetable crop yield (Abdul-Baki et al., 1997b) especially in warm temperate environments (Cherr et al., 2006b).
Supplemental N applications can be used to address the challenge of coordinating timing of N mineralization of plant residues to meet crop demand. Supplemental N sources for organic growers are often manure based, which can lead to soil P loading with overuse. Legume seed meals have relatively high N content which makes them suitable candidates for organic N fertility sources (Müller and von Fragstein und Niemsdorff, 2006; Stadler et al., 2006). Soybean meal is the byproduct of soybeans [Glycine max (L.) Merrill] pressed for oil and is a relatively concentrated source of nitrogen (7% N) that can be utilized as an organic fertilizer (Gaskell and Smith, 2007). Extracts of soybean meal digested with bacteria promoted plant and root growth of vegetable seedlings (Hasegawa et al., 2002) and
appropriate rates of soybean meal increased yield of broccoli and pepper (Brown, 2004) but there is very little published information on the use of soybean meal as N fertilizer for crops.
production compared to their respective monocultures (Sainju et al., 2005). When compared to a legume monocrop, grass-legume mixtures can provide equivalent N release while improving N-use efficiency of a subsequent crop by moderating the release of cover crop N (Ranells and Wagger, 1997a; 1997b). Surface residues of grass-legume mixtures improved weed control compared to the legume monocrop in the form of reduced weed emergence without the use of herbicides (Teasdale and Abdul-Baki, 1998). The relative composition of grass to legume in mixtures can influence influences the overall N content and C:N ratio of the residue (Ranells and Wagger, 1997b) and therefore mixture composition could influence the effect of the cover crop residue on a subsequent crop.
Cover crop residues can contribute to weed suppression but additional weed control is often necessary. Weed control was insufficient in organic no-till pepper production using a flail mowed legume as a mulch (Chellemi and Rosskopf, 2004) or flail mowed grass
monocrop and grass-legume mixtures compared to mechanical cultivation (Díaz-Pérez et al., 2008). However, in no-till desert production of bell pepper a cowpea surface residue
treatment, with or without hand weeding, had higher fruit yield than bare ground treatments and provided sufficient season long weed control (Hutchinson and McGiffen, 2000). A dense uniform mulch of in-situ subterranean clover provided good weed control for a subsequent lettuce crop (Stirzaker et al., 1993a). Cover crop mixtures suppressed weeds as effectively as a herbicide controlled treatment for no-till tomatoes four weeks after
transplanting (Herrero et al., 2001). Creamer et al. (1996a) reported season long weed
correlation between mulch biomass (e.g., cover crop residue mulch) and weed suppression, and attributed increased weed control to physical properties of the mulch on the soil surface.
Weed management in no-till organic vegetable production necessitates a multi-strategy approach in order to be effective. No-till broccoli yield was equivalent for cover crop residue treatments with and without herbicide application despite differences in weed biomass during broccoli production (Abdul-Baki et al., 1997a). Abdul-Baki et al. (1997a) attributed the maintenance of weed biomass below levels that would cause broccoli yield loss to the combination of high planting density of large, healthy transplants and reduced weed pressure during the fall season.
Bulb onions can be fall planted for over-wintered production in the southeastern U.S. In eastern North Carolina transplanting dates are from October through mid-November (Sanders, 2004). The average fall frost date for eastern North Carolina is mid or late October (Perry, 1996), which would allow for frost kill of a susceptible cover crop to correspond with onion transplanting. Warm season annual cover crops include C4 grasses such as foxtail millet [Setaria italica (L.) Beauv.] and heat adapted legumes such as cowpea ‘Iron & Clay’ [Vigna unguiculata (L.) Walp.], both of which are killed by frost and cold weather.
Winter cropping with N and weed suppression from summer cover crop residue and surface applied organic amendment N have not been thoroughly studied. Cool winter temperatures slow residue decomposition, which could enhance mulch-based weed control during a season when weed pressure is generally less, and could contribute to a prolonged period of N mineralization for cash crop uptake. This study assessed the contributions of summer annual grass and legume cover crops in different mixture ratios or monocultures and rates of soybean meal as an N amendment on over-wintered, no-till, organic onion
production.
Materials and Methods
Site description. The experiments were conducted in 2006-07 and 2007-08 at the
Center for Environmental Farming Systems, Goldsboro, NC. The soil both years was predominantly Wickham loamy sand (fine-loamy, mixed, thermic Typic Hapludults) with some area in a sandy loam: Johns (fine-loamy, siliceous, thermic Aquic Hapludults) in 2006-07 and Lynchburg (fine-loamy, siliceous, thermic Aeric Paleaquults) in 202006-07-08. Soil pH at the start of the experiment (July) was 5.9 and 5.5 in 2006-07 and 2007-08 respectively. In July 2007 lime was applied at 2.2 t·ha-1 according to North Carolina Department of
Agriculture and Consumer Services (NCDA&CS) Agronomic Division soil test
Neither site was managed for organic production prior to this experiment and therefore treatment effects can be interpreted as representing transitional organic systems. Studies have shown that crop yields under organic production are often higher after at least two years of organic management (Wang et al., 2008).
Experimental design. Cover crop treatments were grown during the summer (from
July through October) followed by no-till planted onions in the fall for over-winter
production (from November to May). The field experiment was managed according to the U.S. National Organic Program production standards (USDA Agricultural Marketing Service, 2006).
The study was a split plot randomized complete block design with six replications. Main treatment cover crop plots were divided into three fertilizer rate subplots. Cover crop treatments were: 1) foxtail millet ‘German Strain R’ (MIL), 2) cowpea ‘Iron & Clay’ (COW), 3) mixtures of millet and cowpea (three treatments), 4) a bare ground control that was
weeded (BG) and 5) a weedy bare ground control (BG-w). The three mixture treatments differed in seeding rates of millet, which were aimed at producing 70%, 50%, and 30% millet per total mixture biomass at cover crop maturity (MIX-70, MIX-50, and MIX-30). At onion planting three N rate treatments of soybean meal containing 0, 105, and 210 kg N·ha-1 were applied.
Cover crop management. Field preparations in July of each year included tillage
respectively) with a manure spreader truck at approximately 8 t·ha-1 (wet basis) according to NCDA&CS Agronomic Division soil test recommendations. Turkey litter was incorporated prior to shaping raised beds 10 cm high, 1.2 m wide on 1.9-m centers in 2006-07 and ground-level beds with the same dimensions in 2007-08. Main plots consisted of one bed 23 or 18 m long in 2006-07 and 2007-08 respectively. Each main plot was divided into three subplots along the length of the bed. Seeding rates were accomplished using pre-weighed seed amounts for each subplot or main plot in 2006-07 and 2007-08 respectively. Cover crops were seeded on bed tops in 6 rows 20 cm apart with an Almaco cone seeder model BCTSMO (Almaco, Nevada, IA) on 31 July 2006 and 19 July 2007. Seeding rates for the three MIX treatments were the same for cowpea (based on 75% of the COW monocrop rate) and differed in millet seeding rates, where the highest millet rate was 40% of the MIL monocrop rate (Table 1.). Cowpeas were inoculated with Bradyrhizobium spp. using a slurry method before planting. Cover crops were irrigated 2.5 cm with a traveling gun 19 days after seeding in 2007-08 due to drought conditions (Fig. 1).
Covers crops were flattened to the ground with a tractor mounted roller the third week of November and senesced following freezing night temperatures. Millet plants were
affected during the summer/fall growing season by foliar disease identified as Pyricularia Leaf Spot (Pyricularia grisea (Cke.) Sacc), which caused severe mortality and stunting in 2006-07. In 2007-08 Pyricularia Leaf Spot was also identified but did not develop into a severe infestation, likely due in part to drought conditions. In order to achieve cover crop treatments with comparable total biomass in 2006-07 MIL and MIX plots received
supplemental millet from an area seeded at the same time as cover crop treatments, grown and baled directly adjacent to the experimental plots. Millet additions were distributed by hand across the 1.2 m width of the bed after onion planting. In 2006 only one MIX treatment was kept per rep due to the consistently low millet biomass. One MIX plot was chosen in each rep, based on biomass samples, as those that could be adjusted to close to 50% millet (actual millet percentages: 41, 45, 48, 50, 50, 50) while minimizing differences in total biomass among MIX plots and relative to COW biomass. MIL was adjusted to the average dry tonnage on cowpea plots (4.8 t·ha-1). A scuffle hoe was used in MIL plots to kill weeds before millet additions.
Onion production. An Organic Materials Review Institute (OMRI) approved type of
potassium sulfate (K2SO4) was applied at 43 kg·ha-1 and 63 kg·ha-1 of K (based on
NCDA&CS Agronomic Division soil test recommendations for 2006-07 and 2007-08 respectively) the fourth week of October each year.
grown in a greenhouse for 8 weeks in 200-cell Speedling flats (Speedling Inc., Sun City, FL) by a contract grower in Florida. Onion seeds had been treated with thiram when obtained from the seed companies each year due to lack of availability of un-treated seed in the chosen onion variety. Onions were planted the first week of November for both 2006-07 and 2007-08 experiments (one replication in 2007-2007-08 was planted two weeks later due to an
insufficient number of transplants from the contract grower). Onion seedlings were planted three onion rows per bed 38 cm apart and 10 cm in-row spacing using a no-till transplanter. The no-till subsurface tiller-transplanter (SST-T Model 2000; B&B No-Till, Laurel Fork, VA) was utilized with modified Holland Transplanter, Model 1600 units (Holland
Transplanter Co., Holland, MI) in two sequential passes over the field – one pass for planting the center row and another pass for the outer two rows. The SST-T subsurface winged knife was not used either year because the sandy soil reduced the need for subsurface soil
loosening and it was desirable to minimize soil disturbance, which could expose additional weed seeds. Onion stands were double checked and plants inserted or adjusted as needed after mechanical transplanting in November.
(7% N, wet basis) was surface applied at 0.97 t·ha-1 and 1.9 t·ha-1 (wet weight) uniformly across the 1.2 m wide bed-top area for the 105, and 210 kg N·ha-1 treatment subplots respectively. Target N rates (105 and 210 kg·ha-1) were thus achieved on a bed-top area basis.
Each subplot had a 4.3 m length of bed that was hand-weeded twice during onion cropping while the remainder of the subplot was left un-weeded (weedy) to evaluate the weed-suppression potential of each cover crop treatment. An effort was made to minimize disturbance of cover crop residues during weeding. Weeds were uprooted and left on the bed top surface. The first weed control event was the third week of January each year and a second weeding took place the third week of March 2007 and April 2008 respectively.
Onions were irrigated as needed each year. In the 2006-07 onion season overhead sprinklers were used to apply approximately 13 mm of water 6 times between March 28 and May 15 2007. In the 2007-08 onion season a traveling gun was used to apply approximately 10 mm of water the first week of December 2007 and 30 mm the third week of April 2008.
Onions were harvested in late May each year, 205 days after transplanting.
Data collection
Cover crop stand-counts, biomass and nitrogen. Stand counts of cover crop seedlings
were taken 18 and 21 days after seeding in 2006-07 and 2007-08 respectively from 0.30 m lengths of four inner drill rows in each main plot (2006-07) or subplot (2007-08). Cover crop biomass was measured for each treatment after roll-down from a frame 0.5 m2 in 2006-07 and 1.0 m2 in 2007-08, positioned with the 81 cm width of the frame centered on the width of
weeds. All cover crop biomass was dried at 60 ºC for 48 h, weighed, ground, and analyzed for total N and C on a Perkin-Elmer 2400 CHN elemental analyzer (Perkin Elmer Corp, Norwalk, CT). In 2006, supplemental millet was sampled with a bale corer from the middle of bale ends for total N and C analysis using the same procedure.
Soil sampling. Soil nitrogen status was evaluated on three different dates relative to
onion production: pre-plant (at cover crop maturity: October), bulb initiation (March), and onion harvest (May). In 2007-08 a fourth sampling date was added mid-season (February) in an attempt to document the effect of cover crop treatments on soil N (based on visible mid-season differences in onion plat size seen the previous year). Plots without cover crop residue (BG) were sampled every two weeks after application of N rate subplots until shortly before onion harvest. Soil samples were collected with a soil probe to a depth of 30 cm and separated into two depths (0-15 cm; 15-30 cm). Each soil sample was a composite of three soil cores taken within 10 cm of each onion row. Soil samples were air-dried on greenhouse benches, fumigated with methyl bromide (to prevent spread of C. benghalensis seeds), homogenized and extracted with 1 M KCl. Extracts were analyzed for NH4+- and NO3--N
using flow injection analysis methods for colorimetric determination with a QuikChem IV (Lachat Instruments, Loveland, CO). The sum of NH4+ and NO3- is presented as total soil
inorganic N.
Weed evaluation. Weed evaluations included percent weed cover, using a modified
taken from 0.5 m2 spanning the 0.76 m between outer onion rows in 2006-07 and 3.7 m2 spanning the 1.2 m width of the bed in 2007-08. At the second weeding event in 2007-08 (April) weed biomass was also collected from the same area as weed density because overall weed density was low and might preclude the ability to distinguish treatment differences. At onion harvest weed evaluations were taken from the 1.2 m width of the bed: biomass was collected from 1.5 m2 of weed-controlled areas in 2006-07, and weed density (excluding summer annual grasses) was collected in 2007-08 instead of biomass because weeds were in seedling stage and very small.
Onion yield. Onions were harvested by hand from 3 m lengths of bed in weeded
content by frontal chromatography with a Perkin-Elmer 2400 CHN elemental analyzer (Perkin Elmer Corp, Norwalk, CT).
Weedy plot areas. Soil samples were taken in weedy subplot areas and BG-w on the
same three dates relative to onion planting (in October, March, and May) as described for weeded cover crop treatments above. At onion harvest weed biomass was collected from 0.5 m2 spanning between outer onion rows in weedy areas of each subplot and BG-w, except in 2006-07 where 1.5 m2 of BG-w was sampled. Onions were harvested by hand from the length of bed in each subplot and BG-w where weed biomass was collected (all 0.6 m except 3 m lengths of BG-w in 2006-07). These onions were trimmed, graded, counted and weighed using the same procedure as onions from weeded areas.
Statistical analysis. Data were analyzed with ANOVA using PROC GLM and PROC
MIXED [Version 9.1; Statistical Analysis Systems (SAS), 2007]. Mean comparisons were generated using Fishers protected least significant difference (P ≤ 0.05). Due to significant treatment by year interactions data were analyzed separately by year.
Results and Discussion
Weather. The 2006-07 experiment was characterized by unusually wet conditions
during cover crop production (rainfall was 200 mm greater than normal for September
through October 2006), and unusually dry conditions during spring onion production (rainfall was 180 mm below normal for January through May 2007) (Fig. 1). The 2007-08
experiment was characterized by drought conditions during cover crop growth (rainfall was 160 mm below normal in August and September 2007), and fluctuating wet and dry months during early onion production. Onion production in 2006-07 and cover crop growth in 2007-08 were affected by the 6 months from April to September 2007, which were the driest on record for North Carolina and compounded moisture deficits since January 2007 (National Climatic Data Center, 2007).
Cover crop and weed biomass at cover crop maturity. Cowpea biomass at maturity is
typically in the range of 2.8 to 5.0 t·ha-1, and cowpea ‘Iron & Clay’ grown in eastern NC had biomass of 4.0 t·ha-1 (Bowman et al., 1998; Creamer and Baldwin, 2000). Foxtail millet grown for forage produces 6.7 to 9.9 t·ha-1 biomass, and german foxtail millet grown in eastern NC had biomass of 4.6 t·ha-1 (Creamer and Baldwin, 2000; Oelke et al., 1990). In
both experiments (2006-07 and 2007-08) COW biomass was in the expected range or higher, whereas MIL biomass was low, especially in 2006-07 (Table 3). Millet biomass in 2006-07 was 2.4 t·ha-1 in the MIL treatment, and 0.3 to 1.7 t·ha-1 across all MIX plots, which
accounted for 6.8% to 38% of the total cover crop biomass in those MIX plots. Millet planted over a month earlier in the summer of 2006 (corresponding to the 2006-07
much higher (more typical) biomass up to 8.8 t·ha-1 in monoculture and 3.4 t·ha-1 in a mixture where it constituted 63% of the total biomass of millet and cowpea (seeded at rates similar to MIX-50) (K. Fager, unpublished data). In the 2007-08 experiment cover crop planting date was moved nearly two weeks earlier in order to attempt a more suitable millet seeding date for reduced disease pressure. It is also possible that higher millet stand counts in 2006-07 MIL (840 plants·m2; data not shown) compared to the earlier millet planting (450 plants·m2; K. Fager, unpublished data) contributed to the greater disease incidence.
were less than 30:1 and therefore were in the theoretical range in which net N mineralization occurs.
Few summer annual weeds were established and grew in treatments with living cover crops. As a result weed biomass at cover crop maturity was low both years. While weed biomass was lower in COW than in MIL and MIX in 2006-07, there was no cover crop treatment effect in 2007-08 (Table 3). In general the cover crops provided good weed control during their growing season, though this was probably aided in 2006-07 by flaming shortly before cover crop emergence and in 2007-08 by previous fumigation. This level of in-season weed suppression is better or comparable to that found in other studies with the same cover crop species (Abdul-Baki et al., 1997a; Creamer and Baldwin, 2000).
All three MIXes in 2006-07 were statistically equivalent in their composition of millet and cowpea biomass respectively despite the difference in millet seeding rates (data not shown). This appears to be attributed to the ability of cowpea to compensate for lack of vigor in companion millet. In 2007-08 the MIXes were distinguishable in that MIX-30 had significantly less millet than MIX-50 and MIX-70, which reflected the lower millet seeding rate in MIX-30 (Table 3). Despite the lack of statistically different millet biomass amounts among each of the three MIXes, in both years the mean biomass values reflected the millet seeding rates in order of greatest to least (MIX-70, MIX-50 and MIX-30). In general these findings show that varying seeding rates and ratios can affect final biomass ratios but not consistently.
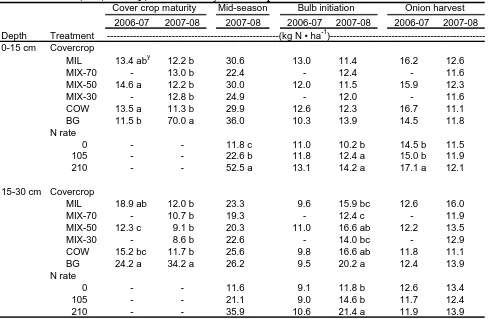
Soil N. Cover crop treatments significantly affected soil N at the time of onion
the least N in the 0-15 cm depth but had the most N in the lower 15-30 cm depth of soil. This could be attributed to residual N from turkey litter leaching to the lower depth where there was no cover crop vegetation (BG) and where the vegetation was sparse (MIL). At cover crop maturity in 2007-08, BG had the most N in both 0-15 and 15-30 cm depths compared to all other cover crop treatments. The high levels of N (primarily NO3-) on BG in
2007-08 could be attributed in part to less NO3- leaching through the soil profile below 30 cm
because of unusually low rainfall in the summer of 2007. In both years turkey litter was field applied prior to cover crop planting and therefore N was also applied on BG plots, which did not have a cover crop that would take up soil N.
The stage of onion growth with the highest rate of plant N uptake is bulb formation (Sargent et al., 2001). Bulb growth begins in response to increased daylength in the spring (due to photoperiod requirements and other factors) and in the southeast U.S. occurs around March. There was no significant cover crop treatment effect in the 0-15 cm depth at the March bulb initiation sampling date either year, but the 15-30 cm depth in 2007-08 did have the greatest soil N in MIX-50, COW and BG treatments (Table 4). An earlier (mid-season) sampling date in early February was added in 2007-08 to evaluate soil N status before further cover crop residue decomposition but did not show a significant cover crop effect on soil N. There was also no cover crop effect on soil N at onion harvest either year.
two weeks post soybean meal application in 2006-07 there was also a significant N rate effect on soil N at the 15-30 cm depth, whereas in 2007-08 lower depth significant
differences weren’t apparent until eight weeks after application (late January). Soybean meal application (105, and 210 kg N·ha-1) increased soil N compared to the 0 N treatment for the duration of at least two months in 2006-07 and nearly three months in 2007-08 (through late February 2008). In March 2008, the 210 kg N·ha-1 rate continued to have numerically higher soil N in the 15-30 cm depth than the 0 and 105 kg N·ha-1 rates but the amount of variation in soil N precluded significant differences on BG alone. However, the late March 2008 soil sampling across all cover crops did show a significant N rate effect on soil N in both depths in 2007-08 (Table 4).
The increased soil N in the 15-30 cm depth in January and February where soybean meal was applied (105, and 210 kg N·ha-1) indicates that N was moving though the soil horizon from surface applied soybean meal. Onion plants were still small at this time and therefore N from soybean meal mineralization was likely being leached below the shallow onion root zone, especially in the 210 kg N·ha-1 treatment. Peak mean soil N with the 210 kg N·ha-1 treatment on BG was measured at over 60 and 100 kg N·ha-1 greater than in the 0 N
rate for 2006-07 and 2007-08 respectively (Fig. 2 and 3). At the same peak of soil N in late December and early January (2006-07 and 2007-08), the increase in soil N from soybean meal fertilizer above the 0 N rate was about half as great in the 105 kg N·ha-1 rate as it was in the 210 kg N·ha-1 rate. Recommended N application at planting for bulb onion production is 56 to 84 kg N·ha-1 with an additional 28 to 56 kg N·ha-1 sidedress at least a month after
spring (Sanders, 2004). On the three sampling dates following soybean meal application in 2006-07 (spanning seven weeks) the 105 kg N·ha-1 treatment had a sum of 62 kg·ha-1 more soil N than the 0 N rate in the 0-15 cm depth alone (Fig. 2). This suggests that the 105 kg N·ha-1 rate of soybean meal was more than sufficient as a starter fertilizer for early season onion growth.
Late in the onion production season there were a couple sampling dates where N rate had a significant effect on soil N. In 2006-07 the 210 kg N·ha-1 treatment had greater soil N than the 105 kg N·ha-1 treatment in the 0-15 cm depth on BG in late April (Fig. 2) and just prior to onion harvest when considered across all cover crop treatments (Table 4). In 2007-08 the 210 kg N·ha-1 treatment had greater soil N than the 0 N rate in the 15-30 cm depth on BG in late May (Fig. 3). This suggests that additional N was being mineralized from remaining soybean meal over time and was perhaps aided by warmer temperatures in late spring.
Weed evaluations. The first weeding event occurred 2.5 months after onion
transplanting each year. In 2006-07 the predominant weeds were henbit (Lamium
amplexicaule L.) and cutleaf evening primrose (Oenothera laciniata Hill). In January 2007
(1st weeding in the 2006-07 experiment) the greatest weed interference was in COW, which had high weed density and the highest percent weed cover (Fig. 4 and 5). BG had high weed density equivalent with COW but had lower percent weed cover. At that time weed
interference was also greater in treatments where soybean meal had been applied (105, and 210 kg N·ha-1), which had greater percent weed cover compared to the 0 N rate despite lower
through 15 Jan. 2006-07) showed that soybean meal application (105, and 210 kg N·ha-1) had significantly greater soil N than the 0 N rate (Fig. 2). This suggests that N was being
mineralized from soybean meal and cowpea residue in the months of December and January and was contributing to weed growth. Also in January 2007, treatments that had millet (MIX, MIL) had low weed density and percent weed cover. MIX and MIL treatments had more residue remaining on the soil surface than COW in mid-January by which time onion mortality and stunting in MIX and MIL treatments was readily apparent compared to COW. Weed suppression could be attributed to physical cover or allelopathy (addressed further in onion mortality below).
By March 2007 (2nd weeding in the 2006-07 experiment) weed density and percent weed cover were not different among cover crop treatments, but there was a significant N rate effect and a significant interaction between cover crop and N rate (Table 5). The significant treatment interaction was such that all cover crop treatments had higher weed density at the 0 N rate than the 105, and 210 kg N·ha-1 rates, but COW and BG had higher densities compared to MIX and MIL at both 105, and 210 kg N·ha-1; this corresponds to significantly different fertility linear effects for MIL vs. COW and equivalent fertility linear effects for MIL vs. MIX, and COW vs. BG. At onion harvest in the 2006-07 experiment weed biomass was lowest for BG (Fig. 6). Low rainfall in the spring contributed to dry soil surface conditions in BG compared to residue plots, even sparse cowpea residue, and could have contributed to the lower weed biomass at onion harvest.
and horseweed (Conyza canadensis (L.) Cronquist) were more prevalent than other weeds. In January 2008 (1st weeding in the 2007-08 experiment) MIX-30 and MIX-50 had the highest weed cover and BG had the lowest weed density and percent weed cover (Fig. 4 and 5). At this time rye weeds had tillered, formed clumps and were by far the predominant weeds. At the second weeding date (April 2008) BG still had the lowest weed interference in terms of weed density (Fig. 4) and weed biomass (Fig. 6) and though percent weed cover was low it was also equivalent to COW (Fig. 5). At onion harvest in May 2008 weed densities in weed controlled areas were equivalent for all cover crop treatments (data not shown).
In 2006-07 total weed densities were lower by half or more for all cover crop
treatments at the second weeding compared to the first weeding, indicating that a majority of weeds were controlled at the first weeding (Fig. 4). The opposite occurred in 2007-08 where weed densities were nearly twice as high at the second weeding date compared to the first, yet overall weed densities remained low at both weeding dates in 2007-08. Low weed density on BG in 2007-08 could be attributed to recent soil fumigation, flame weeding control of rye seedlings during summer/early-fall fallow, and a soil surface environment less conducive to germination than where there was surface mulch. There was also less soil disturbance on BG in 2007-08 compared to BG in 2006-07 both during the transplanting operation and weeding events which could have contributed to fewer weed seeds brought to the surface. In 2006-07 hand weeding on BG included use of a hand hoe and scuffle hoe, due to high weed densities of small weeds.
105, and 210 kg N·ha-1 increased weed biomass compared to the 0 N rate (data not shown). In May, un-weeded areas in 2006-07 contained predominantly large spreading primrose and senesced henbit and in 2007-08 mature rye plants. In both cases weeds provided nearly complete ground cover.
Onion mortality. Onion mortality was over 50% in MIL and MIX plots in 2006-07
(Fig. 7). In 2007-08 onion mortality was close to zero except for MIL at 105, and 210 kg N·ha-1 rates but even then mortality was below 20% (Table 6, Fig. 7).
In both years, onion stand was complete through the month of November. After the second week in December 2006 (2006-07 experiment), following freezing night temperatures down to -9˚C, cold injury on onion plants was obviously more severe on MIL and MIX plots than COW and BG (visual observation). In December 2007 (2007-08 experiment)
in December, remaining MIL and MIX plants in 2006-07 exhibited uneven growth and plant size within plot rows, which suggests disease as a causal agent, however, allelopathy could also have contributed to onion stunting.
A follow-up study in February 2007 (2006-07 experiment) assessed the presence of water soluble allelopathic compounds in the baled milled which was used to supplement MIL and MIX plots. Millet mulch was tested as either 1) un-modified (UN) or 2) rinsed in water for twenty hours (R) (Creamer et al., 1996b). A bare surface control treatment (B), UN and R were compared in the field (five replications) and in greenhouse flats (six replications) planted with onion seedlings and grown for eight weeks. Average onion plant weight in the field trial was equivalent for all three treatments though onion mortality was greatest with B (data not shown). In the greenhouse trial B produced the lowest average onion plant weight compared to both mulch treatments (data not shown). Improved moisture conditions in mulched treatments UN and R compare to B likely contributed to the B treatments higher onion mortality in the field, due to low rainfall in February and March (Fig. 1), and lower average weight in the greenhouse where planting media dried faster. While no onion growth differences were apparent between UN and R millet mulch it is possible that insufficient water and leaching was present to cause an allelopathic effect.
Onion mortality was greater where soybean meal was applied (105, and 210 kg N·ha-1 rates) on MIL and MIX-70 (Fig. 7). Excessively high rates of soybean meal increase soil electrical conductivity and can cause crop plant injury (Brown, 2004). Onions are
particularly sensitive to soil salinity compared to other vegetable crops and nitrate
(Brewster, 2008a). Where soybean meal was applied (105, 210 kg N·ha-1) peak soil N levels, as measured on BG, were higher in 2007-08 than in 2006-07 (Fig. 2 and 3), which could explain why soybean meal had an effect on mortality in 2007-08 and not in 2006-07.
Onion yield. Sweet onions such as ‘Texas Grano 1015Y’ are sold by weight (e.g., 50
lb bags) and size grades determined by bulb diameter. Marketable onion yield consists of medium (5.0 to 7.6 cm diameter) and large (>7.6 cm diameter) size grades. Large grade onions are sometimes divided into additional size grades (e.g., colossal and super-colossal) and can be sold for a higher price per unit weight than smaller sizes.
The yield of marketable large grade onions and total bulb yield, which includes small grade and bolted onions, had significant cover crop by N rate interactions and highly
significant linear responses to N rate in both years (Table 6). The greatest yield of
marketable large grade onions was obtained at the 210 kg N·ha-1 rate with BG in 2006-07 and both COW and BG in 2007-08 (Fig. 8). The contrasts of COW vs. BG showed that in 2006-07 BG had greater yield of large grade onions across N rates and a steeper linear effect with increasing N rate; however, COW and BG were equivalent on both of these measures in 2007-08 (Table 6). MIL compared to COW had lower large grade yield and a shallower linear effect of N rate in both years. MIL and MIX-50 (MIX in 2006-07) had equivalent large grade yield and N rate linear effects both years.
Total bulb yield was equivalent for COW and BG in both years though BG had a steeper linear effect with N rate (Table 6, Fig. 8). MIL and COW showed the same
in 2007-08. The average bulb weight in the total yield showed that while COW yielded more than MIL the mean bulb weight was equivalent in 2006-07 (Table 7). This did not hold true in 2007-08 such that COW had greater total yield and average bulb weight than MIL. One of the main differences between the two experiment years for MIL and COW was that plant stand in 2006-07 was much lower in MIL than COW for much of the growing season. This suggests that reduced availability of N on MIL could have been compensated for in 2006-07 with greater area for resource uptake per plant.
Total marketable yield, the sum of large and medium grade onions, had a significant cover crop by N rate interaction in 2006-07 but not in 2007-08 though both years there was a highly significant linear effect of N rate. Even though BG had higher large grade onion yield than COW in 2006-07 the contrast of COW vs. BG total marketable yield showed them to be equivalent both years (Table 7). In 2007-08, total marketable weight averaged across fertility levels was highest with BG, COW and MIX-30, which were significantly greater than MIL. Marketable yields represented a greater proportion of total bulb yield, 70% versus 24%, in 2006-07 compared to 2007-08. The highest marketable yield was over 30 t·ha-1 in 2006-07 but was less than 12 t·ha-1 in 2007-08. Total onion yield was more similar between years,
Losses in marketable yield were primarily due to mortality in MIL and MIX in 2006-07 and bolting across all cover crop treatments, particularly in 202006-07-08 (Fig. 7). Bolting rates were greater than 50% in 2007-08 for all cover crop treatments and N rates. MIL had significantly less bolting than all other treatments in 2007-08 and even though there was no significant cover crop treatment effect in 2006-07 the contrast of MIL vs. COW showed that MIL had a lower rate of bolting and a more shallow N rate linear effect (Table 6). Bolting rates on MIL were numerically lowest in 2006-07 at the 105 kg N·ha-1 rate but that treatment also had the highest numerical rate of mortality so the onion plants that remained through the season could have had more nutrient, water, and light resources per onion plant because of the sparse stand (Fig. 7). Even though the rate of bolting was numerically high for COW at the 0 N rate in 2006-07 it was not significantly different than MIX or BG across N rates and had equivalent N rate linear slope (Table 6).
N rate had a significant negative linear effect on bolting from 0 to 210 kg N·ha-1 in both years. This finding corresponds with other studies that found bolting decreased with increasing fertilizer N rates (Díaz-Pérez et al., 2003; 2004). Díaz-Pérez et al. (2003) showed that N concentration of bulb tissue had a positive linear correlation with rate of N fertilization and further that bolting decreased with increasing bulb N up to 1.7% bulb N and then leveled off. While there was a significant linear correlation between increasing N rates (0 to 210 kg N·ha-1) and bulb N in 2006-07, N rate was not significant in 2007-08 (Table 7). Further, there was no apparent linear relationship between bulb N and rate of bolting either year.
2006-07 MIL onions did have lower bulb N than BG onions at the 0 N rate, but MIL and BG had equivalent bulb N at the 105 and 210 kg N·ha-1 rates in 2006-07 and across all rates in 2007-08. These were, however, end of season bulb tissue measurements whereas the vegetative tops had been collected in the middle of the growing season in the Díaz-Pérez et al. (2004) study.
Onion yield in weedy areas of subplots was prohibitively low due to intense weed interference. In both years marketable onion weight was less than 1 t·ha-1 for all weedy cover crop and fertility treatments (Table 8). Total and marketable yield was greatest at 210 kg N·ha-1 and equivalent at 0 and 105 kg N·ha-1 were equivalent both years. In 2006-07 marketable yield was not significantly affected by cover crop treatment but in 2007-08 low weed interference on bare ground plots (BG-w had similar low weed interference to BG that year) likely contributed to the relatively high yield on BG-w compared to other weedy cover crop treatments. With no weed control COW and BG-w had the greatest total onion yields both years, which were significantly greater than MIX in 2006-07, and greater than MIL both years. Rates of mortality and bolting in weedy areas followed similar cover crop and fertility trends seen in weeded areas for each year, respectively.
Conclusions
compared to clean till or bare ground cultivation but there are tradeoffs. Many other studies have shown that incorporating cover crops into production rotations provide a variety of benefits, especially over an extended period of time greater than one or two years (Wang et al., 2008). This experiment was conducted on two different sites over the two years and therefore did not address the long term affects of these cover crop management options.
Weed control for large scale organic production using in-situ cover crop residues would be a major challenge and expense. Management to reduce weed seed banks and careful selection of low weed pressure fields would be essential to making it commercially feasible. That type of management is not impossible and has been achieved on certain exemplary farms (Hinman, 2006). Even though COW had high weed interference, just two thorough hand weeding events were sufficient to maintain onion yields. Weed control is logistically difficult with surface residue since mechanic cultivation options would disturb residue and tend to catch and drag on equipment. Depending on the field specific weed pressure and types of weed species present, hand weeding through residue is effective but time consuming.
midsummer seeded cover crop in eastern North Carolina due to its susceptibility to foliar disease.
Onion bolting reduced marketable yield in both years of this experiment. Flower initiation in onions is influenced by onion variety, plant size or age, and several
environmental factors including photoperiod, temperature, and plant N status. Onion juvenility lasts until the plants reach a certain critical size and is often measured in terms of plant weight or number of leaves (6 to 9 after the cotyledon). A post-juvenile onion plant is receptive to vernalization, which is essential for floral initiation, and the rate of flower initiation increases with plant size (Brewster, 2008b). While not quantified in this
experiment, decomposition of cover crop residues could have influenced mid-season onion plant size and in turn differing rates of flower initiation. N immobilization from MIL in 2007-08, which had an initial C:N ratio over 37:1 could have contributed to smaller midseason plant size in MIL which in turn reduced the rate of bolting.
Soybean meal shows potential as an effective source of N even when surface applied in cool weather months. Even though the 105 kg N·ha-1 rate appeared to contribute
sufficiently to soil N for use as a starter fertilizer onion yield was higher at the 210 kg N·ha-1
References
Abdul-Baki, A.A., R.D. Morse, T.E. Devine, and J.R. Teasdale. 1997a. Broccoli production in forage soybean and foxtail millet cover crop mulches. HortScience. 32: 836-839. Abdul-Baki, A.A., R.D. Morse, J.R. Teasdale, and T.E. Devine. 1997b. Nitrogen
requirements of broccoli in cover crop mulches and clean cultivation. Journal of Vegetable Crop Production. 3: 85.
Abdul-Baki, A.A., R.D. Morse, and J.R. Teasdale. 1999. Tillage and mulch effects on yield and fruit fresh mass of bell pepper (Capsicum annum L.). Journal of Vegetable Crop Production. 5: 43-58.
Ashford, D.L.and D.W. Reeves. 2003. Use of a mechanical roller-crimper as an alternative kill method for cover crops. American Journal of Alternative Agriculture. 18: 37-45. Bowman, G., C. Shirley, and C. Cramer. 1998. Managing cover crops profitably. 2nd ed., p.
95-99. Sustainable Agriculture Network, Beltsville, MD.
Boyhan, G.E., A.C. Purvis, W.M. Randle, R.L. Torrance, M.J. IV Jefferson Cook, G. Hardison, R.H. Blackley, H. Paradice, C.R. Hill, and J.T. Paulk. 2005. Harvest and postharvest quality in short-day onions in variety trials in Georgia, 2000-03. HortTechnology. 15: 694-706.
Brewster, J.L. 2008a. Onion production, p. 251-299. Onions and other vegetable alliums 2nd Edition. CAB International, Wallingford, UK.
Brewster, J.L. 2008b. Physiology and environmental control of flowering, p. 138-148.
Onions and other vegetable alliums 2nd Edition. CAB International, Wallingford, UK. Brown, M. 2004. The use of marine derived products and soybean meal as fertilizers in
organic vegetable production. MS Thesis, North Carolina State University, Raleigh, NC.
Carrera, L.M., R.D. Morse, B.L. Hima, A.A. Abdul-Baki, K.G. Haynes, and J.R. Teasdale. 2005. A conservation-tillage, cover-cropping strategy and economic analysis for creamer potato production. American Journal of Potato Research. 82: 471-479. Chellemi, D.O.and E.N. Rosskopf. 2004. Yield potential and soil quality under alternative
Cherr, C.M., R. McSorley, and J.M.S. Scholberg. 2006a. Green manure approaches to crop production: a synthesis. Agronomy Journal. 98: 302-319.
Cherr, C.M., J.M.S. Scholberg, and R. McSorley. 2006b. Green manure as nitrogen source for sweet corn in a warm-temperate environment. Agronomy Journal. 98: 1173-1180. Creamer, N.G., M.A. Bennett, B.R. Stinner, and J. Cardina. 1996a. A comparison of four
processing tomato production systems differing in cover crop and chemical inputs. Journal of the American Society for Horticultural Science. 121: 559-568.
Creamer, N.G., M.A. Bennett, B.R. Stinner, J. Cardina, and E.E. Regnier. 1996b. Mechanisms of weed suppression in cover crop-based production systems. HortScience. 31: 410-413.
Creamer, N.G.and K.R. Baldwin. 2000. An evaluation of summer cover crops for use in vegetable production systems in North Carolina. HortScience. 35: 600-603.
Creamer, N.G.and S.M. Dabney. 2002. Killing cover crops mechanically: review of recent literature and assessment of new research results. American Journal of Alternative Agriculture. 17: 32-40.
Díaz-Pérez, J.C., A.C. Purvis, and J.T. Paulk. 2003. Bolting, yield, and bulb decay of sweet onion as affected by nitrogen fertilization. Journal of the American Society for Horticultural Science. 128: 144-149.
Díaz-Pérez, J.C., W.M. Randle, G. Boyhan, R.W. Walcott, D. Giddings, D. Bertrand, H.F. Sanders, and R.D. Gitaitis. 2004. Effects of mulch and irrigation system on sweet onion. I. Bolting, plant growth, and bulb yield and quality. Journal of the American Society for Horticultural Science. 129: 218-224.
Díaz-Pérez, J.C., J. Silvoy, S.C. Phatak, J. Ruberson, and R. Morse. 2008. Effect of winter cover crops and no-till on the yield of organically-grown bell pepper (Capsicum annuum L.). Acta Horticulturae: 243.
Downer, J., B. Faber, and J. Menge. 2002. Factors affecting root rot control in mulched avocado orchards. HortTechnology. 12: 601-605.
Gaskell, M.and R. Smith. 2007. Nitrogen sources for organic vegetable crops. HortTechnology. 17: 431-441.
Herrero, E.V., J.P. Mitchell, W.T. Lanini, S.R. Temple, E.M. Miyao, R.D. Morse, and E. Campiglia. 2001. Use of cover crop mulches in a no-till furrow-irrigated processing tomato production system. HortTechnology. 11: 43-48.
Hinman, T. 2006. A whole farm approach to managing weeds in onions: Eric and Anne Nordell’s Beech Grove Farm, Pennsylvania. ATTRAnews. National Sustainable Agriculture Information Service. Access Date Nov. 2008. < http://attra.ncat.org/attra-digest/ATTRAnews_Sept-Oct06.pdf>.
Hoyt, G.D. 1999. Tillage and cover residue affects on vegetable yields. HortTechnology. 9: 351-358.
Hutchinson, C.M.and M.E. McGiffen, Jr. 2000. Cowpea cover crop mulch for weed control in desert pepper production. HortScience. 35: 196-198.
Johnson, A.M.and G.D. Hoyt. 1999. Changes to the soil environment under conservation tillage. HortTechnology. 9: 380-393.
Lu, Y.C., K.B. Watkins, J.R. Teasdale, and A.A. Abdul-Baki. 2000. Cover crops in sustainable food production. Food Reviews International. 16: 121-157.
Mochizuki, M.J., T. Bjorkman, H.M. Van Es, A. Rangarajan, and R.R. Bellinder. 2007. Overcoming compaction limitations on cabbage growth and yield in the transition to reduced tillage. HortScience. 42: 1690-1694.
Müller, T.and P. von Fragstein und Niemsdorff. 2006. Organic fertilizers derived from plant materials Part II: Turnover in field trials. Journal of Plant Nutrition and Soil Science. 169: 265-273.
Mundy, C., N.G. Creamer, C.R. Crozier, L.G. Wilson, and R.D. Morse. 1999. Soil physical properties and potato yield in no-till, subsurface-till, and conventional-till systems. HortTechnology. 9: 240-247.
National Climatic Data Center. 2007. Climate of 2007 - September U.S. Drought Watch. 9 Sept 2008. <
http://www.ncdc.noaa.gov/oa/climate/research/2007/sep/us-drought.html>.
Oelke, E.A., E.S. Oplinger, D.H. Putnam, B.R. Durgan, J.D. Doll, and D.J. Undersander. 1990. Millets. Alternative Field Crops Manual. University of Wisconsin-Extension, Cooperative Extension; University of Minnesota: Center for Alternative Plants & Animal Products and the Minnesota Extension Service. Access Date Nov. 2008. <http://www.hort.purdue.edu/newcrop/afcm/millet.html>.
Perry, K.B. 1996. Average first fall frost dates for selected North Carolina locations. Horticulture Information Leaflets. North Carolina Cooperative Extension Service. Access Date Sept. 2008. <http://www.ces.ncsu.edu/depts/hort/hil/hil-708.html>. Ranells, N.N.and M.G. Wagger. 1997a. Grass-legume bicultures as winter annual cover
crops. Agronomy Journal. 89: 659-665.
Ranells, N.N.and M.G. Wagger. 1997b. Nitrogen release from grass and legume cover crop monocultures and bicultures. Agronomy Journal. 88: 777-782.
Rutledge, A.D. 1999. Experiences with conservation tillage vegetables in Tennessee. HortTechnology. 9: 366-372.
Sainju, U.M., W.F. Whitehead, and B.P. Singh. 2005. Biculture legume-cereal cover crops for enhanced biomass yield and carbon and nitrogen. Agronomy Journal. 97: 1403-1412.
Sanders, D.C. (ed.). 2004. Vegetable crop guidelines for the southeastern U.S. 2004-2005. North Carolina Vegetable Growers Association, Raleigh, NC.
Sargent, S.A., P.J. Stoffella, and D.N. Maynard. 2001. Harvest date affects yield and postharvest quality of nondried, short-day onions. HortScience. 36: 112-115. Stadler, C., R. Gutser, H. Heuwinkel, S. von Tucher, and U. Schmidhalter. 2006. Nitrogen
release from plant-derived and industrially processed organic fertilizers used in organic horticulture. Journal of Plant Nutrition and Soil Science. 169: 549-556. Stirzaker, R.J., B.G. Sutton, and N. Collis-George. 1993a. Soil management for irrigated
vegetable production. I. The growth of processing tomatoes following soil preparation by cultivation, zero-tillage and an in situ-grown mulch. Australian Journal of
Agricultural Research. 44: 817-829.
Stirzaker, R.J., J.B. Passioura, B.G. Sutton, and N. Collis-George. 1993b. Soil management for irrigated vegetable production. II. Possible causes for slow vegetative growth of lettuce associated with zero tillage. Australian Journal of Agricultural Research. 44: 831-844.
Sullivan, D.M., B.D. Brown, C.C. Shock, D.A. Horneck, R.G. Stevens, G.Q. Pelter, and E.B.G. Feibert. 2001. Nutrient management for onions in the Pacific Northwest. Pacific Northwest Extension.
<http://extension.oregonstate.edu/catalog/html/pnw/pnw546/>.
Teasdale, J.R.and C.L. Mohler. 2000. The quantitative relationship between weed emergence and the physical properties of mulches. Weed Science. 48: 385-392.
Tonitto, C., M.B. David, and L.E. Drinkwater. 2006. Replacing bare fallows with cover crops in fertilizer-intensive cropping systems: A meta-analysis of crop yield and N
dynamics. Agriculture, Ecosystems & Environment. 112: 58-72.
Treadwell, D.D., N.G. Creamer, G.D. Hoyt, and J.R. Schultheis. 2008. Nutrient management with cover crops and compost affects development and yield in organically managed sweetpotato systems. HortScience. 43: 1423-1433.
USDA. 1995. United States standards for grades of Bermuda-Granex-Grano type onions. United States Department of Agriculture: Agricultural Marketing Service. Fruit and Vegetable Division: Fresh Products Branch.
Wang, G., M. Ngouajio, M.E. McGiffen, Jr., and C.M. Hutchinson. 2008. Summer cover crop and in-season management system affect growth and yield of lettuce and cantaloupe. HortScience. 43: 1398-1403.
Table 1. Cover crop seeding rates. Seeding rate (kg•ha-1) Treatment Millet Cowpea
MIL 25
-MIX-70 10 65
MIX-50 7 65
MIX-30 4 65
COW - 85
MIL = millet; MIX-70, MIX-50, MIX-30 = cowpea with high, middle, and low seeding rates of millet; COW = cowpea.
Table 2. Percent weed cover rating scheme. Rate Ground cover
class (% weedy cover)
1 0 - 2.5
2 2.5 - 5
3 5 - 10
4 10 - 25
5 25 - 50
Table 3. Cover crop biomass, nitrogen and weed biomass at time of cover crop roll-down in 2006-07 and 2007-08.
Biomass N concentrationz
Millet Cowpea Additiony Total Weedx Millet Cowpea N contentw C:N
Year Treatment ---(t•ha-1)--- % Millet (g•m-2) ---(g•kg-1)--- (kg•ha-1) ratio
2006 MIL 2.41 - 3.64 6.05 - 6.47 av 20.4 a - 123 b 19.5 a
MIXu 0.90 3.90 2.53 7.33 47.1 3.33 a 19.0 a 21.6 a 152 a 19.9 a
COW - 6.08 - 6.08 - 0.02 b - 18.2 a 110 b 21.8 a
2007 MIL 4.44 - - 4.44 a - 3.29 a 12.1 c - 53 b 36.9 a
MIX-70 2.27 a 2.36 b - 4.63 a 52.5 a 7.09 a 14.6 ab 18.5 a 77 a 25.3 b
MIX-50 2.20 a 2.34 b - 4.54 a 50.3 a 1.94 a 12.9 bc 19.2 a 74 a 26.3 b
MIX-30 1.43 b 3.60 a - 5.03 a 29.2 b 1.09 a 15.4 a 18.3 a 88 a 24.2 bc
COW - 4.54 - 4.54 a - 0.90 a - 19.4 a 88 a 20.6 bc
zN concentration is sum of organic and inorganic N.
yMillet additions from an area seeded at the same time as cover crop treatments, grown and baled directly adjacent to the experimental
plots. Supplemental millet was distributed by hand evenly across the 1.2 m wide bed after onion planting.
xWeed biomass variable square root transformed for homogeneity of variance before analysis and back transformed for presentation. wTotal nitrogen in cover crop biomass including millet additions, which had N concentration of 20.2 g·kg-1.
vMean separation within column and year by Fishers protected least significant difference (
P ≤ 0.05) where LSD letters are presented. uMIX in 2006-07 was one mixture plot per block with millet additions to adjust to target percent millet (50%) while maintaining total
biomass within a range of 2.25 t·ha-1.
Table 4. Soil N (NH4+ + NO3-) as affected by cover crop and N rate in 2006-07 and 2007-08z.
Cover crop maturity Mid-season Bulb initiation Onion harvest
2006-07 2007-08 2007-08 2006-07 2007-08 2006-07 2007-08
Depth Treatment ---(kg N • ha-1
)---0-15 cm Covercrop
MIL 13.4 aby 12.2 b 30.6 13.0 11.4 16.2 12.6
MIX-70 - 13.0 b 22.4 - 12.4 - 11.6
MIX-50 14.6 a 12.2 b 30.0 12.0 11.5 15.9 12.3
MIX-30 - 12.8 b 24.9 - 12.0 - 11.6
COW 13.5 a 11.3 b 29.9 12.6 12.3 16.7 11.1
BG 11.5 b 70.0 a 36.0 10.3 13.9 14.5 11.8
N rate
0 - - 11.8 c 11.0 10.2 b 14.5 b 11.5
105 - - 22.6 b 11.8 12.4 a 15.0 b 11.9
210 - - 52.5 a 13.1 14.2 a 17.1 a 12.1
15-30 cm Covercrop
MIL 18.9 ab 12.0 b 23.3 9.6 15.9 bc 12.6 16.0
MIX-70 - 10.7 b 19.3 - 12.4 c - 11.9
MIX-50 12.3 c 9.1 b 20.3 11.0 16.6 ab 12.2 13.5
MIX-30 - 8.6 b 22.6 - 14.0 bc - 12.9
COW 15.2 bc 11.7 b 25.6 9.8 16.6 ab 11.8 11.1
BG 24.2 a 34.2 a 26.2 9.5 20.2 a 12.4 13.9
N rate
0 - - 11.6 9.1 11.8 b 12.6 13.4
105 - - 21.1 9.0 14.6 b 11.7 12.4
210 - - 35.9 10.6 21.4 a 11.9 13.9
zSoil sampling events for cover crop maturity were on 19 Oct. 2006 and 24 Oct. 2007; midseason on 7 Feb. 2008; bulb initiation on 27
Mar. 2007 and 21 Mar. 2008; onion harvest on 21 May 2007 and 22 May 2008 for 2006-07 and 2007-08 experiments respectively.
yMean separation within column and year by Fishers protected least significant difference (
P ≤ 0.05).
Table 5. Weed density, percent cover, and biomass prior to weeding events and onion harvest as affected by N rate in 2006-07 and 2007-08z.
1st weeding 2nd weeding Harvest 2nd weeding
densityy (m-2) percent coverx density (m-2) percent cover biomassw (g•m-2)
Treatment 2006-07 2007-08 2006-07 2007-08 2006-07 2007-08 2006-07 2007-08 2006-07 2007-08
0 120 av 6.9 ab 8.5 b 3.8 c 55 a 13 10.0 a 4.5 b 67 a 16.2
105 87 b 8.3 a 16.0 a 6.5 a 22 b 12 7.0 b 6.0 a 56 ab 21.2
210 73 b 5.4 b 14.5 a 4.8 b 21 b 12 8.0 ab 6.5 a 44 b 20.8
Statistics Significance
Cover crop (C) *** *** * * NS *** NS * * ***
N rate (N) *** ** ** *** *** NS * ** NS *
C x N NS NS NS NS * NS NS * NS NS
zThe first weeding took place on 15 Jan. and 10 Jan. and the second weeding on 22 Mar. and 15 Apr. in the 2006-07 and 2007-08
experiments respectively. Onion harvest weed evaluation occurred 18 May in the 2006-07 experiment.
yWeed density variables for both weeding events both years were square root transformed for homogeneity of variance before analysis
and back transformed for presentation.
xStatistical analysis was performed on class ratings of a modified Braun-Blanquet scale. Values presented are rate class means
converted to a percent weedy cover scale.
wWeed biomass for 2007-08 natural log transformed for homogeneity of variance before analysis and back transformed for
presentation.
vMean separation within column and year by Fishers protected least significant difference (
P ≤ 0.05). NS, *, **, *** Nonsignificant or significant at P ≤ 0.05, 0.01, and 0.0001 respectively.