CONSIDERATIONS CONCERNING THE ANALYSIS OF
NPP STRUCTURES SUBJECTED TO BLAST LOADING
R. Silva de Oliveira1, T. Cardoso1, C.L.M. Prates1, J.D. Riera2, I. Iturrioz3 and L.E. Kosteski3 1
Eletrobrás-Eletronuclear, Rua da Candelária 65, Rio de Janeiro, Brazil
2Department of Civil Engineering, School of Engineering, UFRGS, Porto Alegre, Brazil 3Department of Mechanical Engineering, School of Engineering, UFRGS, Porto Alegre, Brazil
E-mail of corresponding author: [email protected]
ABSTRACT
Basic features of the loads induced on structures by air blasts are described in IAEA Design Guide NS-G-1.5 (2003) in terms of a normalized distance that takes into account the amount and type of explosive charge. The guide presents charts that allow the determination of the peak value of the incident pressure, the total impulse of the positive phase and other relevant design parameters, which are generally used for design or verification purposes of sensitive nuclear structures. For the determination of the resulting actions on structures subjected to a specified blast event, the load-time functions induced by the incident pressure wave must next be evaluated, as discussed for example by Kinney and Graham. The authors note that a number of models are available for such purpose, such as Zaslavskii et al, which lead to different predictions and raise the issue of model uncertainty in this problem. In this paper, the uncertainties expected in the various stages of the process are examined in connection with the analysis of the air vent stack of a NPP presently under design. The spatial and temporal pressure distributions induced at the site by the blast were determined by means of a Finite Element model that simulates the shock wave propagation considering the topographical features of the site and the main structures of the NPP. The numerically determined pressures are compared with the IAEA design guide recommendations. Next, the loads induced in the air vent stack by the shock wave as well as the dynamic response of the stack are determined employing several models. The validity of commonly accepted assumptions in the determination of the response of structures to blast loading is finally discussed.
INTRODUCTION
Basic features of the loads induced on structures by air blasts are described in IAEA Design Guide NS-G-1.5 –2003 [1] in terms of a normalized distance that takes into account the amount and type of explosive charge. The guide updates earlier recommendations issued in the seventies by USNRC [2], presenting charts that allow the determination of the peak value of the incident pressure, the total impulse of the positive phase and other relevant design parameters, which are generally used for design or verification purposes of sensitive nuclear structures. Equations and graphs to obtain the necessary design parameters can also be found in Glasstone and Nolan [3] and Kinney and Graham [4]. In fact, the various models available for such purpose, such as Zaslavskii et al [5], lead to different predictions and raise questions on the reliability of the excitation adopted for the structural analysis, i.e. on the relevance of model uncertainty in this problem.
In this paper, uncertainties expected in the various stages of the process are examined in connection with the analysis of the air vent stack of a NPP presently under design. The spatial and temporal pressure distributions induced at the site by the blast were determined by means of a Finite Element model that simulates the shock wave propagation considering the topographical features of the site and the main structures of the NPP, as described in next section of the paper. The numerically determined pressures are compared with the IAEA NS-G-1.5 design recommendations and available experimental evidence, illustrating the expected variability of the prediction. In the following section, the loads induced by the shock wave in the air vent stack of the NPP as well as its dynamic response are determined employing several methods. On such basis, the validity of commonly accepted assumptions in the determination of the response of structures to blast loading is finally discussed.
DETERMINATION OF INCIDENT PRESSURES DUE TO THE BLAST
plane from the road to the vent stack is approximately 280 m. The vent stack is a conical 156 m high concrete structure with diameter that varies from 12,60m at the base to 6,60 m at the top.
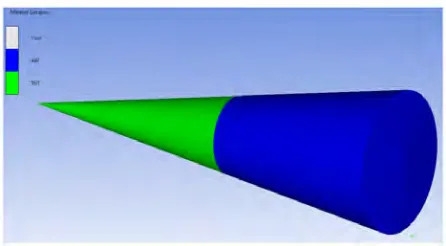
An initial analysis was performed to determine the pressure field induced by the blast, with the pressures generated by the detonation of 50.000 lb of TNT, with ANSYS Autodyn Finite Element program [6]. The resulting pressure field is imported in a second step, at the time when all the explosive mass was just consumed, i.e. when all the available energy has been released. In this initial simulation, a conical domain was used with two Eulerian materials, TNT and Air, with material properties taken from the software library [6]. The conical domain was filled with these two materials, so that the part that initially contains TNT, shown in green, represents the appropriate fraction of the total mass of 45.700kg of explosive, as schematically illustrated in Figure 1. The region in blue represents airwhile the red square indicated the detonation point. It is recommended that the initial domain allows the complete TNT expansion. In order to satisfy this condition, a trial method was used to define the air domain. AUTODYN® simulation environment has several parameters which allow visualizing the initial conditions at the post-processing stage. Among them, the ALPHA parameter is the fraction of total energy already released during the detonation process. The air domain was defined in such a way that the ALPHA parameter reaches unity before the pressure wave reaches the limits of the domain. For conservatism, an extra length was added to the air domain. Figure 2 shows these domains when ALPHA parameter reaches the unity.
Figure 1: Conical domain 2D slice
Figure 2: Conical domain when ALPHA reaches 1 (Time = 32 ms)
Figure 3: Spherical pressure field and several pressure calculation points
2
0
2 2 2
808 1 4, 5
1 1 1
0, 048 0, 32 1, 35 a
Z
p p
Z Z Z
+
=
+ + +
(1)
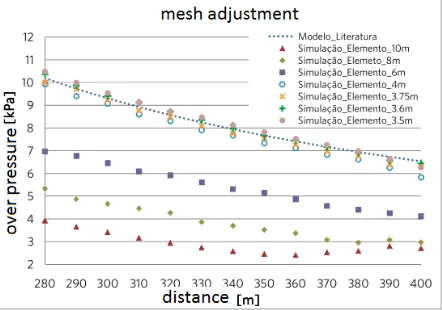
The finite element mesh size that provided the best fit to the empirical equation was chosen for the ensuing simulation (see Figure 4). This corresponds to an element size equal to 3,75 m.This mesh adjustment was performed considering the initial speed from the wave generated by 50.000 lbof TNT in order to minimize the error (Courant criterion: error = C ∆t/∆x, where: C = Constant; ∆t = integration interval; ∆x = mesh dimension). However, a new
analysis was performed with pressures generated by a detonation of 100.000 lb of TNT. This last charge corresponds to twice the mass of explosive specified by the guide, since the generated field is spherical and only the half part above a horizontal plane is used in the final simulation. However, even knowing that higher initial wave speed would require a finer mesh, a new adjustment of the mesh dimension was not performed because the results obtained were judged conservative in relation to the empirical equations.
Figure 4: Over-pressure calculation at several distances for mesh adjustment
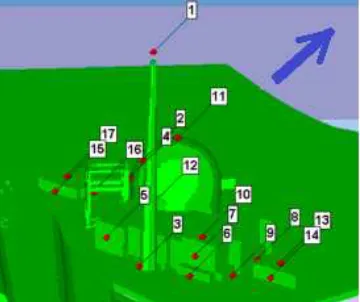
After determining the element mesh size, another model is generated, reproducing now the surface topography and the main buildings. The half sphere model is imported to define the initial conditions as shown in Fig.5. The ground surface and the buildings were modeled as rigid bodies and the atmospheric boundaries as "flow-out" boundaries. The pressure was evaluated in terms of time at 17 points, as shown in Figure 6. The vent stack has 3 points (numbered as 1, 2 and 3) for measuring the pressure at different elevations. The highest point (number 1) suffers minor influence from the topography.
Figure 5: Eulerian domain describibg the surface topography and main NPP buildings
Figure 6: Pressure calculation points at Angra 3 NPP buildings and wave front propagation direction
arrival time
+ phase duration
Over pressure
arrival time
+ phase duration
[s] [s] P [kPa] [s] [s] incident reflected
1 no 300 0,605 0,128 11,2 0,630 0,119 9,2 1,21
2 no 282 0,570 0,110 10,6 0,565 0,120 10,1 1,05
3 yes 293 0,643 0,164 7,6 0,602 0,120 19,5 0,39
4 yes 339 0,737 0,181 5,6 0,740 0,121 16,6 0,34
5 yes 296 0,635 0,171 6,4 0,614 0,120 19,3 0,33
6 yes 312 0,686 0,134 10,2 0,679 0,119 18,3 0,56
7 yes 315 0,686 0,138 9,3 0,687 0,119 18,1 0,51
8 no 360 0,816 0,168 5,3 0,797 0,123 7,0 0,75
9 no 332 0,747 0,149 7,4 0,725 0,120 7,9 0,95
10 no 320 0,694 0,166 5,7 0,698 0,119 8,4 0,68
11 no 356 0,776 0,145 5,4 0,786 0,123 7,1 0,75
12 yes 331 0,717 0,156 8,1 0,723 0,120 17,1 0,47
13 no 358 0,800 0,145 6,4 0,792 0,123 7,1 0,90
14 yes 352 0,784 0,123 10,0 0,775 0,122 15,8 0,63
15 yes 352 0,804 0,151 8,4 0,775 0,122 15,8 0,53
16 no 361 0,826 0,160 5,6 0,800 0,124 7,0 0,80
17 no 362 0,826 0,172 5,3 0,803 0,124 7,0 0,75
Finite Element Model Measuring
point
Reflected wave effect
distance [m]
Overpress. Comparison Overpressure [kPa]
AIEA Safety Standard NS-G-1.5
Table 1: Over-pressures at locations of the NPP indicated in Fig.8.
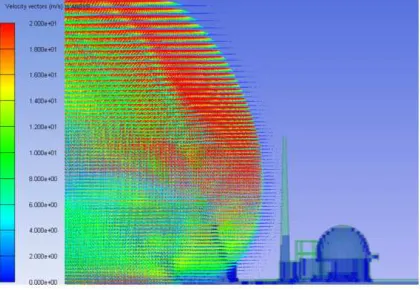
Figure 7 shows the particle velocity field in the pressure wave, just before the wave front arrival at the plant, while Figure 8 shows the pressure-time functions for the three measuring points along the vent stack.
Figure 7: Velocity field at the pressure wave front just before shock wave arrival at the plant
Figure 8: Pressure vs. time curves at different levels of the vent-stack
DETERMINATION OF EFFECTIVE LOADS ON THE VENT STACK
The first stage in the analysis consists of the determination of the pressures induced on the target structures by the blast. In the preceding section, a large FEM analysis was described, which was performed with the purpose of assessing the potential influence of local topography and large constructions on the incident wave pressures throughout the NPP. These pressures are not determined on the surface of the target structures and therefore cannot be directly used for structural analysis. At this stage, it is germane to compare the numerically determined overpressures in Figure 8 with the pressures measured by Ambrosini et al (2002) in an experimental evaluation of the efects of explosive charges on or at short distances from the ground, shown in Fig.7. It is seen that there is a close agreement between the shapes of the theoretical and experimental curves which, on the other hand, differ somewhat from the design functions specified in both IAEA [1] and NRC [2] guides. These codes suggest that a simplified triangular diagram may be adopted to represent the positive first overpressure pulse. Improved aproximations to experimental values are provided by overpressure vs. time curves found in the literature [3], [4], [7]. In order to model such diagrams, Riera [9] proposed the approximate function:
p( t ) = pr exp (- η t) cos (ωf t) (2)
In the present case pr = 20,5 kPa. Admiting that throughout the front face of the vent-stack the pressure is constant
and presents no phase difference, the force on the stack per unit length in the direction of propagation of the SW is:
Figure 9: Overpressure curves induced by a Gelamon blast close to the ground surface in flat terrain measured by Ambrosini et al [8]
D denotes the diameter of the vent-stack at height z. Similarly, the overpressure on the back face is:
p( t ) = ps exp [- η (t - tA)] cos [ωf (t - tA)] u(t - tA) (4)
In which ps = 10,2 kPa. The difference between the arrival times of the SW is estimated as:
tA = (πD / 2) / 498 = 10 / 498 = 0,03 s (5)
The total force is finally given by the equation:
F( t ) = D [pr exp (- η t) cos (ωf t) - ps exp [- η (t - tA)] cos [ωf (t - tA)] u(t - tA)] (6)
Equation (6) defines the loads on the vent-stack according to model denoted SW1, in which it is also assumed that the pressure front arrives at the same time along its length. The non-simultaneous arrival of the SW determined in the FEM analysis shown in Figure 7, as well as overpressures on the cylinder surface determined according to Ref. [1] (see Figure 10), were implemented in a model of the external forces denoted SW2.
Figure 10: Overpressure during passage of a SW and discretization in SW2 model
wave
propagation
direction
Ps
Ps
Ps
Pr
Pr
Pr
45º
45º
Ps
Ps
Pr
Pr
Pr
45º
22,5º
22,5º
3
1
Ps +
Pr
4
4
1
3
Ps +
Pr
0.00 0.05 0.10 0.15 0.20 0.25 0.30 0.35 0.40 -25 0 25 50 75 100 125 150 175 200 SW1 SW2 to 9m diameter
F o rc e [ k N /m ] Time [s]
Figure 11: Force-time functions during passage of a SW according to SW1 and SW2 models
The authors also determined the drag force on a generic vent-stack section employing the method proposed by Zaslavskii [10]. The resulting overpressure positive pulse, not reported herein, is compatible with the models shown in Figure (11), presenting an approximately 30% lower amplitude but around 15% larger area. These values are indicative also of the range of model error in the determination of the drag induced by the blast.
DYNAMIC RESPONSE OF VENT STACK TO BLAST LOADING
0.0 0.5 1.0 1.5 2.0 2.5 3.0 3.5 4.0 4.5 5.0 -200 -150 -100 -50 0 50 100 150 200 SW1 SW2 B e n d in g M o m e n t a t th e b a s e [ M N m ] Time [s]
Figure 12. Bending moments at base of vent-stack due to blast loads
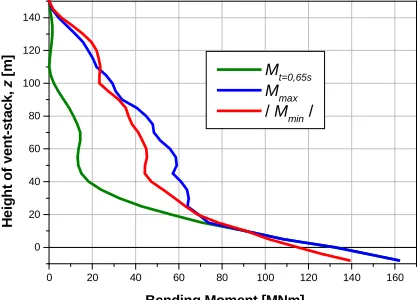
0 20 40 60 80 100 120 140 160 0 20 40 60 80 100 120 140 Mt=0,65s Mmax / Mmin /
H ei g h t o f v e n t-s ta c k , z [ m ]
Bending Moment [MNm]
The structural analysis of the vent-stack was performed by means of two models, a full 3D model using FE shell elements with 43776 DOF and a stick model, with 1200 DOF, for comparison purposes and global quality control. Figure 12 presents the evolution of the bending moment at the base of the structure, in the direction of propagation of the SW, according to the stick model and loads given by SW1 and SW2 shock wave models. It is verified that, on account of the impulsive-type loading systems, the difference between both cases is negligible because the total impulses are very similar. Finally, Figure 13 shows the bending moment distribution along the stack length at t= 0,65s, as well as the maximum and minimum values. Note that the latter are negative, i.e. they would cause failure in the direction opposite to the SW propagation direction.
CONCLUSIONS
In connection with the design of critical structures of Unit 3 - Angra 3 NPP (Brazil) - against a TNT explosion close to the site, the authors examine in the paper the recommendations contained in IAEA design guides, comparig empirical formulas for the overpressures with results of a finite elements analysis that allowed the consideration of the topography and the presence of large buildings at the site. The numerical analysis was first calibrated with the predictions from the empirical equations for a flat terrain. The final analysis clearly shows the influence of topography and large obstacles on the resulting pressure distribution at the locations of different structures in the NPP. Data on incident overpressures served then to determine the load vs. time functions for the 160m high vent stack employing various available methods and criteria. A dynamic analysis of the vent stack structure was finally performed to determine peak bending moments and shear along its length for some of the models of the incident loads. It is judged that the results furnish usefeul data on the relevance of model uncertainty in connection with blast loading in reliability studies of NPP structures.
Acknowledgements. The authors acknowledge the support of CNPq and CAPES (Brazil).
REFERENCES
[1] IAEA Safety Standards Series – “External Events Excluding Earthquakes in the Design of Nuclear Power Plants” - Safety Guide NS-G-1.5 – Vienna, Austria, 2003.
[2] U.S Nuclear Regulatory Commission Regulatory Guide 1.91: “Evaluation of explosions postulated to occur on transportation routes near power plant sites”, January 1975, Revision 1, February 1978.
[3] Glasstone, S. and Dolan, P.: “The effects of Nuclear Weapons”, US Department of the Army, (ND39-3), 1985
[4] Kinney G. F. and Graham, K. J.: “Explosive Shocks in Air”, 2nd. Edition, Springer-Verlag, 1985 [5] Zaslavskii, B. I. ; Shlegel, V. R. ; Morozkin, S. Yu. and Denisov, N. N. (2001): “Force action of a shock
wave on a solid body”, Journal of Applied Mechanics and Technical Physics, Vol. 42, No. 3, pp. 533-537, UDC 533.6.011.72
[6] Autodyn Users Guide, ANSYS Autodyn, ANSYS Inc. Canonsburg USA, 2010. [7] Baker, W.E.: Explosions in Air, 1973.
[8] Ambrosini, R.D.; Luccioni, B.M.; Danesi, R.F.; Riera, J.D. ; Rocha, M.M.: “Size of craters produced by explosive charges on or above ground surface”, Shock Waves, Springer Verlag, 2002, (DOI) 10.1007/s00193-002-0136-3.
![Figure 9: Overpressure curves induced by a Gelamon blast close to the ground surface in flat terrain measured by Ambrosini et al [8]](https://thumb-us.123doks.com/thumbv2/123dok_us/1301037.1162716/6.595.81.523.497.684/figure-overpressure-induced-gelamon-surface-terrain-measured-ambrosini.webp)