Review
Driving Behaviour and Sustainable
Mobility—Policies and Approaches Revisited
Ali Keyvanfar1,2,3,4 ID, Arezou Shafaghat3,4,*, Nasiru Zakari Muhammad5and M. Salim Ferwati6,*
1 Center for Energy Research, Jacobs School of Engineering, University of California,
San Diego, CA 92093, USA; akeyvanfar@ucsd.edu
2 Facultad de Arquitectura y Urbanismo, Universidad Tecnológica Equinoccial, Calle Rumipamba s/n y
Bourgeois, Quito 170508, Ecuador
3 Department of Landscape Architecture, Faculty of Built Environment, Universiti Teknologi Malaysia,
Skudai 81310, Johor, Malaysia
4 MIT-UTM MSCP Program, Institute Sultan Iskandar, Universiti Teknologi Malaysia, Skudai 81310, Malaysia 5 Faculty of Engineering, Kano University of Science and Technology Wudil, PMB 3244, Kano 20027, Nigeria;
mnasiruzakari@gmail.com
6 Department of Architecture and Urban Planning, College of Engineering, Qatar University,
Doha P.O.Box 2713, Qatar
* Correspondence: arezou@utm.my (A.S.); sferwati@qu.edu.qa (M.S.F.); Tel.: +1-442-237-8163 (A.S.); +974-3037-2708 (M.S.F.)
Received: 9 February 2018; Accepted: 9 April 2018; Published: 11 April 2018
Abstract: Climate change is receiving increasing attention in recent years. The transportation
sector contributes substantially to increased fuel consumption, greenhouse gas (GHG) emissions, and poor air quality, which imposes a serious respiratory health hazard. Road transport has made a significant contribution to this effect. Consequently, many countries have attempted to mitigate climate change using various strategies. This study analysed and compared the number of policies and other approaches necessary to achieve reduced fuel consumption and carbon emission. Frequency aggregation indicates that the mitigation policies associated with driving behaviours adopted to curtail this consumption and decrease hazardous emissions, as well as a safety enhancement. Furthermore, car-sharing/carpooling was the least investigated approach to establish its influence on mitigation of climate change. Additionally, the influence of such driving behaviours as acceleration/deceleration and the compliance to speed limits on each approach was discussed. Other driving behaviours, such as gear shifting, compliance to traffic laws, choice of route, and idling and braking style, were also discussed. Likewise, the influence of aggression, anxiety, and motivation on driving behaviour of motorists was highlighted. The research determined that driving behaviours can lead to new adaptive driving behaviours and, thus, cause a significant decrease of vehicle fuel consumption and CO2emissions.
Keywords: driving behaviour; fuel consumption; carbon emission; safety; mitigation policy;
climate change
1. Introduction
Climate change and the increased number of operating vehicles to cater to the human population contribute to carbon dioxide emission. According to Muslim et al. [1], the transportation sector contributes substantially to CO2emissions. Generally, emissions of CO2, NOx, CO, and CH due to the
operation of vehicles has always led to environmental pollution, greenhouse gasses (GHG), and health issues [2,3]. According to the International Energy Agency, road transport has a more significant contribution to climate change as compared to other sectors in the transportation industry [4]. This was
asserted by Muslim et al. [1], where they reported a 13.8% contribution of the transportation industry to global GHG emissions, of which 9.9% was due to road transport. Likewise, in Europe, road transportation contributes significantly to carbon emissions [5]. Vehicle fuel consumption and carbon emissions are influenced by driving behaviour, as well as traffic conditions, average driving distance for safety, and the status of the vehicle [6–8]. However, the driving behaviour literature lacks a comprehensive review on the policies, strategies, and approaches to mitigate climate change and safety issues. In this regard, the current study aimed to investigate the policies and strategies of driving behaviours for sustainable mobility. The research explored those policies and strategies associated with vehicle fuel consumption, tailpipe emissions, and safety. The content analysis method was conducted in the research, as it is a replicable, scientific, and transparent method of literature review analysis [9,10].
2. The Association between Fuel Consumption, Emissions, and Driving Behaviour
2.1. Fuel Consumption and Driving Behaviour
Transportation fuels are the energy sources that power various transportation modes for carrying goods and transporting people [11]. Basically, fuels are the result of refining products that vary based on their chemical properties, such as hydrogen (H), nitrogen (N), carbon (C), and oxygen (O2).
Such properties will result in various types of liquid fuels, petroleum, natural gas, coal-derived liquids (CTL), biofuels, alcohol, hydrogen, and ammonia. Approximately 80% of current transportation fuels are derived from petroleum, which include gasoline (petrol), diesel, jet fuel, liquefied petroleum gas (LPG), and marine fuel [12]. Around 77% of global energy consumption is dominated by fuel oil, of which gasoline and diesel are the major components, from the transportation sector [13]. Gasoline and diesel has become the primary sources of energy for most light duty vehicles (LDVs) for passenger and heavy duty vehicles (HDVs) for goods transportation. Jet fuel, residual fuel oil, and non-oil based fuel (e.g., natural gas and electricity) accounted for 12%, 9%, and 1% of energy consumption in the transportation sector, respectively [14]. More than 75% of these sources are used in road transport, while the remaining fuels are consumed by railways and ships, and jet fuel is used for aircraft energy supply.
Road transport consists of passenger car, Light duty vehicle (LDV), Heavy duty vehicle (HDV), buses, and others. The classification of types of vehicle under road transport is divided into the followings.
a. Passenger car:
• A motor vehicle including all sedans, coupes, and primarily manufactured to carry passengers including car pulling recreational and light trailers [15].
• A passenger car other than motorcycle that intends to carry passenger with not more than nine designated seats including the driver. For instance, taxis, micro cars, hired passenger cars, and also may include pick-ups [16].
b. Light duty vehicle (LDV): Includes any vehicle maximum gross weight rating (GVWR) which is less than 8500 lbs such as passenger cars [17].
c. Heavy duty vehicle (HDV): Includes any commercial medium to heavy duty vehicle or a work truck. For instance, pick-up trucks, vans, vocational vehicles, truck tractors with GVWR >26,000 lbs [18,19].
d. Buses: All types of buses with two, three, or more axles (six tires or more) including, conventional buses and school buses that carry passengers. However, modified buses should be considered as truck or to be classified appropriately [20].
• Two- or three-axle, six-tire, single unit truck (with dual rear wheels)—Single frame vehicle plus transport-trucks, vehicles for camping and recreational (RV) or caravan, mobile home, etc.
• More or less than four axles, single truck or trailer truck—All vehicles with four or fewer axles that consists tractor or straight truck power unit.
f. Railways/Locomotive: It refers to the land transport of passengers and goods on long railways or railroads. This system employs parallel rail tracks that provide support and direction for vehicles carried on flanged wheels.
Studies indicate that drivers’ attitudes toward traffic laws, particularly with regard to speed limits, have led to increased fuel consumption. This was applicable to light-duty drivers. Additionally, studies have shown that diesel vehicles consume the most fuel compared to other types of fuel. Therefore, driving style due to inherent drivers’ attitudes was one of the major issues of concern [21–24]. Haworth et al. [25] and Majid et al. [26] stated that complying with traffic speed limits could lower vehicle fuel consumption. Therefore, good training and educating of motorists to influence the driving pattern of individuals has the potential to curtail this situation and reduce consumption by up to 40% [27,28]. Carrese et al. [29] expressed that 27% of fuel could be saved due to driving style, and fuel consumption was increased by 26% due to vehicle load, and doubled as a result of moving on ascending grades.
2.2. Emissions and Driving Behaviour
Traffic-related emissions, such as CO2, CO, NOxand HC have negatively affected the environment
and always lead to poor air quality. Consequently, this increases health hazards, particularly respiratory diseases [30]. Among them, CO2was reported to have the most significant impact [31]. On the other
hand, these emissions are difficult to predict, let alone to measure. In this regard, Jamriska and Morawska [32] stated that the assessment of traffic emission has become a complex process, which largely depends on local conditions. According to Clark et al. [33], the most significant factors that affect the quantity of emissions generated by diesel-fuelled vehicles include the weight and the class of the engine. Likewise, the effect of the age of the vehicles and the terrain on which the vehicle is moving cannot be ignored. Studying these factors could be useful in determining the appropriate method for reducing these emissions. To quantify and evaluate the impact of these emissions on the environment, several approaches have been proposed. Among them is the in situ measurement of traffic particle emission for both petrol- and diesel-fuelled vehicles [34]. In this approach, particle concentration and exhaust are simultaneously measured based on the typical speed profile at a roundabout, signalized intersection, and other points within the traffic [35]. Additionally, Kholod et al. [36] developed a computer program for computing emissions from the diesel-fuelled on-road vehicles. Using this method, 11.7 tons of black carbon was found to be emitted in Russia in the year 2014. The result indicated that 55% of this emission was contributed due to operating vehicles without control emission devices. They also stated that the structure of a vehicle fleet is another factor influencing motorists’ emissions. Recently, Sun et al. [31] asserted that common occurrences of congestion in an urban road network is another important factor affecting traffic emission and air temperature. Consequently, this accelerates climate change as well as impacts of global warming in the cities [37]. According to Rodriguez et al. [38], driving behaviour can limit the annual emission of CO2by 12%, CO and HC
by 13% each, and NOxemission by 24%. Likewise, the effect of vehicle type and quality of fuel in
mitigating climate change was investigated [39]. This is probably due to differences in engine operating conditions [40–42], although the frequency of carbon dioxide emission varies from one class of road to another.
consumption. The result indicated that emission and fuel consumption were strongly related to speed and acceleration behaviour of motorists. However, as the passenger load increases, per-passenger fuel consumption and emission decrease proportionately. In general, higher quality fuel resulted in the lower emission of toxic products. Emissions were estimated and quantified by many researchers [46]. It was therefore the objective of this study to analyse various approaches to mitigation of climate changes in transportation sector from the perspective of drivers’ behaviour.
2.3. Safety and Driving Behaviour
Passenger safety has been strongly correlated with the on-road driving style. In this regard, Alam and McNabola [27] stated that training and educating drivers on the implication of an aggressive driving style has the potential to reduce accident rates by up to 40%. Bachoo et al. [47] conducted a survey in Greece among motorists: the aim was to evaluate their attitude toward compliance with traffic laws, such as stopping at stop signs, wearing seatbelts, and obeying the speed limit. The results showed that more than 35% of the 207 participants in a survey conducted did not comply with the traffic speed limit. In this regard, only 70% of them have the perception that compliance with the speed limit could reduce the frequency of accident. The results further indicate that most of the drivers were in a hurry and, thus, underestimate the driving risk at high speed. Consequently, this type of traffic attitude was found to influence driving behaviour and, thus, involvement in an accident [48]. Furthermore, Ulleberg and Rundmo [49] stated that personality traits are a major factor influencing risky driving behaviour, such as illegal overtaking and wrong assessment of passing distance. This was confirmed by Iversen [50] and Chen [51]. On the other hand, Oltedal and Rundmo [52] asserted that gender and personality traits are strongly correlated, which in turn influence risky driving behaviour. In addition to gender, relative difference in age was found to influence strict compliance with traffic laws [53]. In this respect, older drivers are more traffic law-compliant than younger ones, due to a sense of obligation to obey the traffic laws and perception of the danger of traffic violations [54]. This was supported by Rhodes and Pivik [55] and Ambrosio et al. [56].
Additionally, drivers’ distractions negatively affect driving behaviour and, thus, are unsafe due to potential hazard as a result of an irrational driving style [57,58]. These distracters could be child-related and cellular phone-related. In this regard, Mezanko et al. [59] investigated the relationship between driving attitude and behaviour among aged American drivers. The results indicated that drivers of at least 64 years of age were advocates of traffic safety culture. Consequently, speeding and phone-related distractions were extensively avoided due to safety concerns. Likewise, Papakostopoulos et al. [21] stated that self-rating in a questionnaire survey does not always reflect the actual performance of drivers in real-world situations. Therefore, inferring actual behaviour with self-rated driving characteristics has to be done with care. Eco-driving concept has limited references on driver attributes; thus, there is a possibility for researchers to develop, extend, or enhance the existing driving behaviour studies (see Figure 1). As mentioned earlier, psychological factor in driving behaviour are often neglected; subsequently, this study focused on the types of drivers through relevant psychological assessments: personalities [60], attitudes [61], cognition [62], or risk taking [63].
3. Climate Change Mitigation and Driving Behaviour
Figure2indicates the taxonomy of policies and approaches adopted to mitigate climate change from the perspective of driving behaviour. In the policies, regulations are made in an attempt to reduce vehicle operation cost and ensure environmental friendliness. To achieve this, policies, programs, and other regulations are imposed in many countries with a view to curtailing energy consumption and, perhaps, carbon emission [65,66].
Figure 2.Taxonomy of approaches to mitigation of climate change in transportation sectors.
Most governments nowadays invest substantially in the transportation sector. Some countries tried to impose policies with a view to regulating the fuel consumption, as well as GHG emission. A decreased rate of CO2emission varies according to the economic and population growth of a nation.
The mitigation policies implemented to regulate CO2emission appeared to be effective over recent
years in countries such as Canada and Australia, but not in China and Russia.
To further maximize the benefit of decreased fuel consumption, others have introduced a tax regime on oil, and other carbon-based fuels [67]. Consequently, fuel economy is promoted in a new automobile; it also discourages frequent driving by owners of new vehicles. In Texas, the influence of fuel price increases on traffic speed was investigated. The result indicated that, due to the increased price of gasoline, most drivers, in an attempt to save fuel, decreased their speed by up to 5.5% [68]. According to Greene and Rebound [69], a combination of multiple policies is likely to be more effective than a single one in operation. In this regard, new vehicle owners would prefer to use commercial transportation. Therefore, this approach has the potential to reduce vehicle fuel consumption in the USA by up to 5% in the next 30 years. However, this policy did not maximally reduce the fuel consumption based on the set fuel economy target.
Other policies include reduced traffic congestion to ensure free flow and reducing surplus speed. Additionally, policies relating to driver error, traffic violations, and other distractions, among others, were made. In the Middle East, fuel standards, public transportation, and periodic vehicle inspections were implemented. However, lack of enforcement, among other factors, have limited successes recorded in an effort to reduce GHG in the transportation sector [72]. Additionally, Egypt imposed another policy that encourages vehicle replacement and improves air quality by banning the operation of passenger cars that are at least 20 years old [73]. Furthermore, 100 taxi vehicles that are at least 35 years old were also replaced by new and more energy efficient vehicles. The program was later expanded as a structured private–public partnership between government agencies and other private establishments. The efficiency of this approach was measured by determining the percentage decrease in fuel consumption due to the replacement of old vehicles. The estimated fuel efficiency for an old vehicle was 13.16 L/100 km. On the other hand, fuel consumption of energy-efficient vehicles was 9.39 L/100 km. This implies a 28% decrease in fuel consumption due to this policy. Furthermore, another policy was enacted to progressively remove fuel subsidies. However, new vehicle ownership remained unaffected. In 2010, Canada set a target to reduce fuel consumption of motorists by up to 20% through aggressive implementation of policies on the use of energy efficient vehicles in 2016 [74]. According to the literature available to this study, Canada has not yet disclosed whether the set target was achieved. Additionally, the EU has set a target of achieving 95 gCO2/km in 2020 and is currently
working hard to implement such policies necessary to achieve said target. However, fuel consumption, as well as GHG emissions, are still increasing. An annual car ownership tax was also introduced as an additional policy to regulate fuel consumption in the EU. The result of this policy indicated 0% savings in fuel consumption. Consequently, the policy was not successful in curtailing fuel consumption. This is probably due to an increased number of light-duty vehicles and a lack of coordinated programs to influence the behavioural attitude of the driving style of motorists. Recently, Russia, in addition to a vehicle replacement policy, encouraged advanced emission control facilities to be installed in most of the newly-acquired energy-efficient vehicles. The policy is, however, least effective due to the relative proportion of old light-duty vehicles [75–77]. Furthermore, the Russian government introduced a policy of vehicle inspections and maintenance programs. In this regard, testing of vehicles older than seven years is enforced, in which buses and taxis must be tested twice per year. Likewise, the policy is expected to reduce the cost of fuel by up to 40%.
3.1. Learning Eco-Driving
Drivers have an inherently eco-driving model, which they do not use unless there is a system to support it [78–83]. In this regard, Johansson et al. [84] confirmed that motivation and training largely influence driving style. To date, training and educating motorists are the common learning approaches to induce eco-driving on the motorist. However, other studies have developed systems to support driving behaviour and, to this effect, automated devices were used to influence drivers’ perception and practice of eco-driving. Another approach was to offer simple advice to motorists, with a view to inculcating the eco-driving concept in their mind-set. Likewise, following an eco-driving car can change the driving behaviours of some drivers [79]. Consequently, a fuel saving of up to 18.4% can be achieved [85]. Despite its benefits, eco-driving is associated with a slight increase in travel time [85,86]. Zarkadoula et al. [87], on the contrary, reported a decrease in travel time. Thus, the implication of this study is that it is not necessary to record an increase of travel time due to eco-driving. The essence of eco-driving is to change the overall driving behaviour and style of the individual, which shall be aggregated to induce savings and perhaps reduce emission for the benefits of the planet.
3.1.1. Training and Education of Eco-Driving
In this regard, such training was made to be readily and widely available to the public in the USA. Additionally, the US government engaged in a mass public campaign and awareness program on the potential of eco-driving to induce major savings in the cost of fuel [90]. However, different drivers have different perceptions and understanding of eco-driving [91]. Some have understood it to be just a technique, thus concentrated on fuel saving. Others have perceived it to be tactical and strategic, therefore focusing more on the choice of vehicle and route. In this regard, some bus drivers were subjected to a relatively short-term training on eco-driving. They were intensively educated on how and when to accelerate, decelerate, and how to apply the brake. The result has shown a significant saving of fuel and reduction in carbon emission as compared to the other set of drivers who did not acquire any form of training regarding eco-driving [92,93]. In another study, a group of young and elderly persons were subjected to eco-driving training. A positive effect of the training on drivers was acknowledged and, perhaps, more effective than offering simple advice to drivers on eco-driving tips. In this regard, a reduction in fuel consumption was induced by up to 20% [94]. However, Gaines et al. [95] asserted that the training was more effective on elderly motorists as compared to young drivers. Likewise, Jeffreys et al. [96] conducted a study where the vehicle fuel consumption was compared and assessed, after subjecting drivers to eco-driving training. The results indicated that fuel consumption was reduced by 4.6% (0.51 per 100 km) due to the eco-driving education. Stillwater and Kurani [97] and Ruty et al. [98] asserted that eco-driving had successfully reduced the energy consumption cost by 20% and led to average emission decrease of 1.7 kg of CO2per vehicle per day.
In another study, 29 bus drivers were subjected to the eco-driving course, and the extent of the application of the learned techniques by the drivers was investigated [99]. The results have shown significant improvement in the fuel economy at the rate of 16.9% as compared to the fuel consumption prior to eco-driving. However, the major challenge is that some drivers find it difficult to put into practice their intention to eco-drive [100]. Consequently, these drivers need to be motivated to ensure compliance with eco-driving education. To this effect, the influence of motivation and incentive on drivers’ performance with respect to fuel consumption were studied by many studies [84,101–104]. It was found that fuel savings up to 5% was achieved due to non-monetary reward. Others have reported savings of 10% due to the application of a monetary reward system [105]. Chung and Wu asserted that drivers need to be motivated by ensuring the balance between effort and reward [106]. Despite the effect of training on the eco-driving, some passengers were not comfortable with the driving style of some commercial bus drivers who underwent eco-driving training. This is probably due to stressing on one aspect in an attempt to save fuel [107].
3.1.2. Automated Device to Support Driver’s Behaviour
emissions as well. However, it had little influence on fuel consumption. This was confirmed by Mensing et al. [114]. Thus, to ensure an optimal vehicle operation, participants in the training need to focus on all other aspects while practicing eco-driving rather than concentrating on only one part. Another aspect of eco-driving include; slow deceleration, early and quick gear shift, compliance to speed limit and other traffic laws, avoidance of vehicle idling, appropriate choice of route, etc. In addition, most of these applications did not take into account the effects of curves and crossing, thus cannot advise appropriately in such a situation. Consequently, Staubach et al. [85] incorporated a device that considered the effect of curves and advised on the appropriate gear shift for environmentally friendly driving. However, it was found to be associated with an increased travel time. Fors et al. [115], stated that a device that provides very simple, clear and concise information to drivers has more potential to induce behavioural as well as driving pattern changes. Otherwise, unclear information was found to cause a hard brake and acceleration [116]. In addition, Ciarla et al. [117] proposed a model that took into account the effects of intersection, roundabout and other traffic conditions to optimize the travel time. Caulfield et al. [93] recently reported on the success of the use of an on-board device in reducing emission. The device provides real-time fuel consumption and suggests an alternative route if the current one is congested.
3.1.3. Simple Advice to Motorists
An alternative approach to reducing fuel consumption and greenhouse gas emission was to advise drivers on the eco-driving tips using the Internet and other media. In this regard, Martin et al. [118] tried educating the public on eco-driving via the Internet. They sampled the opinion of 100 respondents. It was found driving behaviour of some people was influenced due to exposure to the eco-driving information. Thus, 57% of the participant in the survey had their driving behaviour improved. However, simple advice has always been inefficient with respect to smooth deceleration [94]. On the other hand, a positive effect was found regarding gearshift, steady speed and thus, reduces CO2
emission by up to 14% while NOxemission by 40% [119]. In addition, simple advice for a cold start
against hot start engine on the emission of Methane, Benzene, and Alkylbenzene was analysed and compared [120]. The results indicated that cold start emissions could on average reduce Methane, Benzene, and Alkylbenzene by 91%, 81%, and 85%, respectively.
3.2. Changing Vehicle
An alternative approach to the mitigation of climate change in the transportation sector, using electric vehicles, has recently been introduced. The positive effects and benefits of these types of vehicles regarding fuel consumption and emissions have been reported [121]. In this type of vehicle, electrical energy is used as a main source of energy for their mobility. Rolim et al. [116] stated that this vehicle could decrease CO2emissions at the rate of 63 g/km. Likewise, the least consumption over time
fuel consumption, as well as CO2emission. In this regard, use of vehicles with a gearshift indicator
necessary to achieve maximum fuel saving was introduced [49].
3.3. Sharing Vehicle
Alternatively, the car-sharing concept, which is based on collaborative consumption, is currently being investigated to establish its effect on sustainable mobility. This approach deals with a faster, comfortable, and more environmentally-friendly mobility with fewer private cars. Car-sharing considers other issues that failed to be addressed by conventional public transports, taxis, and car rental. In this concept, necessary associated fixed costs, as well as other obligations, are eliminated. According to Furnier et al. [126], car-sharing integrated with electric vehicles contribute to a more sustainable mobility when solar and wind are the major energy sources for the operation of such vehicles. However, securing such a renewable energy source is necessary for successful sustainable operation. Additionally, car-sharing practices can substantially reduce traffic congestion as it provides stations where vehicles can be picked up and returned at different stations. On the other hand, this approach requires very large investment, as well as many vehicles to meet the demand of prospective customers. To date, there are a limited number of young adult drivers ready to adopt car-sharing integrated with electric vehicles [126]. Furnier et al. [127] stated that car-sharing integrated with electric vehicles was found to reduce energy consumption by up to 67%. Furthermore, the study revealed a 40% saving potential in the carbon dioxide emission due to car-sharing integrated with electric vehicles.
Carpooling is an alternative mobility management approach in which groups of participants travel together in one common vehicle. In this regard, all the associated costs are shared by all the participants. An assessment survey in Portugal by Correia and Viegas [128] revealed that carpooling systems can potentially reduce the number of private vehicles in urban cities. This is due to common work schedules and activity sectors of the potential participants [129]. Therefore, a high-level application of carpooling is currently commonly found in manufacturing, construction, and other less readily accessible areas. However, it is obvious that such a system could not consider a trip schedule of a member different from the usual one and, thus, is apparently inflexible. Moreover, riding with strangers poses a psychological barrier to a successful implementation of the approach in other areas of a metropolis. Consequently, these limit the number of participants in carpooling, as asserted by Teal [130]. In this regard, the influence of carpooling on carbon emissions, and other sustainable mobility parameters, as well as driving behaviour, cannot be significantly established. Song et al. [131] proposed a network-based carpooling scheme that considers traffic issues integrating route matching for sustainable mobility. The main focus of the study was, however, to decongest traffic during peak hours. Therefore, the potential of network-based carpooling to curtail fuel consumption and traffic emissions cannot be guaranteed.
3.4. Fine and Tax on Risky Driving
Accident risk was regulated by introducing fine on the reckless driving, particularly beyond traffic speed limit and non-compliance with traffic laws. In this regard, drivers are left with an option of either traveling according to designed speed limit or violation of traffic law. However, the policy appears to be less effective due to growing number of vehicle owners with different driving attitude. To this effect, the world vehicle fleet is predicted to be tripled by 2050, and substantial amount of this growth will take place in developing and other transition nations [70]. The growth in these nations was also predicted to account for over 90% of the global increase. Consequently, vehicle fuel consumption and related emission would increase accordingly.
GHG from North America will reach maximum of 3 gigaton/year in 2050, while Asia will increase from 4 gigaton/year in 2000 to more than 8 gigaton/year in 2050. The Middle East is projected to be the largest contributor GHG to about 14 gigaton/year in 2050. For this reason, many countries focused on rate of vehicle carbon dioxide emission as a measure to mitigate climate change and perhaps to address health-related issues [71].
Carbon (or Fuel) taxes encourage energy conservation in transportation sector. This approach can assist the government to achieve sustainable development via multiple planning; for instance, via traffic congestion reduction. Numerous advantages such as road and parking cost saving, enhancement in traffic safety and mobility, health and fitness, energy conservations, and reduction of emission are identified [132]. Subsidised fuels should be eliminated to reduce current emissions levels [133] along with imposed taxes or by increasing tax rate upon carbon-based fuels used [134]. In Norway, the implementation of a carbon tax did not show significant reduction due to the economic growth in the production of oil and gas in that country. Furthermore, the Swedish government claimed that its emission level increased 20% without carbon taxing in 1991. Meanwhile, in Australia, the carbon tax policy was revoked in 2014 corresponding to a desire to lower costs for Australian businesses and ease the cost of living for households [135]. Transport pricing reforms is operated based on fuel taxation, registration and parking fees, and distance-based insurance. In the U.S., 2–4 cents/veh.km of user fees are imposed, including 6.12 cents/veh.km and 6–8 cents/veh.km of parking and registration fees and other fuel taxes upon greater production of pollution in the transportation sector [136,137].
3.5. Mobility Management
Mobility management includes reducing total vehicle travel through car free planning and vehicle restrictions, commuter trip reduction programs, distance based vehicle insurance and registration fees, distance based emission fees, freight transport management, fuel tax increases, mobility management marketing, non-motorized transportation improvements, ridesharing improvement and incentives, road pricing, smart growth development policies, tele-work encouragement, and transit improvements and incentives. Despite the difficulties of mobility management implementation, major benefits in terms of congestion reduction, road savings, parking savings, road safety, environmental protection, and efficient and liveability of land use can be seen through reductions of travel trips, car ownership, travel time, and traffic speeds. In addition, this method allows for effective choice of transportation and cost savings for consumers [137]. Globally, public transportation improvement is claimed to be a non-efficient strategy to reduce CO2emissions because of the high expenses required, estimated at
approximately 83.8 cents/kg CO2. It is estimated that about $1 million is needed to improve existing
facilities, including frequency of service, speed, travel rates, and comfort for users to commute without hassle. On average, a 0.15 kg g of CO2per kilometre reduction will cost at least 100 cents/kg CO2
annually. Moreover, it is predicted that, in 2016, fuel-economy standards (FES) would be burdensome to consumer, adding at least 3800 USD per car as the average price of a new car would rise 6200 USD [138]. In any case, it is expected that the FES/CAFE standards will increase to 46.60 mpg in 2025 [139], and higher prices will force millions of low income earners out of the new car market.
3.6. Alternative Fuels
has better anti-knock properties compared to gasoline and fewer emissions of CO2and unburned
hydrocarbons. Furthermore, bio-ethanol is partially oxidized and has a high flash point and auto ignition temperature [141]. Biodiesel is also in the family of biofuels and is made from soy bean or other feed stocks. The advantages of biodiesel in conventional engines include that it can be safely used without engine modification; it produces less GHG emissions; it is biodegradable, non-toxic, and economical; and it reduces foreign oil dependence. The use of compressed natural gas (CNG) also resulted in reduced emissions of NOxand PM, with most heavy duty vehicles, such as trucks
and lorries. Running an electric powered vehicle emits zero emission, but the electricity needs to be produced. Subsequently, researchers have predicted the global reduction would be as much as 59–71% in real world driving in 2050; however, this depends on the electricity grid carbon intensity [143]. Table 1 presents the quantitative estimation of environmental benefits indicated by the driving behaviour studies.
Table 1.Quantitative estimation of environmental benefits achieved by mitigation policies and driving behaviour studies.
Policies/Strategies Environmental Benefit
Cleaner Vehicle −31.2% Fuel consumption and CO2emissions by 2030 from baseline 2011 [144].
Mobility Management
Vehicle trip reduction by 10–30% [145].
−23% CO2emissions through car pooling, public transport. and cycling, changing driving behaviour and style, and using low-carbon fuels [146].
−13,608 kg/y CO2emission by 2050 [147]
−40% to 50% CO2emission per user by using the Electric vehicle or hybrid cars through carpooling [148].
−600 tons of CO2emissions per year by 2050 by increasing the park and ride facilities [149].
−111,584 and 181,437 kg of CO2emission by using a parking cash out program [132].
−28% CO2emission by using alternative fuels, low resistance tires, high lubricant oils, and Eco-driving program [146].
Changing Vehicle
FES/CAFE standards will increase to 46.60 mpg in 2025 [139].
−7.2 million mile vehicle travelled distance which equals 1000 daily trips. +$1 million subsidy amount [144].
Adding at least 380,000 cents per car as the average price of a new car would rise to 620,000 cents [138].
Tax and Fine on Risky driving
−16% CO2emission due to the congestion charging program conducted [150].
100 tons per weekday 24 h period CO2emission reduction by improving the transit services and park and ride facilities) [151].
In the U.S, 2–4 cents/veh.km of user fees is imposed; including 6.12 cents/veh.km and 6–8 cents/veh.km of parking and registration fees upon greater pollution production [134]. As a result, the operating cost was increased twice (>14–24 cents per vehicle-kilometre), as well as, 20–40% vehicle travel [152]. In Denmark, the carbon tax per person decreased in 2005 by approximately 15% from the baseline year of 1992; while in Australia, the carbon tax policy was revoked in 2014.
Alternative fuels
−10% CO2emission correspond to vehicle travelled mileage at annual travel rate 3% [153].
−74% CO2emission by biodiesel (B100) compared to petroleum diesel [154]. CNG vehicles offer a reduction of GHG emissions to only 186.411 g/km [155].
GHG emission levels, up to 310.686 g/km in fuel cell vehicles, 466.028 g/km in hybrid hydrogen combustion, and 608.944 g/km in non-hybrid hydrogen combustion [155].
Hydrogen based fuel increased GHG emission levels, up to 310.686 g/km in fuel cell vehicles, 466.028 g/km in hybrid hydrogen combustion, and 608.944 g/km in non-hybrid hydrogen combustion.
−20% CO2emissions by natural gas, particularly liquefied natural gas (LNG) [154]. <−15% CO2emissions per km by using compressed natural gas (CNG) [142].
−54% carbon emission by Plug-in electric vehicles (PEV) compared to conventional fuels [156].
4. Discussion
articles qualitatively, meaning it traced all those codes (i.e., keywords) in the articles and then marked in the matrix tables via reference citation and/or tick (√). In this research, the content analysis method synthesized the articles regarding diverse aspects, including the frequency aggregation on individual approach, considering the scope, study type as case study area, variables influencing driving behaviour, and the techniques for measuring dependant and independent variables influencing driving behaviour. The results of synthesized articles were tabulated in the form of matrix tables presented in the following sections (Tables2–5).
4.1. Frequency Aggregation on Climate Change Mitigation Policies
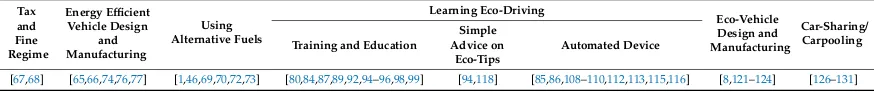
Table2enlisted the frequency of citations in respect of various approaches adopted to mitigate climate change. In this regard, Table2indicates that the most frequently adopted approach is learning eco-driving, followed by eco-vehicle design, and car-sharing. Table2further indicates that training and education, use of the automated devices on the vehicles, and simple advice on eco-driving tips are the common learning methods of eco-driving. In this regard, training and educating drivers to inculcate changes to their driving behaviour and style, and, thus, to adapt to fuel-efficient driving behaviours, appeared to be the most frequent learning method. This seems to be very effective regarding its positive influence on drivers’ behaviour. Consequently, this led to driving behaviour and styles characterized by the least fuel consumption and lowest emission, with increased safety of both driver and passengers. The next most frequently-applied learning method is the use of automated devices installed in the vehicle. These devices captured information from traffic data and offered advice to motorists as appropriate with respect to their driving style. Moreover, Table2shows that the least and, perhaps, moderately less effective learning method was the use of simple advice to motorists on eco-driving tips. On the other hand, tax and fine regime is the least adopted approach. In Table2, car-sharing is among the approaches adopted; however, it is the least implemented approach due to significant capital requirements coupled with people resistant to change.
Table 2.Taxonomy of driving behaviour studies associated with the climate change mitigation policies.
Tax and Fine Regime
Energy Efficient Vehicle Design
and Manufacturing
Using Alternative Fuels
Learning Eco-Driving
Eco-Vehicle Design and Manufacturing
Car-Sharing/ Carpooling Training and Education
Simple Advice on
Eco-Tips
Automated Device
[67,68] [65,66,74,76,77] [1,46,69,70,72,73] [80,84,87,89,92,94–96,98,99] [94,118] [85,86,108–110,112,113,115,116] [8,121–124] [126–131]
Moreover, Table2shows that most of the policies advocated by many governments focused on replacement of old vehicles with new ones, regulations to ensure periodic inspections of vehicles, and fines on risky driving. Furthermore, Table2indicates that the use of energy-efficient vehicle is the frequently imposed mitigation policy in driving behaviour studies. In this regard, automakers were mandated to design vehicles with lower fuel consumption, consistent with the set target of specific consumption over a unit mile [48]. In the beginning, the policy seems to be effective, however, due to the increased number of vehicles, coupled with the different driving style of motorists, the policy progressively becomes ineffective over the years.
4.2. Frequency Aggregation in Respect of the Scope, Study Type as Cases Study Area
Table3enlistes the type of studies, scope of the studies, as well as study area. To this effect, simulation studies, experimental investigations, and surveys are the typical studies conducted. In this regard, frequency aggregation has shown that the majority of the studies were experimental, in which special tools were installed in the vehicles to collect such information as fuel consumption and emission data in relation to driving style. Moreover, it can be seen in Table3that the survey was the next most frequent type of study conducted. In this regard, perceptions of individual drivers regarding safe driving, environment-friendly, and economical driving patterns were assessed and analysed. Additionally, the relationships among driving behaviour, fuel consumption, emissions, and safety were modelled. Furthermore, as can be seen in Table3, instead of real-world data, simulation studies were conducted to represent the real-world driving scenario and traffic conditions. Consequently, fuel consumption, emissions and safety were analysed based on the assessed driving style.
Moreover, Table3shows that, irrespective of the study, diesel-fuelled private and public transports were the typical types of vehicles investigated. However, the majority of the studies were conducted based on the public vehicle fleet. Likewise, a heavy-duty vehicle fleet was the next most frequent type of vehicle investigated. Additionally, private vehicles were also among the motorists studied, with eco-vehicles being the least frequent type of motorist evaluated. This is probably due to the high cost of acquisition; hence, it is not readily affordable to most motorists and, thus, not frequently used on the street and other arterial roads.
Table3indicates that urban area/city and other places such as street, inter-urban roads, rural roads and freeways are common locations where these studies are conducted. In this regard, city/urban areas are the most frequently investigated case studies. However, this is followed by a simultaneous investigation of urban areas and another areas. The next most frequently-investigated study areas were freeways.
Table3enlistes the drivers’ characteristics, dependent variables, and driving behaviours. In this regard, young and elderly and male and female motorists were investigated. Likewise, driving behaviours, such as compliance with speed limits and acceleration and deceleration styles, are the common driving style investigated. Other driving styles, such as gear shifting, braking, engine idling, work pressure, pre-trip vehicle inspection, choice of route, overtaking, and compliance to traffic rules were among the driving behaviours investigated. Furthermore, fuel consumption; emissions of CO2,
NOx, and CO; and safety appeared to be the common variables studied to establish the influence of
such driving behaviour.
Table3further indicates that compliance with speed limits was the most frequently studied driving behaviour with respect to its influence on safety, fuel consumption, and emissions. This was followed by acceleration/deceleration behaviour. On the other hand, the simultaneous influence of acceleration/deceleration behaviour, compliance to speed limits, and other behaviours were among the least frequent studied. Likewise, the simultaneous influence of deceleration, compliance to speed limits, and other driving behaviours was not well acknowledged by many researchers. However, effects of adhering to speed limits, gear shifting behaviour, and breaking style was among the frequently investigated studies. In this regard, early gear shifting, compliance to the speed limit, and steady application of the brake were found to reduce fuel consumption, and emissions of NOx, CO, and CO2.
fuel savings of up to 20% was achieved. On the other hand, the next frequent study was the influence of driving behaviour on the safety of motorist and other passengers. To this effect, elderly drivers were found to better comply with traffic rules than younger ones. Consequently, they are more involved in less risky driving. This was followed by other studies where the influence of driving behaviour on both fuel consumption and CO2emission was investigated and established.
4.3. Frequency Aggregation of Variables Influencing driving Behaviour
Table4shows that significant numbers of studies have been conducted to establish the effect of driving style on both fuel consumption and the emission of other gasses. In this regard, compliance with speed limits and slow acceleration have greatly minimized emissions of NOxand CO. Likewise,
Table4indicates that few studies were conducted to establish the effect of noncompliance to speed limits on the emissions of NOx, CO, and CO2. The result shows that emission of NOx, CO, and CO2
increases with speeding. Moreover, it can be seen in Table4that limited studies exist where the influence of driving behaviour on fuel consumption and emissions of CO2 and other gasses was
investigated at the same time. Additionally, there are few studies on the effect of a slow rate of acceleration/deceleration and compliance to speed limits on fuel consumption, CO2emission,
and safety of passengers, as well as motorists.
Table4has two rows called “Frequency” and “Depth of Citation”. The frequency determines times of citations for each factor by summing up the citations, and the depth of citation indicates the rate of citation for each factor by dividing the frequency of the factor to the total (i.e., 28 citations). For example, CO emission has been cited 4 times out of 28, so Frequency for the CO emission is 4, and Depth of Citation is 14.2%. According to Table4, 96.2% of eco driving researchers have studied fuel consumption. In addition, all researchers have studied CO2emission, while few have investigated
the PM emission in eco driving (7.1%). Indeed, Table4can show how much eco driving researchers have focused on different factors of this topic.
4.4. Frequency Aggregation of Measurement Techniques in Driving Behaviour Studies
Table5enlistes the measurement techniques for the dependent variables. Table5indicates that common techniques adopted are the use of on-board equipment and other methods for measuring the fuel consumption; CO2 emission; and NOx, CO, and CH emissions. On the other hand, safe
driving was assessed by the accident risk. On-board equipment includes tools usually mounted on the vehicle to capture the data on fuel consumption and gaseous emissions. Other techniques for measuring vehicle fuel consumption involved the use of an on-board diary, simple numerical computation, and the use of on-board fuel flow meter information from drivers about the vehicle fuel tank level per day, monthly vehicle-kilometres of a driver, and microscopic emission models. Likewise, traffic emissions were measured using a flexible rubber tube laid out on the road surface, using an emission equation model and analytical method.
Furthermore, Table 5 presents the factors that influence such driving behaviours as acceleration/deceleration, compliance to speed limits and traffic laws, gear shifting style, idling, and choice of route. It can be seen in Table5that acceleration/deceleration behaviour and compliance with speed limits are commonly influenced by drivers’ aggression and anxiety. This is probably due to some drivers being in a hurry for an appointment and natural impatience. Additionally, other factors, such as motivation to save fuel, environmental consciousness, drowsiness, and drinking and driving, largely influence driving speed and acceleration/deceleration behaviour. Moreover, Table5
Table 3.Taxonomy of driving behaviour study’s types, scopes, locations, conditions, and characteristics of driver.
Type of Study Scope of the Study
On-Road Measurement Country Driving Style Gender Age Driving Experience T raining (Before T est) Research Sampling Size W eather Experimental Simulations Survey Heavy Duty V ehicle
Fleet Light Duty
Eco-V ehicle Sporty Economic Safe Private Public
[6,8,22,29,
32–36,38–
43,45,71,77,
79,84,87,89,
92–94,96–
98,101,102,
104,112–114,
116,119,122]
[8,23,24,
26,35,44,
46,66,83,
85,86,99,
111,114,
115,121,
123]
[40,59–
62,64–
67,70,74,
115,117,
120,122,
124]
[33–36,
39,40,45,
77,89,92,
102,115,
119]
[52–57,
96,97,
100]
[6,21,24,
26,28,29,
32,38,40–
43,66,71,
84,87,93,
98,99,101,
103–105,
107,112,
113,116]
[8,97,
122,123]
[6,21,22,28–
30,33,34,36,
38–44,47,66,
71,79,83–85,
87,92,93,96,98,
99,101,102,
104–107,112,
115,116,119]
Australia [28,32,82,96], Sweden [34,92,
107,112,115],
Japan [6,79], France [94,108], USA [90], Ireland [86], China [110], Germany [85]
[86] [85,86] [28,85,
86,92,94,
107]
[28,82,
86,92,96,
107,110]
[28,85,
86,92,96,
103,107]
[86,110] [28,92,
94,107,
112]
6 [6], 323 [28],
24 [82], 28 [92], 39 [94], 853 [96], 30 [102], 25 [107], 22 [110], 10 [112]
[94,108]
Table 4.Taxonomy of dependent and independent variables and drivers characteristics in driving behaviour studies.
Ref.
Dependent Variables Independent Variables Drivers Characteristic
Results
Fuel
Consumption
Emission
Safety
Driving Behaviour Male Female
CO 2 CO NO x CH PM Acceleration Deceleration Compliance with Speed Limit
Others Young Elder Young Elder
[6] X X X X X X X X X X X Compliance with speed limit has significantly reduced CO2emission.
[21] X X X Fuel consumption and CO2were increased due to aggressive driving behaviour and noncompliance to traffic law, accident risk increased.
[23] X X X X X X X X X X X Fuel consumption largely depends on compliance with the speed limit. [24] X X X X X X X X X X X Fuel consumption decreased due to following eco-driving car. [28] X X X X X X X X X X X Compliance to speed limit reduce the accident risk significantly,
[29] X X X X X X X X X X X X Driving behaviour has led to 27% fuel saving. On the other hand, emission of CO and NOxwas minimized. [33] X X X X X X X X X X X X X X X Emission of NOxincreases with increase of rapid acceleration
Table 4.Cont.
Ref.
Dependent Variables Independent Variables Drivers Characteristic
Results
Fuel
Consumption
Emission
Safety
Driving Behaviour Male Female
CO
2
CO NO
x
CH PM
Acceleration Deceleration
Compliance
with
Speed
Limit
Others Young Elder Young Elder
[38] X X X X X X Reducing rapid acceleration was found to decrease annual emission of CO2by 12%, CO, and HC by 13% each as well as NOxby 24%.
[44] X X X X X X X X X X X X Traveling at a reduced speed in urban street decreases emission and fuel consumption. [46] X X X X Emission was in good correlation with drivers’ speed
[47] X X X X X X X X X X X X Safety of passenger decreases with over speeding
[48] X X X X X X X X X X X Risky driving behaviour increased with violation of traffic rule and over speeding. [49] X X X X X X X X X X X Risky driving style increases with drivers’ aggression.
[54] X X X X X X X X X X X Risky driving behaviour or increases with increase of traffic law violation by younger drivers. [66] X X X X X X X X X X X Many gear changes and the predominant use of lower gears increases fuel saving increases up to 9%. [71] X X X X CO2emission and fuel consumption increase with speed;
[77] X X X X X X X X X X X Fuel saving and emission increase with the increase of environmental consciousness of drivers due to theirlevel of education. On the other hand, vehicle owners emphasize on fuel saving only.
[79] X X X Fuel saving and CO2emission were found to decrease when following an eco-driving car.
[83] X X X X X X X X X X
Improving drivers’ mental model by instructing them to comply with speed limit, slow rate of acceleration and deceleration was found to significantly reduce fuel consumption, CO2emission and improve passenger safety.
[84] X X X X X Emission results indicated no difference between trained and untrained drivers. However, CO2emission and fuel consumption have comparatively decreased with respect to trained drivers.
[85] X X X X X X X X X X X Early gear shift coupled with slow rate of acceleration/deceleration increased fuel saving by up to 18%regardless of drivers sex/age.
[86] X X X X X Compliance with speed limit coupled with the slow rate of acceleration/deceleration decreased fuelconsumption and CO
2emission by up to 20% respectively.
[87] X X X Compliance with speed limit decreases fuel consumption and CO2emission by up to 4.3%. [92] X X X X X X X X X X X Slow rate of acceleration reduced fuel consumption by up to 1.7%
[98] X X Decrease of idling of engine led to average reduction in the emission of 1.7 kg of CO2per vehicle per day. [99] X X X X X X X X X X X Compliance to speed limit and early gear shift have led to 16.9% fuel saving.
[119] X X X X X X X X X X X X X X X
Over speeding due to aggressive behaviour increases fuel consumption and emission by up to 40% respectively. On the other hand, compliance with speed limit reduces fuel consumption and emission by 14% respectively.
Frequency * 27 28 4 6 3 2 22 24 20 23 23 19 18 19 17 * Frequency; is the sum of citations.
Depth of Citation
(%) ** 96.2% 100% 14.2% 21.4% 10.7% 7.1% 78.5% 85.7% 71.4% 82.1% 82.1% 67.8% 64.2% 67.8% 60.7%
Table 5.Taxonomy of Measurement techniques in Driving Behaviour Studies. Mitigation Aspects in Driving Behaviour Studies On Board Equipment Accident risk Aggressive Driving Following Eco-Driving Rules Speed Acceleration/Deceleration engine Idling T ravelled T ime and Distance T raf fic Calming Devices T raf fic V olume T raf fic V iolation Engine Capacity V ehicle’ s Routing System V ehicle’ s T ransmission System Fuel Consumption
and CO2Emission
[66,83,84,87, 89,92,119]
-[67,82,83, 92,112, 119,120]
[68,82,83,118, 120,127]
[67,99,101,
107,127] [98,99,101] [114,119,120,123] [97,104]
[83,86,97, 104,118,
119]
[119] [118,120,121] [100,117] [83,105,
110,118]
Safety - [25,28,47–55,
57,59]
[67,82,83, 92,112, 119,120]
-[46,83,85,86, 89,92,109,
110,113]
[48,50,55,57, 59,77,84,85, 87,93,94,98, 99,101,104, 105,109]
- [49,52] [49,50,52,
53,55]
[49,50, 52–54,59,
116]
-4.5. Vehicle Light-Weighting and Life Cycle Assessment
Vehicle factors such as types of engine, fuels, engine capacity, maintenance, air conditioned, maintenance, and tire pressure have shown significant impact on vehicle fuel consumption and tailpipe emission. Besides, high engine performance, lightweight, small engine size, and automatic engine stopping system have made almost negligible emissions and lower fuel consumption [157]. This is because the engine will be used in an operating area that corresponds to better efficiency [158]. According to Alessandrini et al. [159], a conventional car consumes 12.6 L/100 km fuel with average CO2emissions around 260 g/km while a hybrid car consumes 8.23 L/100 km fuel with average CO2
emissions of 180 g/km.
The policies resulting in using smaller or lightweight vehicles can change the end-of-life performance of the vehicle, and reduce the fuel consumption of the vehicle [160,161], while maximize the life-time energy consumption [162,163]. Paulino et al. [161] stateed that lightweight vehicles “have a reduced impact on the current infrastructures of fuel production and vehicle maintenance in opposition to the vehicles that use alternative energy sources”. Koffler and Rohde-Brandenburger [164] expressed that “lightweight design has been recognized as one of the key measures for reducing vehicle fuel consumption, along with power train efficiency, aerodynamics and electrical power management”. Indeed, using lightweight materials for vehicle manufacturing has been significantly successful compared to using biofuels (5%) [161]. The light-weighting policy unanimously has fewer trade-offs in adoption of novel and new materials and technologies [160,165]. Lightweight vehicles use aluminium, magnesium alloy, carbon-fibre reinforced polymer (CFRP) and other materials, which have lower GHG and CO2emissions over vesicle’s life-cycle than iron and steel [165–167]. For example,
replacing steel Mg has led to 5.7% weight reduction that decreases the vehicle fuel consumption and life cycle emissions by 1.3% and 0.8%, respectively. US Federal Test Procedure driving cycles (United States Environmental Protection Agency [168]) and the United Nations Economic Commission for Europe [169] are evaluating the lightweight LCA based on Fuel Reduction Value (FRV) coefficient. The FRV should be in the range 0.02–1.00 L/100 km.
5. Conclusions
Transport sector is meant for passenger and goods movements through land, air, and water carriers. Rapid urbanization and ever-increasing population growth are the major factors increase vehicle ownership and mobility demand, which further leads to CO2and GHG emissions and energy
sources consumption. In addition, growth in personal income allows an individual to purchase more than one car. As a result, the individual may own two or three cars that increases indirectly the vehicle travelled mileage (VTM), and, substantially, CO2emission and fuel consumption. Logically, the more
we travel, the higher the number of trips generated, and, subsequently, more fuel will be burnt. In this study, various approaches that were adopted to mitigate climate change in transportation sectors from the perspective of driving behaviour of motorists were analysed and compared.
(a) Based on the previous studies, common approaches adopted to mitigate climate change in transportation sectors are learning eco-driving, using eco-vehicles, and car-sharing. Additionally, car-sharing/carpooling is among the approaches with the potential to mitigate climate change, however was least investigated. Likewise, vehicle fuel consumption, and emissions of CO2,
NOx, CO, and CH, coupled with safe driving, were the common evaluation criteria for each
approach. However, economic motivation to reduce fuel consumption appeared to be the most frequently adopted criteria. In this regard, eco-driving was found to be the most frequently adopted approach due to its potential to induce a behavioural change that can lead to new adaptive driving behaviours and, thus, cause a significant decrease of vehicle fuel consumption and CO2emissions, as well as NOx, CO, CH.
with traffic laws, gear shifting, braking style, idling of the vehicle, and choice of route were among the driving behaviours investigated. In this regard, positive effects of a slow acceleration/deceleration style and compliance to the speed limit, on vehicle fuel consumption have been established. To this effect, fuel saving was increased to 18%. On the other hand, annual emission of CO2was decreased by 12%, CO by 13%, and NOxby 24%. Additionally, an average
reduction of 1.7 kg of CO2per vehicle per day was achieved due to a decrease of engine idling.
Likewise, compliance with speed limits and early gear shifting led to fuel savings of up to 16.9%. (c) Anxiety, aggression, motivation, and incentive were found to be the common factors influencing driving behaviours. Furthermore, gender, age, stress, drowsiness, distraction, and drinking and driving were among the influencing factors that led to unsafe driving behaviours.
(d) It is observed that most mitigation policies adopted were based on target limits with respect to fuel saving and carbon emissions set to be achieved over time. However, many countries could not realize the set within the targeted period. This is probably due to increased number of light-duty vehicles and a lack of coordinated programs to influence the behavioural attitude of the driving style of motorists.
(e) Tax and fine regime did not receive considerable attention due to the high cost of acquisition and natural human resistance to change.
(f) The influence of gender and age on driving behaviours that led to a more fuel-efficient driving style with the least GHG emission has not been extensively investigated.
Acknowledgments:The authors would like to thank the Malaysia Ministry of Science Technology and Innovation (MOSTI) grant vote No. R.J130000.7922.4S123. In addition, the authors appreciate these organizations for their supports and contributions and Research Management Center at Universiti Teknologi Malaysia.
Author Contributions: Ali Keyvanfar, Arezou Shafaghat, Nasiru Zakari Mohammad, and M. Salim Ferwati contributed to preparing this manuscript.
Conflicts of Interest:The authors declare no conflict of interest.
References
1. Muslim, N.H.; Keyvanfar, A.; Shafaghat, A.; Abdullahi, M.A.M.; Khorami, M. Green Driver: Travel Behaviors Revisited on Fuel Saving and Less Emission.Sustainability2018,10, 325. [CrossRef]
2. Shafaghat, A.; Keyvanfar, A.; Zakaria, W.Z.; Zaimi, M.Z.A.; Lamit, H.; Ali Kh, N.; Ahmad, M.H.; Iskandar Ariffin, S.A. Investigation of Future Building Performance Factors Towards Energy Efficient Travel Plan in Regional Development.J. Teknol.2014,70, 77–81.
3. Yan, X.; Crookes, R.J. Energy demand and emissions from road transportation vehicles in China.Prog. Energy Combust. Sci.2010,36, 651–676. [CrossRef]
4. Lamit, H.B.; Majid, M.Z.A.; Shafaghat, A.; Keyvanfar, A. Sidewalk Design Decision Making Model Based on Walking Behaviour Pattern Recognition: Proposal Validation.OIDA Int. J. Sustain. Dev.2012,4, 27–34. 5. Annual European Union Greenhouse Gas Inventory 1990–2012 and Inventory Report 2016. Eurpopean Energy
Agency, UNFCCC Secretariat: Bonn, Germany. Available online:https://www.eea.europa.eu/publications/ european-union-greenhouse-gas-inventory-2014(accessed on 10 April 2018).
6. Ando, R.; Nishihori, Y. A Study on Factors Affecting the Effective Eco-driving.Procedia-Soc. Behav. Sci.2012,
54, 27–36. [CrossRef]
7. Hsu, C.Y.; Yang, C.S.; Yu, L.C.; Lin, C.F.; Yao, H.H.; Chen, D.Y.; Lai, K.R.; Chang, P.C. Development of a cloud-based service framework for energy conservation in a sustainable intelligent transportation system.
Int. J. Prod. Econ.2015,64, 454–461. [CrossRef]
8. Wang, Y.; Yan, X.; Zhou, Y.; Xue, Q. Influencing Mechanism of Potential Factors on Passengers’ Long-Distance Travel Mode Choices Based on Structural Equation Modeling.Sustainability2017,9, 1943. [CrossRef] 9. Ariens, G.A.M.; Vanmechelen, W.; Bongers, P.M.; Bouter, L.M.; Vanderwal, G. Psychosocial risk factors for
neck pain: A systematic review.Am. J. Ind. Med.2001,39, 180–193. [CrossRef]
11. C2ES- the Center for Climate and Energy Solutions. Transportation Overview. 2016. Available online: http://www.c2es.org/energy/use/transportation(accessed on 1 January 2018).
12. Zholudeva, N. Transport Fuels. 2016. Available online:https://www.studentenergy.org/topics/transport-fuels (accessed on 1 January 2018).
13. US Department pf Energy (DOE). Transportation Fuels: The Future Is Today. 2006. Available online: http://www.formula-hybrid.org/wp-content/uploads/DOE-Alternative-Fuels-Teacher-Guide.pdf (accessed on 15 December 2017).
14. US Energy Information Administration.Energy Information Administration. International Energy Outlook; US Energy Information Administration: Washington, DC, USA, 2011.
15. US Department of Transportation (USDOT). Traffic Monitoring Guide. 2014. Available online: https://www.fhwa.dot.gov/policyinformation/tmguide/tmg_2013/vehicle-types.cfm (accessed on 1 March 2018).
16. United Nations Economic Commission for Europe (UNECE). Glossary for Transport Statistics-Passenger car. 2013. Available online: http://epp.eurostat.ec.europa.eu/cache/ITY_OFFPUB/KS-BI-03-002/EN/KS-BI-03-002-EN.PDF(accessed on 15 December 2017).
17. Blumberg, K. US: Vehicle Definitions. 2015. Available online:http://transportpolicy.net/index.php?title=US: _Vehicle_Definitions(accessed on 15 December 2017).
18. Legal Information Institute (LII). 49 CFR 523.6-Heavy-Duty Vehicle. 2011. Available online:https://www.law. cornell.edu/cfr/text/49/523.6(accessed on 15 December 2017).
19. Global Facilitation Partnership (GFP). Maritime Transport. 2013. Available online:http://www.gfptt.org/ node/67(accessed on 15 December 2017).
20. TxDOT- the Texas Department of Transportation Federal Highway Administration (FHWA) 13-Vehicle Classes with Definitions—MAG Internal Truck Travel Survey and Truck Model Development Study. 2013. Available online:http://onlinemanuals.txdot.gov/txdotmanuals/tri/classifying_vehicles.htm(accessed on 15 December 2017).
21. Papakostopoulos, V.; Marmaras, N.; Nathanael, D. The “field of safe travel” revisited: Interpreting driving behaviour performance through a holistic approach.Transp. Rev.2017, 1–20. [CrossRef]
22. Shafaghat, A.; Keyvanfer, A.; Muslim, N.H.B. Drivers’ adaptive travel behaviors towards green transportation development: A critical review.Arch. Transp.2016,38, 49–70. [CrossRef]
23. McGordon, A.; Poxon, J.E.; Cheng, C.; Jones, R.P.; Jennings, P.A. Development of a driver model to study the effects of real-world driver behaviour on the fuel consumption.Proc. Inst. Mech. Eng. Part D J. Automob. Eng. 2011,225, 1518–1530. [CrossRef]
24. Li, S.E.; Peng, H. Strategies to minimize the fuel consumption of passenger cars during car-following scenarios.Proc. Inst. Mech. Eng. Part D J. Automob. Eng.2012,226, 419–429. [CrossRef]
25. Haworth, N.; Symmons, M. Driving To Reduce Fuel Consumption And Improve Road Safety. Monash University Accident Research Centre. Available online: http://acrs.org.au/files/arsrpe/RS010036.pdf (accessed on 3 March 2018).
26. Majid, M.Z.A.; Bigah, Y.; Keyvanfar, A.; Shafaghat, A.; Mirza, J.; Kamyab, H. Green Highway Development Features to Control Stormwater Runoff Pollution.J. Environ. Treat. Tech.2015,4, 173–175.
27. Alam, M.S.; McNabola, A. A critical review and assessment of Eco-Driving policy & technology: Benefits & limitations.Transp. Policy2014,35, 42–49.
28. Wills, A.R.; Watson, B.; Biggs, H.C. Comparing safety climate factors as predictors of work-related driving behavior.J. Saf. Res.2006,37, 375–383. [CrossRef] [PubMed]
29. Carrese, S.; Gemma, A.; La Spada, S. Impacts of Driving Behaviours, Slope and Vehicle Load Factor on Bus Fuel Consumption and Emissions: A Real Case Study in the City of Rome.Procedia-Soc. Behav. Sci.2013,87, 211–221. [CrossRef]
30. Shafaghat, A.; Keyvanfar, A.; Manteghi, G.; Lamit, H. Environmental-conscious factors affecting street microclimate and individuals’ respiratory health in tropical coastal cities.Sustain. Cities Soc.2016,21, 35–50. [CrossRef]
![Figure 1. Eco driving concept (Source: Adopted from Ecowill (Honda: Hamamatsu, Japan) [64]).](https://thumb-us.123doks.com/thumbv2/123dok_us/1249336.1157555/4.595.103.492.629.746/figure-driving-concept-source-adopted-ecowill-honda-hamamatsu.webp)