ISSN: 2502-4752, DOI: 10.11591/ijeecs.v11.i2.pp577-584 577
Intelligent Agent Simulator in Massive Crowd
Mohamad, S.1, Nasir, F.M.2, Sunar, M.S.3, Isa, K.4, Hanifa, R.M.5, Shah, S.M.6, Ribuan, M.N.7, Ahmad, A.8
1,4,6,7,8
Faculty of Electrical and Electronic Engineering, Universiti Tun Hussein Onn Malaysia, Johor, Malaysia 1,2,3
UTM-IRDA Digital Media Centre, Media and Game Innovation Centre of Excellence, Universiti Teknologi Malaysia, Johor, Malaysia
1,2,3
Faculty of Computing, Universiti Teknologi Malaysia, Johor, Malaysia 5
Centre for Diploma Studies, Universiti Tun Hussein Onn Malaysia, Johor, Malaysia 6
Research Centre for Applied Electromagnetics, Universiti Tun Hussein Onn Malaysia, Johor, Malaysia
Article Info ABSTRACT
Article history: Received Jan 15, 2018 Revised Mar 12, 2018 Accepted Mar 28, 2018
Crowd simulations have many benefits over real-life research such as in computer games, architecture and entertainment. One of the key elements in this study is to include elements of decision-making into the crowd. The aim of this simulator is to simulate the features of an intelligent agent to escape from crowded environments especially in one-way corridor, two-way corridor and four-way intersection. The addition of the graphical user interface enables intuitive and fast handling in all settings and features of the Intelligent Agent Simulator and allows convenient research in the field of intelligent behaviour in massive crowd. This paper describes the development of a simulator by using the Open Graphics Library (OpenGL), starting from the production of training data, the simulation process, until the simulation results. The Social Force Model (SFM) is used to generate the motion of agents and the Support Vector Machine (SVM) is used to predict the next step for intelligent agent.
Keywords: Crowd
Intelligent Agent Support Vector Machine Social Force Model OpenGL
Copyright © 2018 Institute of Advanced Engineering and Science. All rights reserved.
Corresponding Author: Mohamad, S,
Faculty of Electrical and Electronic Engineering, Universiti Tun Hussein Onn Malaysia, Johor, Malaysia. Email: [email protected]
1. INTRODUCTION
Crowd modelling has become increasingly important over the years due to its wide range of applications. Its extensive use can be seen particularly in movies and computer games. Movies such as The Lord of the Rings series, Hugo and World War Z embrace virtual crowd due to the lower cost of generating crowd rather than hiring extras. Games such as the Assassin’s Creed series, on the other hand, model crowd to improve gamers’ experience, making the gaming experience more realistic.
There are basically three approaches to model the crowd. The first approach is by experimenting with humans in real-world. This approach is used particularly in the aviation industry, where aircraft manufacturers need to test the evacuation effectiveness of new aircrafts to get approval from the air safety authorities. Unless there is no requirement from the authorities, this approach is difficult to carry out due to the ethical and legal concerns [1], [2].
The third approach requires researchers to develop a simulation in order to create the virtual crowd [5], [6]. This is the logical approach for most researchers due to the constraints and drawbacks of earlier mentioned approaches. There are many ways to develop the simulation system. This includes the use of analysis and designing tools such as MATLAB, game engines such as Unity and graphics Application Programming Interface (API) such as the Open Graphics Library (OpenGL) [7], [8].
Therefore, the purpose of this work is to develop an intelligent agent that can make decisions for the next step position in a dense crowd simulation within the shortest time possible. Since it is difficult to describe the decision rules in an explicit form, a machine learning technique which is the Support Vector Machines (SVMs) by Vapnik is implemented. SVM is widely used in many fields such as image classification [9], [10], motion rules learning [11] and walking motion recognition [12]. The results of this work are shown in the Intelligent Agent in Massive Crowd Simulator. This simulator clearly shows how the intelligent agent can decide which route to choose to reach the target position. The user can make several choices such as agent type, agent form, number of agents and others.
2. RESEARCH METHOD
The system is divided into two main components. The first component is the training component which is responsible for the training of intelligent agent, while the second component is the simulation system which is responsible for simulating the decision-making capability of the intelligent agent in the Social Force Model (SFM) environment.
2.1 Agent Control and Collision Avoidance using SFM
The SFM was originally introduced by [13], and is one of the microscopic techniques in crowd simulation. It presents an idea that the internal motivation of agents to perform certain movements will affect their motion. Throughout the years, many improvements are made to the original model. One of the latest improvements is made by the researchers in [14]. In their research, the model parameters are calibrated to match the results of the experiments they have conducted in the real-world crowd.
The model describes the motion of an agent as the combination of a driving force component and two repulsive force components. Each component is calculated for every agent in the simulation. For every agent 𝑖, its social force 𝒇𝑖 can be represented by Equation (Equation) 1. The relationship of these components with its surroundings is illustrated in Figure 1.
𝒇
𝑖=
𝒇
𝑖0+
𝒇
𝑖𝑤𝑤𝑤𝑤+
𝒇
𝑖𝑤𝑎𝑎𝑎𝑎𝑎 (1)Figure 1. Social forces
𝒇
𝑖0=
𝑢
𝑖0�
𝒑
𝑖𝑎𝑤𝑡𝑎𝑎𝑎
− 𝒑
𝑖
�𝒑
𝑖𝑎𝑤𝑡𝑎𝑎𝑎− 𝒑
𝑖�
� − 𝒗
𝑖𝜏
(2)
The second component 𝒇𝑖𝑤𝑤𝑤𝑤, is the repulsive force between agent 𝑖 and the obstacle wall. It describes the effects of interaction between them, as shown in Equation 3. Parameter 𝑑𝑤 is the shortest distance between agent 𝑖 and the wall, parameters 𝑎 and 𝑏 are constants with values of 3 and 0.1, respectively; and parameter 𝒆𝑖𝑤𝑤𝑤𝑤 represents a unit direction vector from agent 𝑖 to the nearest point on the wall.
𝒇
𝑖𝑤𝑤𝑤𝑤=
−𝑎
−𝑑𝑤
𝑏
𝒆
𝑖𝑤𝑤𝑤𝑤 (3)The final component 𝒇𝑖𝑤𝑎𝑎𝑎𝑎𝑎, is the sum of repulsive forces between agent 𝑖 and other agents 𝑗. It describes the effects of interaction between them, as shown in Equation 4. The interaction effects between agents 𝑖 and 𝑗 can be described in terms of speed and directional changes. The first effect which is represented by 𝑓𝑢, describes the deceleration along the interaction direction 𝒕𝑖𝑖. The second effect, on the other hand, is represented by 𝑓𝜃, describing the directional changes along 𝒏𝑖𝑖, where 𝒏𝑖𝑖 is the normal vector of 𝒕𝑖𝑖 oriented to the left. The deceleration and directional changes effects are described in Equation 5 and 6, respectively.
𝒇
𝑖𝑤𝑎𝑎𝑎𝑎𝑎=
��𝑓
𝑢𝒕
𝑖𝑖+
𝑓
𝜃𝒏
𝑖𝑖�
𝑖≠𝑖(4)
𝑓
𝑢=
−𝐴𝑒
−𝑑𝑖𝑖
𝐵 −�𝑎′𝐵𝜃𝑖𝑖�2 (5)
𝑓
𝜃=
−𝐴𝐴𝑒
−𝑑𝑖𝑖
𝐵 −�𝑎𝐵𝜃𝑖𝑖�2 (6)
In both Equation 5 and 6, parameter 𝐴 is a constant with a value of 4.5 and parameter 𝑑𝑖𝑖 represents the distance between both agents, 𝑖 and 𝑗. Both parameters 𝑛′ and 𝑛 are the angular interaction constants with values of 3 and 2, respectively. Parameter 𝜃𝑖𝑖 denotes the angle between 𝒕𝑖𝑖 and 𝒆𝑖𝑖, where 𝒕𝑖𝑖 is the result of the calculation made by using Equation 7 and 𝒆𝑖𝑖 is a unit vector pointing from agent 𝑖 to 𝑗. Parameter 𝐵 is calculated from Equation 8. Parameter 𝐴 used in Equation 6 represents the sign of 𝜃𝑖𝑖 that can be obtained by dividing the value of 𝜃𝑖𝑖 by the absolute value of 𝜃𝑖𝑖.
𝒕
𝑖𝑖=
�𝑫
𝑫
𝑖𝑖 𝑖𝑖�
(7)
𝐵
=
𝛾�𝑫
𝑖𝑖�
(8)𝑫
𝑖𝑖=
𝜆�𝒗
𝑖− 𝒗
𝑖�
+
𝒆
𝑖𝑖 (9)Parameter 𝑫𝑖𝑖 in both Equation 7 and 8 represents the interaction vector between both agents, 𝑖 and
2.2 Intelligent Agent Training Input
The training input consists of 18 features as shown in Table 1.
Table 1. Eighteen (18) Features for Training Input
Agent Number of Features Detail of Features
Intelligent Agent 2 velocity x, vx0
velocity y, vy0
Nearby Agent #1 4 position x, px1
position y, py1 velocity x, vx1 velocity y, vy1
Nearby Agent #2 4 position x, px2
position y, py2 velocity x, vx2 velocity y, vy2
Nearby Agent #3 4 position x, px3
position y, py3 velocity x, vx3 velocity y, vy3
Nearby Agent #4 4 position x, px4
position y, py4 velocity x, vx4 velocity y, vy4
In this work, half ellipse of influence is used to get the first four of the most significant nearby agents. This idea is similar to the Personal Reaction Bubble (PRB) in [15].
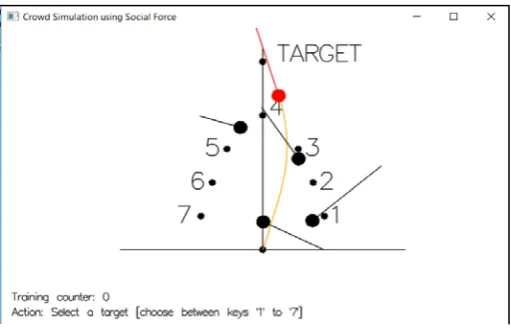
Figure 2. Graphical User Interface (GUI) for get training input
Figure 2 shows seven waypoints that the agents may pass. These seven waypoints are also known as class labels. The combination of class labels and 18 features is also known as the training data for SVM.
The agent is red is the agent that is being trained for making decisions (intelligent agent), while the agents in black are its neighbouring agents. Depending on the predetermined variable, the number of neighbouring agents can vary between 4, 5 or 6 agents. The intelligent agent is always initially position at the origin on the local coordinate system and has a fixed target along the 𝑦-axis as shown in Figure 2. Each neighbouring agents on the other hand, have random initial and target positions, both on the local coordinate system. During each training iteration, all agents will automatically move using the SFM as their control mechanism. Then, based on the trailing path coloured in orange, the user will select the best avoidance waypoint for the intelligent agent.
2.3 Simulation of Intelligent Agent and Other Agents
shape where the intelligent agent is coloured in red while the other agents is coloured in black. The agents have random initial and target positions. Obstacle walls, on the other hand, are represented with lines. The position of the walls is predetermined depending on the situation being simulated.
Each agent has four important parameters to control its motion. The parameters are position 𝒑𝑖, velocity 𝒗𝑖, maximum speed 𝑢𝑖𝑚𝑤𝑚, and target position or positions. Additionally, each target position is represented by a disk with a centre position 𝒑𝑖𝑎𝑤𝑡𝑎𝑎𝑎 and radius 𝑟𝑖𝑎𝑤𝑡𝑎𝑎𝑎.
Three different situations are defined to test and experiment the proposed technique. The situations are the one-way corridor simulating the unidirectional flow of other agents, the two-way corridor simulating the bidirectional flow of other agents and finally, the four-way junction simulating the crossing flow of other agents. Note that, in all these situations, the intelligent agent will cross the flow of other agents.
3. RESULTS AND ANALYSIS 3.1 Control Window
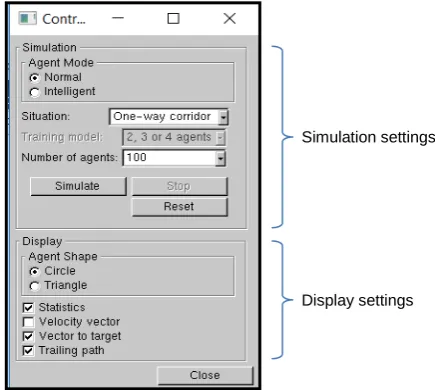
Figure 3 shows a control window where users can select multiple options. The window is divided into two main sections. The first section, groups the parameters to manage the simulation aspect of the system. There are two types of agents that the users can choose which is either normal or intelligent. Users can also choose the types of situations whether it is the one-way corridor, the two-way corridor or the four-way junction. Options for the number of agents are 100, 200, 300 or 400. For intelligent agents, the training models that the users can use for decision making are the training models for 4 agents, 5 agents and 6 agents or the combination of all three models. The users can click on the simulation button to start the simulation, the stop button to stop the simulation and the reset button to reset the simulation. The second section, groups the settings to manage the display aspect of the simulation. There are two forms to represent an agent which is either a triangle or circle. The users can also choose to display the statistics, velocity vector, vector to target and trailing path.
Figure 3. Control window
3.2 Simulation Window
Figure 4 shows an example of simulation in the case of an intelligent agent in a one-way corridor situation. The intelligent agent will move from the initial position to the target position while the other agents will move from left to right. The line at each agent shows the velocity vector for each agent, with each agent having different direction and length. This situation will create a high force from left to right. The intelligent agent will try to resist this force as the intelligent agent will move from top to bottom. The time taken for the intelligent agent to travel from the initial position to the target is displayed and recorded as part of the statistical analysis.
Simulation settings
Figure 4. Intelligent agent in one-way corridor situation
Figure 5. Normal agent in two-way corridor situation
Figure 5 shows a normal agent in a two-way corridor where some agents move from left to right while others move from right to left. The force is more balanced as compared to the one-way corridor. Since a normal agent is selected as the agent mode, there are no agents that are coloured in blue (agent or agents within the neighbourhood of the intelligent agent).
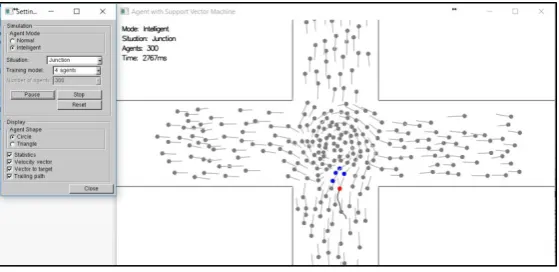
Figure 6. Intelligent agent in four-way junction situation
3.3 Discussion
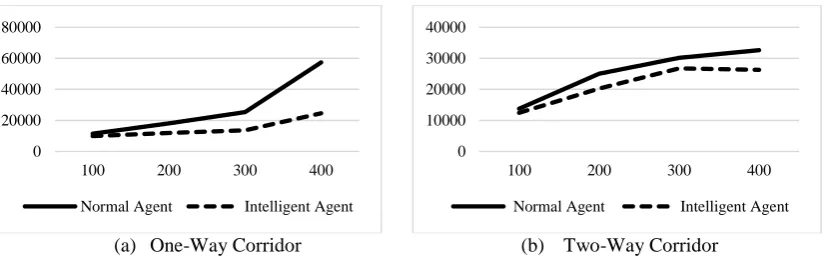
Based on the graph in Figure 7(a), when the number of agents is sparse (100 agents) in the one-way corridor, the intelligent agent reached the target at almost the same time as the normal agent. However, by increasing the number of agents from 200 to 400 and thus, making the scene more crowded, the result is different. The intelligent agent would reach the target faster than the normal agent. Similar analysis is also derived in the two-way corridor where the intelligent agent reaches the target in a shorter period of time as compared to the normal agent as shown in Figure 7(b). This shows that the intelligent agent is suitable to be used in crowded areas.
(a) One-Way Corridor (b) Two-Way Corridor
Figure 7. Comparison between normal agent and intelligent agent simulation based on number of agents
(a) 500 agents (b) 100 agents
Figure 8. Path trailing comparison in crowded and sparse areas
Figure 8 shows the trailing path between the crowded and sparse areas. Crowded areas have a higher force as compared to the sparse areas. This will make it more difficult for the intelligent agent to get to the target because there is a higher force from left to right. It can also be observed that the trailing path of the intelligent agent will be less direct in crowded areas as compared to the less crowded areas where its path to the target position will be more direct. This simulation shows that when the agents are in a crowded area, they will be more affected by the force surrounding them. Therefore, it will be more difficult for them to decide the best route to take.
4. CONCLUSION
Based on the findings obtained, the resulting simulator is proven useful to show the movement of normal agents and intelligent agents in a crowded environment. Some parameters can be altered in the control window to make it easier for the users to carry out the analysis based on the simulation results. In the future, as an addition to the three existing situations, other situations can also be included in this simulator, such as circular movement (i.e. ‘tawaf’) or random movement, to observe any differences.
ACKNOWLEDGEMENTS
The authors would like to acknowledge Universiti Tun Hussein Onn Malaysia (UTHM) for the funding of this work under the Tier-1 Research Grant (U849).
0 20000 40000 60000 80000
100 200 300 400
Normal Agent Intelligent Agent
0 10000 20000 30000 40000
100 200 300 400
REFERENCES
[1] C. Saloma, G. J. Perez, G. Tapang, M. Lim, and C. Palmes-Saloma, “Self-Organized Queuing and Scale-Free Behavior in Real Escape Panic,” Proceedings of the National Academy of Sciences, vol. 100, no. 21, pp. 11947– 11952, Oct. 2003.
[2] F. E. H. Wijermans, “Understanding Crowd Behaviour: Simulating Situated Individuals,” Ph.D Thesis, University of Groningen, Groningen, 2011.
[3] E. Altshuler, O. Ramos, Y. Núñez, J. Fernández, A. J. Batista-Leyva, and C. Noda, “Symmetry Breaking in Escaping Ants,” The American Naturalist, vol. 166, no. 6, pp. 643–649, 2005.
[4] X. Zheng, T. Zhong, and M. Liu, “Modeling Crowd Evacuation of a Building Based on Seven Methodological Approaches,” Building and Environment, vol. 44, no. 3, pp. 437–445, 2009.
[5] Z. Wang, “Public Evacuation Process Modeling and Simulatiaon based on Cellular Automata,” TELKOMNIKA (Telecommunication, Computing, Electronics and Control) , vol. 11, no. 11, pp. 6468–6476, 2013.
[6] N. Abdullasim, A. H. Basori, S. Hj, and S. Abdullah, “Velocity Perception : Collision Handling Technique for Agent Avoidance Behavior,” TELKOMNIKA (Telecommunication, Computing, Electronics and Control), vol. 11, no. 4, pp. 2264–2270, 2013.
[7] S. Mohamad et al., “Making Decision for the Next Step in Dense Crowd Simulation Using Support Vector Machines,” in Proceedings of the 15th ACM SIGGRAPH Conference on Virtual-Reality Continuum and Its Applications in Industry - VRCAI ’16, 2016, pp. 281–287.
[8] F. Mohd Nasir et al., “Simulating Group Formation and Behaviour in Dense Crowd,” in Proceedings of the 15th ACM SIGGRAPH Conference on Virtual-Reality Continuum and Its Applications in Industry - VRCAI ’16, 2016, pp. 289–292.
[9] M. Norzali, H. Mohd, Y. Nizam, S. Suhaila, and M. M. A. Jamil, “An optimized low computational algorithm for human fall detection from depth images based on Support Vector Machine classification,” pp. 407–412, 2017. [10] M. Kamal, A. Nor, I. Masazhar, and F. A. Rahman, “Classification of Leaf Disease from Image Processing
Technique,” Indonesian Journal of Electrical Engineering and Computer Science, vol. 10, no. 1, pp. 191–200, 2018. [11] M. Oshita and T. Yoshiya, “Learning Motion Rules for Autonomous Characters from Control Logs Using Support Vector Machine,” International Conference on Computer Animation and Social Agents 2010 (CASA 2010), Saint-Malo, France., 2010.
[12] T. Matsunaga and M. Oshita, “Recognition of walking motion using support vector machine,” Proc. ISICE, pp. 337– 342, 2007.
[13] D. Helbing and P. Molnár, “Social Force Model for Pedestrian Dynamics,” Physical Review E, vol. 51, no. 5, pp. 4282–4286, 1995.
[14] M. Moussaïd, D. Helbing, S. Garnier, A. Johansson, M. Combe, and G. Theraulaz, “Experimental Study of the Behavioural Mechanisms Underlying Self-Organization in Human Crowds,” Proceedings of the Royal Society of London B: Biological Sciences, vol. 276, no. 1668, pp. 2755–2762, 2009.