Testing: A Production Possibility Curve Cost
Model
Rafaqut Kazmi1, Imran Ghani1, Radziah Mohamad1, Murad Tariq1, Imran
Sarwar Bajwa2, and Seung Ryul Jeong3
1Faculty of Computing,
UniversitiTeknologi Malaysia (UTM), Johor Bahru 81300, Malaysia
e-mail: [email protected], [email protected], [email protected]@gmail.com
2Department of Computer Science& IT,
Islamia UniversityBagdad ul Jadeed Campus Bahawalpur Pakistan e-mail: [email protected] 3School of Management Information Systems,
Kookmin University, Seoul, Korea e-mail: [email protected]
Abstract
Testing is always important for Software Quality Assurance (SQA) activities and key cost multiplier in software development. The decision to automate or not to automate a test case is critical. In this paper we discuss the possibility of test automation and in relation to the trade-off between manual and automated test cases. We purpose a Production cost frontier based technique to distinguish the point of automation and manual test within the cost constraints. Our objective is to identify the facts that up to what extant a testing process can be automated. In this paper a cost model is proposed for deciding the proportion of automated and manual testing. The objective is to find best possible combination of these two and production possibility in one type by eliminating the other type of testing.
Rafaqut Kazmi 13
1 Introduction
Since the beginning of software history, the quality, cost and time to development of software applications is the prime concerns [1, 2]. Irrespective of the methods and techniques evolved for software construction, ensuring quality is functional testing through automation. However, the oldest and still most widely used is manual testing [3, 4]. Efforts have been made to increase the coverage and throughput of these techniques [5]. The challenging aspect is that some tests cannot or should not be made automatable[6] because some tasks needs extensive knowledge of domain like exploratory testing, user acceptance testing, release and deployment testing. With all of the techniques for automation little has been contributed to improve the effectiveness of manual testing. Testing teams always have to manipulate the test scripts, test data and bug tracking systems. The software application under test consuming time by switching resources. It also makes room for mistakes like inputting incorrect data[6]. Delayed Failures in Software Using High Volume Automated Testing or test process violations. The exact or approximate proportion between automated and manual testing techniques may increase the productivity and outcomes of testing process.
of the operating companies[20].Development teams in medium and large organizations often tests functionality by manual testing, the advantage of manual testing is testers learn applications which should help them in future releases, however testing teams apply semi-automatic testing even when automatic functional testing tools are available[21]. These semi-automatic techniques are useful for continuous and quick feature testing, short time slots of testing, less frequent tests and bug reporting. The decision about trade-off between automated and manual techniques should be made early in the project to avoid the problems [16]. In order to apply any such techniques, it is appropriate to follow a model. One such model was proposed by [22, 23],devised model helps to decide test automation ROI.
The objective of this paper is to identify the possibility of automation of manual test cases and attempt to simplify the purposed method to find trade-off between automated and manual testing with single and multiple goals of testing imposed due to cost, time and environmental constraints.
The organization of this paper is as follows. Section 2 discusses simple cost model about automation decision making. In section 3 we describe production possibilities curve frontier (PPF) in context of decision making for automating a test case. In section 4 the concept of establish a proportion between automated and manual test cases and also enlist some of limitations, objectives and benefits of this approach. Finally in section 5 we sum up the discussion and work.
2 Critiques on Cost Models
If the same function, feature or piece of code is tested in the same way by automation then there comes a point during the automation process when the tester stops finding the bugs. It is also worth to mention that 70% to 90% of new defects are found by manual testing. But Automation is necessary for continuous integration and regression testing .The model presented[22, 23] works fair enough for simple projects, however it should be flawed due to following observations.
1. The automated testing is not replacement of manual testing because all the testing steps may not be automated for example where the change frequency of requirement is high or where the extensive domain knowledge is for testing is required[6, 24].
2. Test suites needs time to produce valuable results. That is reason upfront cost of automated testing always high.[25]
3. All test executions supposed to be equally consume the resources.[26]
Rafaqut Kazmi 15
The authors of this paper searched for information from many software houses about their quality process. The following trends were found in the day to day business of software houses.
1. N-release during a day.
2. Automation as a business logo.
3. Continuous development.
4. Continuous integration.
5. Exploratory testing
6. Testing before release
7. Shrinking QA team agenda’s
Based on our observation of real life testing environments, it has been noticed that while performing automated testing, most of the testers just check if a given functionality is working; instead of actually testing that given functions. They conduct tests to verify a checklist of that piece of software under test. Another observation is that if they re-run the tests, they perform the same steps and nothing different or unexpected happens between the two executions,. The results are exactly the same. The alarming situation was discarding exploratory testing with automated tools. In order to reduce cost by discarding some testing phase is adding faults to released product. A research by [27]highlights this issue and explains the difference between automated and manual testing. The research says that automation testing is used to prevent further errors, while manual testing is a better choice to find new and unexpected errors. However, in the real life environment, we found out that the main misunderstanding found among the testers was to replace manual testing with automation. Automated and manual techniques are not replacement of each other. They should complement each other. Avoiding this principle causes cost issue.
The Return on investment (ROI) of test automation requires the analysis of cost and benefit involved. Nevertheless, test automation cost is hard to estimate due to changing factors[28]. Many industrial studies conducted include cost for testing tools, the labor for automating the tests, maintaining the automated testing framework. A case study which was published by [22] is presented [this sentence is a bit confusing] as fellows, This case study establish the testing costs by using universal cost formula. This model constructs cost for test automation as fallows.
=
D: = Expenditure for single test execution
' ≔ ) + ∗ , (1)
Where “Va” represent the cost for specification and automating the test case. “Da” is the cost for executing the test case one time, the “n” represent the number of executions of automating a test case.
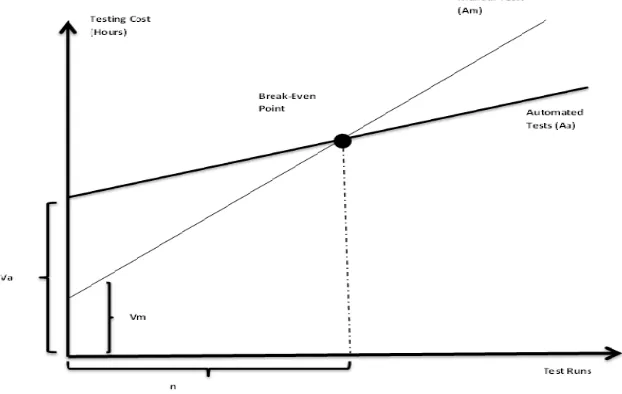
By using this technique, to calculate break-even point for test automation, the cost for manual test case execution is (Am). It is calculated as
' ≔ ) + , (2)
Here Vm is cost to specify the test case. Dm is cost to execute a test case manually and “n” is number of runs of a test case manually. The break-even point is computed, comparing cost of automated test case executions with the cost of manual test case executions.
-. ≔ /0
/1= -) + ,./-) + ,. (3)
By using this model, the test automation benefits are visible enough. In [15] elaborates that with economic point of view it is meaningful to automate a given test only, when the cost of automation is less than the cost of manual execution of the same or equal test case or test cases.
Fig 1: Break-Even Point with manual and automated test cases.
Rafaqut Kazmi 17
beginning as compared to manual test execution. As shown in Figure-1 break-even point reached at the intersection of two lines. This formula is known as universal formula which is reported many times in literature [29, 30] . Some other studies which support test automation[22, 31] are also mention the need of trade-off between automated and manual test cases. Depending on the author[22] , to achieve the break-even point, the number of test runs fluctuates between 2 to 20.The application of this formula in narrow context is fairly correct. They[14] apprehend the common observations that automated tests have high initial cost as compared to manual testing but provide reduced running cost of the test projects.
In the next section, present Production Possibility Curve(PPF) to estimate the trade-off between manual and automated testing with a single goal imposed here in terms of time(hours).
3. Production possibility curve for test
In this section a fictional example to elaborate possibilities of automation in testing, this example attempts to simplify a complex model to elaborate and clarify some primary ideas. We use the linear optimization model or linear programming method to solve this problem[32]. A mathematical optimization problem is one in which one function is maximized or minimized with respect to some there function within the same mathematical problem. The function is said to be objective function which is maximized or minimized under some certain constraints. The alternatives are said to constraints regions are alternative functions with respect to objective function. The production possibility frontier(PPF) is hypothetical representation of the amount of two different variables[33]. This PPF curve obtained by shifting resources from the production of one , to the production of other[33]. In this study we use PPF curve to find the trade-off between automated test cases to manual test cases. Linear programming or linear optimization method is very useful to solve optimization problems. A few examples where linear optimization is useful are resource allocation[34], layout [35], production scheduling[36], warehousing and inventory[37]. We also try to add some reasoning in coming sections and purpose influencing factors which typically found in real world projects.
The cost is varying with type of the software under development. But one common attribute all these types should carry substantial increase in project costs by carrying bugs or problems from one development phase to another or one release to another release. According to a study[41] cost of finding and fixing a bug during implementation phase is $977. Thus total cost of finding and fixing 200 critical bugs is 200X977 = $195,400. Similarly the cost of fixing a bug during system testing is $7,136, if system testing finds only 50 critical bugs then cost to fix these bugs is $356,800. So this indicates that that healthy bug rate can save already shrinking costs of testing.
In this example we consider small software system. The effort to run a test case with manual technique is 0.25 hours in average. To keep this discussion simple we assume that initial cost is zero for test case specification and definition. Automation cost of a test case is 1 hour in average. This should include the cost of implementation and maintenance cost of automated test cases in reply to specifications changes. Here we assume that no extra cost is required for test case execution after automation. According to the above mentioned universal formula, the break-even point for a single test is reached when a test has been run five times.
In this example, let us suppose that there are 100 test cases. These 100 test cases are sufficient to acquire 100% requirement coverage. In order to test the software to acquire 100% coverage, (we need 20 hours with manual testing or 100 hours of automated testing). By comparison of these (Figure-2), the time necessary to automate all the test cases is equal to execute all the test cases manually five times.
If we suppose that project follows an iterative development[42] or agile development[43], we may need to test consecutive releases. For the simplicity, we suppose that there are 8 releases which we may test. Each release needs the same test cases. So to test all 8 releases require 160 hours of manual testing or 100 hours to automate these tests.
Rafaqut Kazmi 19
Fig: 2 Break-Even Point keeping automated Tests without overhead costs.
There is also one more point of view that 100% testing is not possible. There are many projects in industry which are survived with such limitations. Some common pressures observed during testing projects are limited budget, less time to market and strict deadlines. These projects are survived only by producing quality by balancing and combining automated and manual testing techniques.
This hypothetical situation for the project under test neither possible, testing all releases manually nor automatically. Measuring the trade-off between automated and manual testing is required for such situation. One such measurement of trade-off is known as Production Possibilities Frontier (PPF) mentioned by[44].
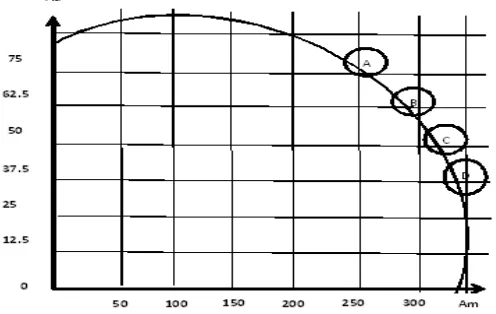
Fig: 3 presents the combination of manual and automated test cases by which testing can possibly carried out, within the limits of available budget and possible choices from automated and manual tests. Any combination of automated and manual test cases proportion on or inside the frontier is possible. Points outside the frontier are not feasible due to the budget restriction. The combinations of points on the graph line are called efficient points because of maximum possible utilization of the resources while the points inside the graph are inefficient because some resources may waste.
Fig 3: Production Possibilities Frontier Curve for budget of 75 hours.
1. If we automate a test case, what portion of manual tests we lose or skip?
2. What we will gain by automation?
3. Is there any exact proportion between automated and manual test cases on the production possibilities curve?
If we move from point “A” to point “B” on the production curve, there is possibility of more and more test cases are automated on the expense of less manual tests. In order to move from point “A” to point “B”. There are almost 100 manual test executions can be eliminated. We can say that by automating one test case reduce the cost of 4 manual test runs.
4.
A Proportion Ratio Based on Production Possibility
Curve
Based on the example scenario elaborated in previous section. We propose a model from linear optimization[37]. This model in our case uses the concept of opportunity cost to find a trade-off between automated and manual testing. This model sustained in automating a test case is estimated on basis of replacing the manual test cases. This is done with keeping the budget limits under consideration. The model presented in Section:2, which focuses on single test case run. Proposed model focus on all potential test cases. Furthermore it optimizes the ROI in automated testing.
4.1
Test Automation Limits
Rafaqut Kazmi 21
discussion depends solely on the example we have described in Section: 3. It is also explained in section:3 that if we automate one test case can skip 4 manual test cases in general. It is assumed that we should ignore cost variables for the sake of simplicity. Thus the opportunity cost for one automated test case is 5 manual test executions.
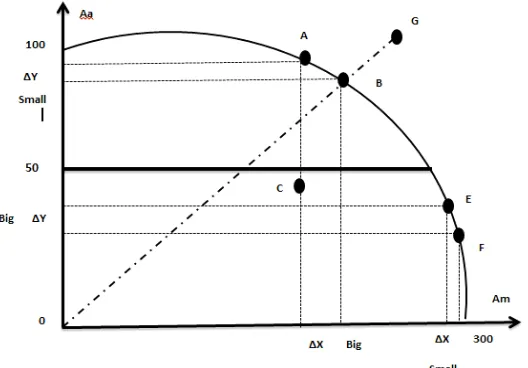
In Fig 4, the x-axis is representing manual test executions (Am). Where 300 manual test executions are possible in 75 hours as assumed in our case. The Y-axis is representing automated test executions; there are 75 manual test executions possible in 75 hours. The points “A”, “B”, “E” and “F” on PPF curve are efficient points and achievable in current restrictions. The point “C” which inside is inside the PPF curve is possible to achieve but inefficient point because some resources will be wasted with this combination of automated and manual test cases. The point “G” outside the PPF curve will not be achieved within the current restrictions. The line “OG” is indicating the objective line of the project, the desired ratio between “Aa” and “Am” under restriction of specific to project conditions.
Fig 4: Production Possibilities Frontier Curve for Aa to Am Proportion.
Case I: If we move on the curve from point A to point “B”, reducing a small number of automated test cases can results to vacate the resources for a large number of manual test execution within the same cost limits. It is shown that in Figure 4, at the top of the curve, small reduction in “Aa” producing a big increase in “Am”.
5.
Result and Discussion
From economic point of view it seems reasonable to automate a desired number of test cases. In this particular scenario, it is clear that moving on the curve from Aa maximum to “A”, produces a big reduction in “Am” on x-axis and it is far away from the project goal which is in this case is testing time. Consider moving from “Am” maximum to “E” produce small change in manual test cases in number and create a big addition in automated test and it is also far away from the project goal. So keeping this model we conclude that the best possible ratio for automated and manual tests is from point “H” to point “B” which is in this case is 50% to 70%. This is possible to make it further narrow down by adding more constraint. Few of which are
1. System architecture under testing.
2. QA team skills.
3. Requirement stability.
4. Coverage objectives of Testing.
5. Available testing time and budget.
5.1
The Benefits and objectives
To understand this alternative based on PPF opportunity cost model, we evaluate benefits each of them. The test case execution benefits are measured on the basis of information that is reveals by its execution. The information mainly consist of bug detection, requirement conformance to specification, coverage details etc. This information is used by SQA decision making process as well as test execution results.
In this study we suppose that the test case benefit is its risk mitigation capability, fault detection capability of testing strategy and coverage criterion n of testing techniques. It is also worth to mention that automated and manual tests are addressing different risk types, fault range and coverage goals. Automated test are best suitable for repetitive tasks usually regression tasks while manual tests can be suitable for new classes of risks, bugs and changed specifications related to functional testing. We suggest risk mitigation, bug detection criteria and code or functional coverage can be measured on the basis of risk exposure[45]. The risk mitigation also depends upon test case ordering with respect to their risk exposure contribution[46] which may further refined with respect to code and functional coverage and code and specification changes.
Rafaqut Kazmi 23
based testing in[46, 47], fault detection capability[48],code and specification changes[49],function coverage[50] and code coverage[51].
6.
Conclusion
The manual and automated testing is being used in exact proportion. The decision of automating the test cases or not to automate them is always important and critical for the success of automation projects. There is need for research on trade-off between automated and manual test cases contrast with test case selection, test case reduction, test case prioritization and test case augmentation techniques. The rationale behind this merger is to identify those already automated test cases to execute manually or some manual test cases in previous test suite need to automate for new objectives like code changes, specification changes, coverage criterion or cost and time issues. This dynamic trade-off between automated and manual test cases may enhance the fault identification capability, risk mitigation and cost and time issues with these techniques. The PPF curve shows the possibility of best proportions of automating test case with manual test cases. In this study we conclude the following
1. Cost of testing is considered and indirect costs are not included in this study.
2. This model considers only a single project decision making.
3. Indicating the best possible proportions between two testing types manual and automated.
4. Comparing replacement of one type, production possibility of the type of testing with the other.
5. A single objective testing time considered in this study.
On later stages the addition of cost variables and multiple objectives cost proportions between the automation and manual test may increase the usefulness of this model. This is also possible to make this method part of existing test suite optimization techniques to enhance their capabilities. The decision of automation of some or all test cases in a test suite is not one time decision. This decision may be needed before each execution of a test suite.
ACKNOWLEDGEMENTS.
We would like to thank Universiti Teknologi Malaysia and Ministry of Science, Technology and Innovation (MOSTI) Malaysia (Vot No: 4S113)
References
[2] Royce, W.W. Managing the development of large software systems. in
proceedings of IEEE WESCON. 1970: Los Angeles.
[3] Gollomp, B. and P. Gallo, Test Procedure Language Development. Aerospace, IEEE Transactions on, 1963. 1(2): p. 1327-1334.
[4] Haugk, G., S. Tsiang, and L. Zimmerman, System testing of the no. 1 electronic switching system. Bell System Technical Journal, 1964. 43(5): p. 2575-2592.
[5] Naik, S. and P. Tripathy, Software testing and quality assurance: theory and practice. 2011: John Wiley & Sons.
[6] Kazmi, R., R.M. Afzal, and I.S. Bajwa. Teeter-totter in testing. in Digital Information Management (ICDIM), 2013 Eighth International Conference on. 2013: IEEE.
[7] Harrold, M.J. Testing: a roadmap. in Proceedings of the Conference on the Future of Software Engineering. 2000: ACM.
[8] Saglietti, F. and F. Pinte. Automated unit and integration testing for component-based software systems. in Proceedings of the International Workshop on Security and Dependability for Resource Constrained Embedded Systems. 2010: ACM.
[9] Kansomkeat, S. and W. Rivepiboon. Automated-generating test case using UML statechart diagrams. in Proceedings of the 2003 annual research conference of the South African institute of computer scientists and information technologists on Enablement through technology. 2003: South African Institute for Computer Scientists and Information Technologists.
[10]Coelho, R., et al. Jat: A test automation framework for multi-agent systems. in Software Maintenance, 2007. ICSM 2007. IEEE International Conference on. 2007: IEEE.
[11]Dallal, J. Automation of object-oriented framework application testing. in
GCC Conference & Exhibition, 2009 5th IEEE. 2009: IEEE.
[12]Leitner, A., et al. Reconciling manual and automated testing: The autotest experience. in System Sciences, 2007. HICSS 2007. 40th Annual Hawaii International Conference on. 2007: IEEE.
[13]Shan, L. and H. Zhu, Generating structurally complex test cases by data mutation: A case study of testing an automated modelling tool. The Computer Journal, 2009. 52(5): p. 571-588.
Rafaqut Kazmi 25
[15]Karhu, K., et al. Empirical observations on software testing automation. in
Software Testing Verification and Validation, 2009. ICST'09. International Conference on. 2009: IEEE.
[16]Persson, C. and N. Yilmazturk. Establishment of automated regression testing at ABB: industrial experience report on'avoiding the pitfalls'. in Automated Software Engineering, 2004. Proceedings. 19th International Conference on. 2004: IEEE.
[17]Liu, C. Platform-independent and tool-neutral test descriptions for automated software testing. in Proceedings of the 22nd international conference on Software engineering. 2000: ACM.
[18]Fecko, M.A. and C.M. Lott, Lessons learned from automating tests for an operations support system. Software: Practice and Experience, 2002. 32(15): p. 1485-1506.
[19]Torkar, R. and S. Mankefors. A survey on testing and reuse. in Software: Science, Technology and Engineering, 2003. SwSTE'03. Proceedings. IEEE International Conference on. 2003: IEEE.
[20]Ko, A.J., B. Dosono, and N. Duriseti. Thirty years of software problems in the news. in Proceedings of the 7th International Workshop on Cooperative and Human Aspects of Software Engineering. 2014: ACM.
[21]Mahmud, J., et al., Design and industrial evaluation of a tool supporting semi‐ automated website testing. Software Testing, Verification and Reliability,
2014. 24(1): p. 61-82.
[22]Linz, T. and M. Daigl, GUI Testing Made Painless. Implementation and results of the ESSI Project, 2007(24306).
[23]Hoffman, D., Cost benefits analysis of test automation. 1999.
[24]Berner, S., R. Weber, and R.K. Keller. Observations and lessons learned from automated testing. in Proceedings of the 27th international conference on Software engineering. 2005: ACM.
[25]Dustin, E., J. Rashka, and J. Paul, Automated software testing: introduction, management, and performance. 1999: Addison-Wesley Professional.
[26]Ramler, R. and K. Wolfmaier. Economic perspectives in test automation: balancing automated and manual testing with opportunity cost. in Proceedings of the 2006 international workshop on Automation of software test. 2006: ACM.
[28]Boehm, B.W., Value-based software engineering: Overview and agenda, in Value-based software engineering. 2006, Springer. p. 3-14.
[29]Link, J., Unit testing in Java: how tests drive the code. 2003: Morgan Kaufmann.
[30]Fewstar, M. and D. Graham, Software Testing Automation: Effective use of test execution tools. 1999, ACM Press, Addison Wesley.
[31]Schwaber, C. and M. Gilpin, Evaluating automated functional testing tools.
Forrester Research, 2005.
[32]Bertsimas, D. and J.N. Tsitsiklis, Introduction to linear optimization. Vol. 6. 1997: Athena Scientific Belmont, MA.
[33]MANNING, R., production-possibility frontier. Production Sets, 2014: p. 51.
[34]Shen, Z., J.G. Andrews, and B.L. Evans, Adaptive resource allocation in multiuser OFDM systems with proportional rate constraints. Wireless Communications, IEEE Transactions on, 2005. 4(6): p. 2726-2737.
[35]Reinschmidt, K.F. and A.D. Russell, Applications of linear programming in structural layout and optimization. Computers & Structures, 1974. 4(4): p. 855-869.
[36]Simon, F.Y.-P. and Y. Takefuji. Integer linear programming neural networks for job-shop scheduling. in Neural Networks, 1988., IEEE International Conference on. 1988: IEEE.
[37]Ramanathan, R., ABC inventory classification with multiple-criteria using weighted linear optimization. Computers & Operations Research, 2006. 33(3): p. 695-700.
[38]Cai, X. and M.R. Lyu. The effect of code coverage on fault detection under different testing profiles. in ACM SIGSOFT Software Engineering Notes. 2005: ACM.
[39]Elbaum, S., A. Malishevsky, and G. Rothermel. Incorporating varying test costs and fault severities into test case prioritization. in Proceedings of the 23rd International Conference on Software Engineering. 2001: IEEE Computer Society.
[40]Elbaum, S., et al., Understanding the effects of changes on the cost‐ effectiveness of regression testing techniques. Software Testing, Verification and Reliability, 2003. 13(2): p. 65-83.
[41]Lazic, L. and N. Mastorakis, Cost effective software test metrics. WSEAS Transactions on Computers, 2008. 7(6): p. 599-619.
Rafaqut Kazmi 27
[43]Hanssen, G.K., A longitudinal case study of an emerging software ecosystem:
Implications for practice and theory. Journal of Systems and Software, 2012. 85(7): p. 1455-1466.
[44]Nicholson, W. and C. Snyder, Microeconomic theory: basic principles and extensions. 2011: Cengage Learning.
[45]Fairley, R.E., Software risk management. IEEE SOFTWARE, 2005. 22(3): p. 0101.
[46]Rothermel, G. and S. Elbaum, Putting your best tests forward. Software, IEEE, 2003. 20(5): p. 74-77.
[47]Biffl, S., et al., Value-based software engineering. Vol. 1. 2006: Springer.
[48]Jeffrey, D. and R. Gupta, Improving fault detection capability by selectively retaining test cases during test suite reduction. Software Engineering, IEEE Transactions on, 2007. 33(2): p. 108-123.
[49]Ryder, B.G. and F. Tip. Change impact analysis for object-oriented programs. in Proceedings of the 2001 ACM SIGPLAN-SIGSOFT workshop on Program analysis for software tools and engineering. 2001: ACM.
[50]Gross, F., G. Fraser, and A. Zeller. Search-based system testing: high coverage, no false alarms. in Proceedings of the 2012 International Symposium on Software Testing and Analysis. 2012: ACM.