Performance Analysis Of The Voltage Source
Converter Based High Voltage Direct Current
Link On Small Signal Stability
Lorian M. Mbaabu, Keren K. Kaberere, P.K. HingaAbstract— In modern power systems, demand for quality, reliable and secure electric power has led to many power utilities opting for grid interconnection. Despite many advantages of grid interconnections, low-frequency oscillations mainly inter-area mode oscillations are inherent in interconnected grids. If there is no proper mechanism in the system to damp out these power oscillations, they can cause power blackout. The conventional method commonly used for power oscillation damping is based on power system stabilizers (PSS). PSSs are very effective for local mode oscillations but has proven to be ineffective for inter-area mode oscillations especially in large interconnected system. Many power utilities employ Voltage Source Converter, High Voltage Direct Current links (VSC-HVDC) for electrical power transmission because of its many advantages, for example, the ability to rapidly control active power and reactive power independently with little need for compensation. With proper control, VSC-HVDC can improve inter-area mode oscillations damping on transmission level. In this paper, the design of VSC-HVDC together with its controllers is done in DIgSILENT simulation software. Modal analysis simulations were performed on a two-area four generator system with and without the VSC-HVDC system. The results illustrate that the use of the VSC-HVDC link as a tie-line improves system small signal stability.
Index Terms—Grid interconnection, Inter-area mode, Local mode oscillations, Low frequency oscillations, Modal Analysis, Small signal stability, VSC-HVDC system.
—————————— ——————————
1 I
NTRODUCTION GROWING demand for reliable, secure and quality power has led to the interconnection of the electric grids which makes the power system very large and complex. The complexity and non-linearity of the power system are rapidly increasing due to the development of new technologies including power electronics devices which leads to the addition of more loads, generator and control equipment and the growth in interconnections [1-3]. As the complexity of the system increases, power system stability becomes the main issue in the power industry. Much attention is needed on the potential oscillation problems that may directly affect the system stability [3]. HVDC is considered as a convincing solution to many power system problems due to its capability to interconnect asynchronous systems and transmission of bulk power over long distant with reduced losses[4] In large scale interconnected systems, small magnitudes disturbances are very common and low frequency oscillations due to additional or removal of loads or occurrence of line and generator outages is a major problem. Low frequency oscillations are machines rotor angle oscillations in the frequency range from 0.1-2.0 Hz which occurs because of insufficient damping torque[5]. Oscillations mode instability can lead to large-scale system disturbances in case cascading outages of power system equipment ensues because of oscillatory power swings, like August 10, 1996, Western North America blackout [5-6].Power system low frequency oscillations are typically divided into two groups depending on its global (or local) scale; (1)
inter-area oscillations where generators in the same area oscillates against machines in different area with frequency range between [0.1- 0.7] Hz and (2) local-area or inter-machine oscillations involve generators which are located close to each other with frequency range [0.7 - 2.0] Hz[5]. These phenomena in power systems can be analyzed using modal analysis technique [5] and the problem can be solved with the installation and proper tuning of flexible AC systems (FACTs) devices, PSS and supplementary control of HVDC links in the system [7]. PSS is quite effective for damping out local mode oscillations but less effective for inter-area oscillations [5, 8] which are inherent in interconnected grids. On the other hand, use of FACTs devices in transmission system improves the stability of the existing network and provide some operating flexibilities[9]. However, many FACTS controllers and line commutated converter based HVDC (LCC-HVDC) links can control only one variable. VSC-HVDC systems are alternatives that have two degrees of freedom[10-11] . Due to its fast-active power (P) and reactive power (Q) control, utilization of VSC-HVDC with suitable control scheme can alleviate such oscillations in the power system. This property gives VSC-HVDC capability to improve transient stability, enhance damping and control the power flow effectively. In the case where is a need for transmission network expansion, VSC-HVDC is gaining great consideration due to the dynamics benefits and the development of turn off capable valves which reduces commutation failure problem[4,11,12]. This study dwells on the control of VSC-HVDC based solutions interconnecting weak HVAC systems for improving power systems low frequency oscillation damping. It focuses more on inter-area mode oscillations due to its far-ranging influence on the whole system. Damping of power system oscillation has always been a significant consideration for the stability of power systems.
————————————————
1720
2
VSC-HVDC
SYSTEM AND CONTROL SCHEME COMPONENTSControl of the VSC-HVDC system is a very critical part as it is the one that ensures the transmission of scheduled active power through the HVDC link and maintains the acceptable limits of the systems voltage through reactive power control. The commonly used methods for VSC-HVDC control are the direct method and the Vector method [13]. The Vector Control strategy which involves transforming quantities in three-phase to two coordinate (α,β) stationary system through Clark's transformation and then further to dq-rotational reference frame quantities through Park's Transformation is used in this study. Similarly, through inverse Clark- Park's transformation the dq-rotational reference frame quantities are transformed back to quantities in three-phase[10].
The dq-rotational reference frame is rotating at system frequency which makes the dq-quantities appear as constant DC quantities. This transformation gives the following advantages [10]:
Analyzing of DC quantities which is easier than analyzing AC equivalent.
The comparison of DC quantities results in static errors that the application of a simple PI controller can easily eliminate.
It enables decoupled control ability that makes possible independent control of P and Q. The quantities decoupling enables cascaded control strategy which in turn improves system performance.
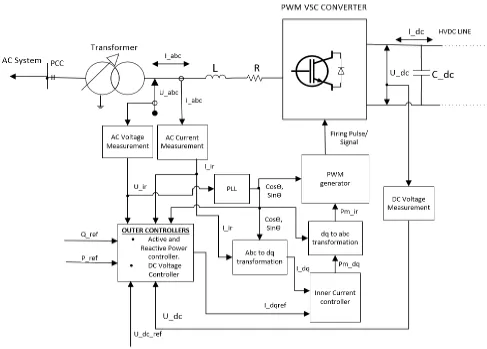
VSC-HVDC cascaded control method is made up of two levels control loop which is comprised of the outer controllers and inner current controller as given in Fig. 1
Apart from the DC voltage controller, other outer controllers to be used are selected based on their application. These outer controllers are used to supply AC current references to the inner current controller.
Design for rectifier and inverter controllers are identical. Each VSC converter has two degrees of freedom which imply it can control two variables. In this study, the dc voltage and Q are variables used to control the rectifier side converter whereas P and Q are used in the inverter side converter. All blocks in Fig. 1 are discussed as follows.
2.1 Voltage and Current Measurement Devices
The voltage measurement device is used to measure the voltage at AC/DC terminals and cubicles. The measured voltage can then be fed as the input signal into a controller. Its outputs are both real part ur and imaginary part ui of positive sequence voltage [14].
The Current measurement device is used to measure the current flow at a cubicle of any element, which is connected to a terminal/busbar. The measured current can then be fed into a controller. The direction of the current flow for loads, motors and passive elements like transmission lines and transformers is always in the same as the direction of active power flow. Its output are both real part ir and imaginary part ii of positive sequence current [15].
2.2 Phase-Locked Loop (PLL)
The PLL measures the frequency and phase of a voltage in the system. They are widely used for the synchronization of the converter control with the line voltage and locking the dq-axis to the phase of the voltage. They use voltage at the selected Measurement point as inputs and it outputs are both cosθ and sinθ.[16].
2.3 Inner Current Control Loop
It is used for controlling the AC current from the current measurement device transformed into dq-axis currents and its current references value supplied by outer controllers.
Fig. 2. The inner current controller block diagram with the decoupling term
This block contains PI regulators, Feed- forward blocks and decoupling factors as shown in Fig.2. The PI regulators transform the error between the comparison of d and q parts of measured current and the d and q parts of current reference value from outer controllers into a voltage value. This voltage signal is used by the PWM generator as a firing pulse for switching the converter.
The switching frequency of PWM should be much large than the system’s frequency so that the size of the filters needed for generated harmonics elimination is reduced[10]. In this paper, the PWM converter switching frequency of
10000Hz is selected. The inner current can be represented by
an equivalent reduced form shown in Fig.3.
Fig. 3.The inner current controller equivalent block diagram
2.4 Outer Loop Controllers
The outer loop controllers comprise of the DC voltage controller, AC voltage controller, active power controller and reactive power controller as shown in Fig.1.
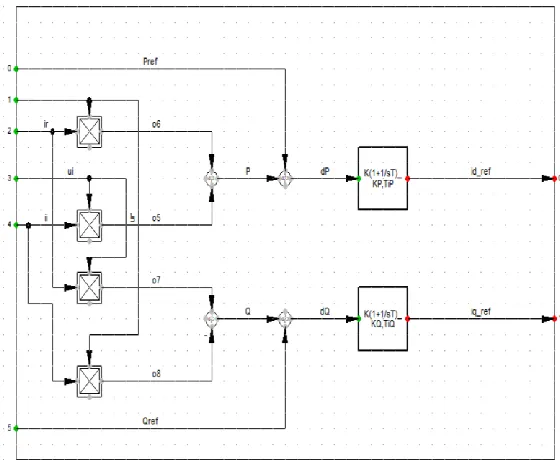
2.5.1 Active and Reactive Power (PQ) controller
Active and reactive power controllers are generally the proportional integral (PI) controllers as shown in Fig.4. Their main function is to control the power exchange between the converter and the system.
The P-controller gives the reference value for the d-axis current while the Q-controller provides reference value for the
reactive/q- axis current that is fed to the inner current control loop.
Fig. 4. The active and reactive power control block diagram
2.5.2 DC voltage control loop
1722 Fig. 5. DC voltage control block diagram
3
T
WOA
REAF
OURG
ENERATOR(2
A4
G)
T
ESTS
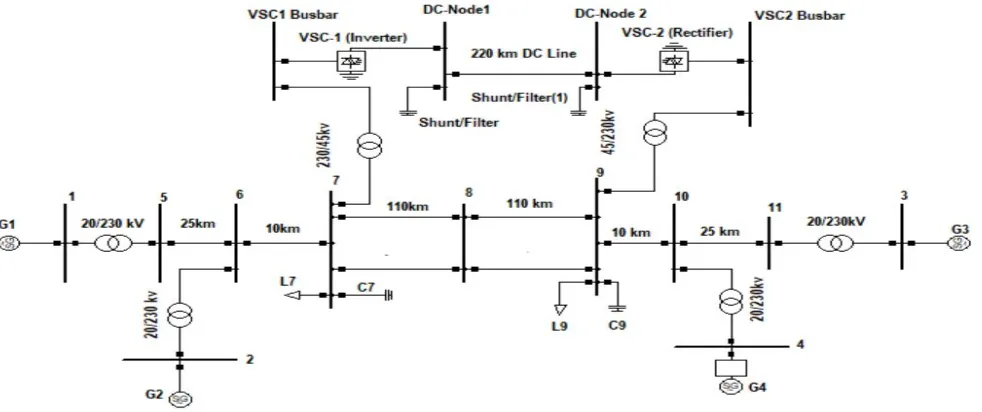
YSTEM The 2A4G system shown in Fig.6 below was used in the studies. It is frequently used as a benchmark system for small signal stability studies[8].Fig. 6. Two-area four-generator (2A4G) system
This system was originally developed by Ontario Hydro with the intention of exhibiting power oscillations types that occurs in weak power systems and studying the fundamental nature of inter-area oscillations[8]. It consists of two similar area connected by 220KM weak double tie line with area 1 transferring 400MW to area 2. The generator units are equipped with an automatic voltage regulator (AVR) and a power system stabilizer (PSS). The HVAC system data used are as given in [5].
4
SMALL
SIGNAL
STABILITY
TEST
CRITERIA
The Modal analysis determines the eigenvalues of the system which can either be real or complex and they are associated with system modes given by [5]:j
(10)
The complex eigenvalues correspond to oscillatory modes and are of particular interest in power system. For oscillatory mode's value, the frequency of oscillation (f) and damping ratio ( can be found as [5]:
2
f
(11)
2 2
(12)
For a given oscillation mode, the damping ratio must have a high positive value for an acceptable stability margin. For the system to be considered stable all eigenvalues must be negative and the minimum value of damping ratio must be greater than 5%. For sufficient damping and stability margin, the damping ratio must be greater than 15% [17-18].
5
SIMULATION
RESULTS
AND
DISCUSSION
This section describes the simulation carried. Fig.7 shows the test system incorporating the VSC-HVDC link modeled for this study. The VSC-HVDC parameters are given in Table I.
TABLE 1 VSC-HVDC Link parameters
Item Values
Length of HVDC link 220km
HVDC link resistance 0.003527 Ω/km HVDC link capacitance 536.4862 μF
HVDC link base power 450 MVA VSC-1 reactive power setpoint 207 MVAr VSC-2 reactive power setpoint 257.6 MVAr VSC-2 Active power setpoint 381.6MW Base power of the converter
transformer
900MVA
Equivalent inductance of the transformer
23.29mH
Equivalent inductance of the transformer
0.058778 Ω
HVDC link capacity (MW) 400MW
The VSC control system shown in Fig.1 was implemented using DIgSILENT PowerFactory simulation software. Small perturbation responses of the systems considering three cases described below were studied. During simulations, Modal Analysis was carried out with variables of interest being damping frequency, eigenvalues and damping ration of the critical oscillatory modes.
5.1 Case I: Pure HVAC System
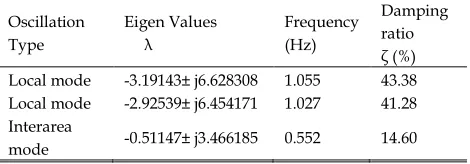
The 2A4G test system was developed and modal analysis carried out without incorporating the HVDC link which produces the results shown in Table 2. Three critical modes were observed with one inter-area mode and two local modes. It is observed that the local modes are well damped but the damping ratio of inter-area mode is 14.6% which is less than 15% considered for acceptable stability margin in many utilities.
TABLE 2 Modal analysis results without VSC-HVDC link
Oscillation Type
Eigen Values λ
Frequency (Hz)
Damping ratio ζ (%) Local mode -3.19143± j6.628308 1.055 43.38 Local mode -2.92539± j6.454171 1.027 41.28 Interarea
5.2 With VSC-HVDC transmitting 50% of active power The 2A4G system incorporating a VSC-HVDC link with its controllers was modeled. One tie line of the 2A4G was replaced with VSC-HVDC link in parallel with the remaining line between bus 7 and 9. The VSC-HVDC system is transmitting half of the total power transferred from area 1 to area 2.
Modal analysis results shown in Table 2, show there are three critical modes as in the case of a pure AC system. The
damping ratio of inter-area mode is 14.97% which is greater than 14.6% of the pure HVAC system but is less than 15% considered for better stability margin.
This indicates that grid interconnection based on the VSC-HVDC system has better controllability and power oscillation damping capability.
Fig. 7. Two-area four-generator (2A4G) system incorporating VSC-HVDC link
TABLE 3 Modal analysis results of HVDC/HVAC interconnectors
Oscillation Type
Eigen Values
λ Frequency (Hz)
Damping ratio ζ (%) Local mode -2.22177± j6.003014 0.955 34.71 Local mode
-2.57147 ±j5.351071 0.852 43.31
Interarea
mode -0.54772±j3.618419 0.576 14.97
5.3 Case III: With only VSC-HVDC as a transmitting tie line
Here the tie-lines between area 1 area 2 were replaced by VSC-HVDC interconnector.
TABLE 4 Modal analysis results of VSC-HVDC interconnectors
Oscillation Type
Eigen Values
λ
Frequency
(Hz)
Damping ratio
ζ (%) Local mode -2.26379 ± j6.027593 0.959 34.43 Local mode -2.59824 ± j5.318182 0.846 43.90 Interarea
mode
-0.60114 ± j3.74555
0.596 15.32
Table 4 shows that still there are two local modes and one
inter-area mode. The damping ratio of the interarea mode is 15.32% which is greater than the 15% considered for acceptable stability margin. This is equivalent to 4.93% increase in damping ratio. This indicates that pure VSC-HVDC has better damping capability of the power oscillations.
C
ONCLUSIONIn this study, small signal stability improvement was analyzed with the VSC-HVDC transmission system connected. Three case studies were analyzed. These are pure HVAC system, the hybrid system, and VSC-HVDC system. The inter-area mode damping ratio of the system using the VSC-HVDC link only as the tie line is 15.32% which is greater than 15% considered as good for better stability margin. This shows that the incorporation of the VSC-HVDC link improves the damping ratio of the inter-area mode from 14.6% to 15.32% which is approximately 4% improvement as compared to the pure HVAC system. This indicates small signal stability improvement and proves that the VSC-HVDC system with its controllers is better suited for different power systems interconnection projects.
A
CKNOWLEDGMENT1724
R
EFERENCES[1] L. Zhang, L. Harnefors, and H. P. Nee, ―Interconnection of two very weak AC systems by VSC-HVDC links using power-synchronization control,‖ IEEE Transactions on Power Systems, vol. 26, no. 1, pp. 344–355, 2011.
[2] J. Shuai, ―Placing of VSC-HVDC Lines in a Meshed AC-Network,‖ Swiss Federal Institute of Technologh Zurich, 2012.
[3] T. J. G. Magallones and J. G. Singh, ―Power flow and small signal stability analysis on the interconnected Philippine power grid,‖ Perspectives in Science, vol. 8, pp. 589–591, 2016.
[4] R. S. Narayan, ―Simulative Study into the Development of a Hybrid HVDC System Through a Comparative Research with HVAC : a Futuristic Approach,‖ Engineering Technology & Applied Science Research, vol. 7, no. 3, pp. 1600–1604, 2017. [5] P. Kundur, Power System Stability and Control. New
York, USA: McGraw-Hill, 1994.
[6] H. F. Latorre and M. Ghandhari, ―Improvement of power system stability by using a VSC-HVdc,‖ International Journal of Electrical Power and Energy Systems, vol. 33, no. 2, pp. 332–339, 2011.
[7] ―2017 Was A Fantastic Year For HVDC Technologies.‖
[Online]. Available:
https://www.tdworld.com/hvdc/2017-was-fantastic-year-hvdc-technologies. [Accessed: 06-Oct-2018]. [8] M. Klein, G. J. Rogers, and P. Kundur, ―A fundamental
study of inter-area oscillations in power systems,‖ IEEE Transactions on Power Systems, vol. 6, no. 3, pp. 914–921, 1991.
[9] M. M. Alomari and M. Abdul-niby, ―Hopf Bifurcation Control of Subsynchronous Resonance Utilizing UPFC,‖ Engineering Technology & Applied Science Reaearch, vol. 7, no. 3, pp. 1588–1594, 2017.
[10] C. Du, M. H. J. Bollen, E. Agneholm, and A. Sannino, ―A new control strategy of a VSC-HVDC system for high-quality supply of industrial plants,‖ IEEE Transactions on Power Delivery, vol. 22, no. 4, pp. 2386–2394, 2007.
[11] H. F.Latorre, ―Modeling and Control of VSC-HVDC Transmissions,‖ Royal Institute of Technology, 2011. [12] O. Lennerhag, ―Modelling of VSC-HVDC for Slow
Dynamic Studies,‖ 2013.
[13] J. K. Muriuki, C. M. Muriithi, L. Ngoo, and G. Nyakoe, ―Assessment of VSC-HVDC System for Transient Stability Improvement of a Power system with Large Wind Power Injection .,‖ vol. 11, no. 6, pp. 63–75, 2016.
[14] DIgSILENT GmbH, ―DIgSILENT PowerFactory
Technical Reference Documentation Voltage Measurement.‖ DIgSILENT GmbH, Gomaringen, Germany, 2015.
[15] DIgSILENT, ―DIgSILENT PowerFactory Technical Reference Documentation Current Measurement.‖ DIgSILENT GmbH, Gomaringen, Germany, 2015. [16] DIgSILENT, ―DIgSILENT PowerFactory Technical
Reference Documentation Phase Measurement Device ElmPhi pll.‖ DIgSILENT GmbH, Gomaringen, Germany, 2015.
[17] R. Graham, POWER SYSTEM OSCILLATIONS.
Boston//London/Dordrecht: Kluwer Academic Publishers, 2000.