Three-Way Autocatalysts
Effect of rhodium loading outweighs that of platinum or palladium
http://dx.doi.org/10.1595/147106713X671457 http://www.platinummetalsreview.com/
By Jonathan Cooper* and Joel Beecham
Johnson Matthey Emission Control Technologies, Orchard Road, Royston, Hertfordshire SG8 5HE, UK
*Email: [email protected]
The price differential between platinum and palladium has driven the industry to adopt emissions control catalyst formulations for gasoline engines that contain higher levels of Pd than Pt, and in most cases no Pt. In addition fl uctuations in the price of rhodium have led to thrifting of this metal. This study compares the performance of ten different catalyst compositions with varying ratios of Pt, Pd and Rh for a Euro 5 vehicle and under bench test conditions. The results show that a system with low Rh loading can readily be improved by increasing the Rh loading and there is a relatively large effect of doing this by a small amount. Increasing the Pd or Pt loading also improves emissions performance but by a signifi cantly smaller amount than the effect of changing the Rh loading. Conversely it may be possible to decrease the Pt or Pd loading with only a small effect on emissions. Furthermore it was found that Pd outperforms Pt under most conditions, although not signifi cantly. The difference appears greater under more stressful conditions such as high-speed driving or wide perturbation amplitude.
Introduction
washcoat technology and also attractive due to the >10 year trend of Pd being lower in price than Pt (3). A further recent phenomenon has been the signifi cant efforts focused on thrifting of Rh from TWCs in response to a sharp price spike in 2007 and 2008.
Today the majority of TWCs are Pd/Rh with Pt much less common. It seems reasonable to expect however that there will in future be a similar variety of competing factors which may affect pgm choice just as there has been in the past. For this reason a periodic appraisal of the current status of modern catalysts using the three pgms at a range of typical loadings is of interest. In particular the near 90% fall in the price of Rh since mid-2008 and three-fold increase in the price of Pd since 2009 are reasons why a study may be of interest now.
CatalystTestProgramme
In order to compare the relative activities of TWCs at a range of Pd, Pt and Rh loadings, the following catalysts were prepared. The loadings were chosen without regard to pgm cost, allowing a relevant technical comparison on the basis of pgm mass alone. Details of the compositions are given in Table I. Throughout
this paper pgm loadings are reported in grams per cubic foot (g ft–3) in the format: T/Pt:Pd:Rh where T is the total pgm loading. All three are included for clarity even though in all cases either the Pt or Pd loading is zero.
All catalysts were made on the same substrate, a 4.16 × 4.5 600/4 ceramic. The catalysts were aged in groups of four at Johnson Matthey in Royston, UK, using a lean spike ageing cycle of 80 hours duration with 950ºC inlet temperature, which is correlated to 160,000 km road ageing. The total pgm loadings were chosen to be towards the lower end of the range of those currently supplied to the market, with a view to being able to compare the relative effects of Pd and Pt at constant Rh, the effect of the absolute loading of each of Pt and Pd and also the effect of Rh loading at constant Pd and Pt. A reference catalyst was included in each set to allow comparison of the ageing runs.
The Pd/Rh catalysts evaluated were a current Johnson Matthey production Euro 5 technology. The Pt/Rh washcoat was modifi ed slightly to better suit Pt but was otherwise unchanged in terms of total washcoat loading, oxygen storage material and total rare earth content to better allow comparison of the
Table I
Platinum Group Metal Loadings on Model Three-Way Catalysts Selected for the Present Study
Set Catalyst description Total pgm,
g ft–3
Platinum, g ft–3
Palladium, g ft–3
Rhodium, g ft–3
1 Medium Pd + Rha 30 0 25 5
High Pd + Rh 40 0 35 5
Low Pd + Rh 20 0 15 5
High Pt + Rh 40 35 0 5
2 Medium Pd + Rha 30 0 25 5
High Rh + Pd 32.5 0 25 7.5
Low Rh + Pd 27 0 25 2
Low Pt + Rh 20 15 0 5
3 Medium Pd + Rha 30 0 25 5
Medium Pt + Rh 30 25 0 5
High Rh + Pt 32.5 25 0 7.5
Low Rh + Pt 27 25 0 2
effect of pgm alone. Furthermore if a hypothetical switch from a Pd/Rh technology to a Pt/Rh one was deemed desirable, taking this approach of changing as little as possible other than the pgm would be the easiest and most likely path and so affords the most relevant comparison.
The catalysts were tested over the Motor Vehicle Emissions Group (MVEG-B) European drive cycle as set out in UN/ECE Regulation number 83 (4) on a 1.2 l vehicle with a (current) Euro 5 calibration and were further tested over light-off and lambda sweep protocols on a 2.0 l Euro 5 bench engine. In the light-off test a stable fl ow of exhaust gas at 125 kg h–1 and 0.998 was generated down a bypass exhaust leg, this fl ow was then diverted by means of a valve to a parallel leg containing a cold catalyst in order to monitor dynamic light-off. A catalyst inlet temperature of 450ºC was eventually reached at the end of the test. For the sweep test the fl ow was maintained at the same temperature and fl ow rate but the engine’s air:fuel ratio was adjusted in 15 equal steps from 0.99 to 1.01 and a perturbation of ±4% at 1 Hz was applied. After a stabilisation period of 10 seconds at each condition, gaseous emissions were measured and averaged over a further 5 seconds before moving to the next
setpoint. These fl ow conditions are designed to be stressful for the catalyst, representing a similar fl ow rate to the highest speed part of the European drive cycle but a lower temperature than would ordinarily be seen on a typical close-coupled catalyst at this point of the cycle, with a higher perturbation amplitude.
Vehicle Testing Results
The results of the vehicle tests on the reference catalysts (30/0:25:5) are shown in Table II. Each result is the average of at least three tests. These results would be expected to be identical under ideal conditions; however in practice slight differences in ageing severity from run to run combined with test-to-test error has led to some variation in the results observed. In particular the ageing of Set 2 appears to have been slightly milder than the other two and this makes it diffi cult to compare results across the sets. Nevertheless the data are considered suffi ciently close to make useful comparisons between sets, with care.
Table II also shows the limits specifi ed by Euro 5/6 and it can be seen that in all cases the emissions fall well within those limits.
The results of Set 1 of the test catalysts are shown in Table III. This set allows comparison of the effect
Table II
Vehicle Emission Test Results for the Reference Catalysts Compared to Euro 5 and 6 Limitsa
Set HC, g km–1 Non-methane HC, g km–1 CO, g km–1 NOx, g km–1
1 0.068 0.052 0.281 0.044
2 0.061 0.047 0.243 0.037
3 0.066 0.051 0.245 0.038
Euro 5/6 limits 0.100 0.068 1.000 0.060
a All Reference catalyst loadings were30/0:25:5
Table III
Vehicle Emission Test Results for Catalyst Set 1
Catalyst composition, T/Pt:Pd:Rh
HC, g km–1 Non-methane HC,
g km–1
CO, g km–1 NOx, g km–1
30/0:25:5 a 0.068 0.052 0.281 0.044
40/0:35:5 0.066 0.051 0.264 0.044
20/0:15:5 0.070 0.054 0.263 0.051
40/35:0:5 0.069 0.055 0.297 0.045
of Pd loading at constant Rh and also a comparison of Pt with Pd. In the former case there is a clear but undoubtedly small effect of improved emissions as Pd loading increases. This was, on closer inspection, evident in improved light-off as the Pd loading increased. The emissions of the Pt/Rh catalyst were again clearly, if only slightly, worse for HC and CO. The emissions of all catalysts in this set were actually very similar, suggesting that the most relevant factor is that the Rh loading remains the same in all cases.
Larger differences were seen in Set 2 (Table IV). The effect of Rh loading at constant Pd in the fi rst three catalysts was clear, with the NOx emissions of the low Rh catalyst being ~75% higher than those of the high Rh catalyst. This is not unexpected given the well known role of Rh as an excellent catalyst for the removal of NOx. A 27% increase in HC emissions was also seen however, demonstrating that Rh is also important here. Detailed analysis of the second-by-second emissions
shows that the NOx benefi t could be seen in light-off and also in the extra-urban (high-speed) section of the drive cycle. A consideration of the emissions from this portion of the drive cycle alone showed that the catalyst with 2 g ft–3 Rh emitted ~175 mg of NOx, both of the catalysts with 5 g ft–3 Rh emitted ~140 mg and the catalyst with 7.5 g ft–3 Rh emitted only 90 mg (Figure 1).
The HC benefi t was mainly seen at light-off, however a small difference was also seen in the high-speed section, again corresponding to the Rh loading for the Pd catalysts. The Pt/Rh catalyst with 5 g ft–3 Rh slipped a similar amount of HC in the high-speed section as the Pd/Rh catalyst with 2 g ft–3 Rh and more than the Pd/Rh catalyst with 5g ft–3 Rh, suggesting a very small inherent defi cit in HC conversion for Pt.
Set 3 allows a comparison of Rh loading in a catalyst with constant Pt loading (Table V). Once again a large improvement in NOx was seen as Rh increases and
Table IV
Vehicle Emission Test Results for Catalyst Set 2
Catalyst composition, T/Pt:Pd:Rh
HC, g km–1 Non-methane HC,
g km–1
CO, g km–1 NOx, g km–1
30/0:25:5 a 0.061 0.047 0.243 0.037
32.5/0:25:7.5 0.056 0.042 0.261 0.027
27/0:25:2 0.071 0.056 0.289 0.047
20/15:0:5 0.065 0.050 0.249 0.037
a Reference catalyst
800 850 900 950 1000 1050 1100 1150 1200 Time, s
0.18 0.16 0.14 0.12 0.10 0.08 0.06 0.04 0.02 0
Emissions, g
140
120
100
80
60
40
20
0
Speed, km h
–1
Catalyst Loadings
32.5/0:25:7.5 20/15:0:5 27/0:25:2 30/0:25:5
Scheduled speed
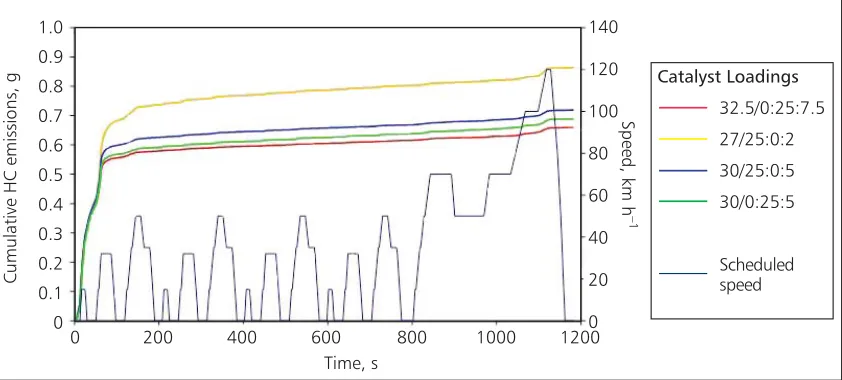
HC also improved, although the benefi t on increasing from 5 g ft–3 to 7.5 g ft–3 was less marked than that seen on going from 2 g ft–3 to 5 g ft–3. The emissions from the 27/25:0:2 Pt/Rh catalyst were relatively poor and in fact the weakest of all in this study. The effect of Rh on HC light-off and on NOx light-off and high-speed performance was seen again, with NOx slip in the high-speed section again varying clearly with Rh loading and with similar performance from both the Pt and Pd-containing 30 g ft–3 catalysts. The second-by-second HC emissions are shown in Figure 2.
Engine Bench Testing Results
Analysis of the second-by-second data shows that the majority of differences occur at the beginning of the test on the pre-lightoff period where there are some variations in engine-out emissions. For this reason analysis was done on emissions post-lightoff or in the
Extra-Urban Driving Cycle (EUDC) (4) section of the drive cycle where these cold start effects are not seen.
Here light-off results are reported by reference to the temperature at which 50% conversion effi ciency is reached, known as T50, and so a lower fi gure refl ects
a more active catalyst. The CO/NOx crossover is a standard measure of catalyst effi ciency and is derived from analysis of the separate CO and NOx effi ciency curves as a function of . A higher reported effi ciency naturally refl ects a more active catalyst. Typically the crossover occurs just rich of 1.00, the stoichiometric air:fuel ratio.
The clear and expected trend of better light-off with more Pd can be seen in the engine bench test results for Set 1 (Table VI) and this is also refl ected in higher conversion effi ciencies. The Pt/Rh catalyst was slightly inferior in light-off and noticeably worse in conversion effi ciency under these stressful test conditions.
Table V
Vehicle Emission Test Results for Catalyst Set 3
Catalyst composition, T/Pt:Pd:Rh
HC, g km–1 Non-methane HC,
g km–1
CO, g km–1 NOx, g km–1
30/0:25:5 a 0.066 0.051 0.245 0.038
30/25:0:5 0.065 0.050 0.228 0.035
32.5/25:0:7.5 0.063 0.051 0.242 0.030
27/25:0:2 0.081 0.062 0.304 0.051
a Reference catalyst
0 200 400 600 800 1000 1200 Time, s
1.0 0.9 0.8 0.7 0.6 0.5 0.4 0.3 0.2 0.1 0
Cumulative HC emissions, g
140
120
100
80
60
40
20
0
Speed, km h
–1
Catalyst Loadings
32.5/0:25:7.5 27/25:0:2 30/25:0:5 30/0:25:5
Scheduled speed
The results for Set 2 are shown in Table VII. In this case the reference catalyst gave the best HC emissions and the conversion effi ciencies were higher overall than for the other two sets, indicative of the milder ageing experienced by this set. Nevertheless the effect of Rh on light-off was once again seen here and the trend in hot effi ciencies was the same as that observed for the vehicle tests. The CO/NOx crossover plot is shown in Figure 3.
The engine bench results for Set 3 (Table VIII), which were all Pt catalysts except for the reference catalyst, show the same broad trends as the vehicle tests. Again the 5 g ft–3 Rh and 7.5 g ft–3 Rh catalysts were closer in performance than the 2 g ft–3 Rh and 5 g ft–3 Rh catalysts, suggesting that 2 g ft–3 is too low a Rh loading for the Pt/Rh catalyst used in this study and that increasing the loading above 2 g ft–3 Rh is highly effective at improving the catalyst performance. There
Table VI
Engine Bench Test Results for Catalyst Set 1
Catalyst composition, T/Pt:Pd:Rh HC T50, ºC NOx T50, ºC Effi ciency at CO/NOx crossover, %
30/0:25:5 a 370 374 96.6
40/0:35:5 365 371 97.4
20/0:15:5 377 375 94.7
40/35:0:5 379 376 95.6
a Reference catalyst
Table VII
Engine Bench Test Results for Catalyst Set 2
Catalyst composition, T/Pt:Pd:Rh HC T50, ºC NOx T50, ºC Effi ciency at CO/NOx crossover, %
30/0:25:5 a 370 375 98.4
32.5/0:25:7.5 354 356 99.0
27/0:25:2 376 379 97.4
20/15:0:5 375 375 97.8
a Reference catalyst
0.99 0.995 1 1.005 1.01 Lambda
100
95
90
85
80
75
CO/NOx conversion, %
Catalyst Loadings
32.5/0:25:7.5 20/15:0:5 27/0:25:2 30/0:25:5
is further evidence from the hot conversion effi ciency that a Pt/Rh catalyst does not perform as well as a Pd/Rh catalyst under these conditions.
The Effects of Different PGM Loadings The milder ageing experienced by Set 2 compared to the other two sets makes it diffi cult to compare the effect of Pt loading when the Rh loading was kept constant at 5 g ft–3, because the tests were carried out across different sets. This may explain why the expected trend towards lower emissions with higher Pt loading cannot clearly be seen. Further tests would be required to confi rm this.
Direct comparisons of Pd and Pt are possible both within and between sets. In the vehicle emissions tests the difference was small or even non-existent. However on the engine bench the clear trend was that, when comparing equally loaded Pd/Rh vs. Pt/Rh catalysts, the Pd/Rh catalysts performed better by a noticeable margin. The sweep test in particular was intended to be stressful for the catalyst, allowing small differences to be exaggerated.
When Pd and Pt are compared, it should be borne in mind that the Pd/Rh catalysts tested were a commercially produced technology which has been optimised for Pd/Rh during development. For the reasons outlined earlier Pt/Rh washcoat development has received less attention and as such the Pt/Rh catalysts tested here should not be considered as fully optimised but as possible readily implemented alternatives to current technology.
Across all sets the effect of a change in the Rh loading was undoubtedly, mass for mass, signifi cantly greater than that of a change in either the Pt or Pd loading. The reduction in emissions which could be achieved by adding a given massof Rh was greater than that which could be achieved by adding the same mass of either Pd or Pt. Conversely the removal of an equivalent amount would have the largest detrimental
effect. Rh has a clear benefi cial effect on light-off for all pollutants both on the specifi c vehicle chosen for this study and on the engine bench. Rh also helped NOx emissions in the high-speed section of the vehicle test and conversion effi ciency on the engine bench.
Finally, it must be noted that each of the ten different pgm compositions tested here for a Euro 5 vehicle has been proven to result in emissions below the Euro 5 (and Euro 6) limits (Table II). This implied fl exibility immediately raises the question of which of these is ‘best’, or indeed if another system could be designed based on this information which might fi t that description. Typically of course this decision will be made on a balance of technical and commercial factors and this study has only begun address the technical aspects of a possible system design.
Conclusions
This study has found, as expected, that increasing either the Pt or Pd loading results in lower emissions and better catalyst performance. The highest and lowest Pd and Pt loadings considered were more than a factor of two different and yet the effect on performance was in the main rather small over the majority of the legislative European drive cycle. The lower amounts of Pd and Pt used were suffi cient, at least in this application, and it may be possible to lower them further. There is a small but noticeable defi cit in performance when comparing Pt with Pd technology.
A slightly wider relative spread of Rh loadings was investigated and here the effect on emissions and performance was signifi cantly larger. In mass terms the changes investigated were much smaller than for Pt or Pd, yet the effect of increasing Rh loading from the lowest levels considered was much greater. This was primarily seen in NOx emissions but a clear effect on HC emissions was also observed. Rh has been shown therefore to be of signifi cant benefi t to both light-off and catalyst performance. Rh thrifting in
Table VIII
Engine Bench Test Results for Catalyst Set 3
Catalyst composition, T/Pt:Pd:Rh HC T50, ºC NOx T50, ºC Effi ciency at CO/NOx crossover, %
30/0:25:5 a 360 357 98.9
30/25:0:5 380 381 97.4
32.5/25:0:7.5 362 360 99.4
27/25:0:2 383 386 91.7
recent years has been in some cases signifi cant and on occasion has been done in conjunction with an increase in overall pgm (most often Pd) loading; this study raises the question of whether in some cases a partial reversal of both of these changes is worthy of serious consideration.
It is not possible in one study to fully evaluate all the many possible combinations of pgms and in terms of legislated vehicle emissions this study is of course confi ned to one application only. The conclusions therefore are necessarily limited, but the following general statements can be made:
(a) A system with low Rh loading can readily be improved by increasing this Rh loading and there is a relatively large effect of doing this by a small amount.
(b) Increasing Pd or Pt loading improves emissions performance by a signifi cantly smaller amount than the effect of Rh loading. Conversely decreasing Pt or Pd may have only a small effect on emissions.
(c) Pd outperforms Pt by a small margin under most conditions, although the difference appears greater under more stressful conditions such as high-speed driving or wide perturbation amplitude.
Acknowledgments
The authors would like to thank the catalyst test laboratories at Johnson Matthey Emission Control Technologies, Royston, for carrying out the work. Johnson Matthey Precious Metals Marketing is thanked for useful discussions.
References
1 M. V. Twigg, Platinum Metals Rev., 1999, 43, (4), 168 2 R. M. Heck, R. J. Farrauto and S. T. Gulati, “Catalytic Air
Pollution Control: Commercial Technology”, 3rd Edn., John Wiley & Sons, Inc, Hoboken, New Jersey, USA, 2009 3 Platinum Today, Price charts: http://www.platinum.
matthey.com/prices/price-charts (Accessed on 19th August 2013)
4 ‘Regulation No 83 of the Economic Commission for Europe of the United Nations (UN/ECE) — Uniform provisions concerning the approval of vehicles with regard to the emission of pollutants according to engine fuel requirements’, Offi cial Journal of the European Union, L 42/1, 15th February, 2012
The Authors
Jonathan Cooper is Gasoline Development Manager at Johnson Matthey Emission Control Technologies in Royston, UK, and has over 13 years’ experience in global gasoline aftertreatment systems research at Johnson Matthey. He holds a degree and DPhil in Chemistry from the University of Oxford, UK.